VFP Production and Injection Tables
Description
What bottomhole pressure does this well need at each rate, tubing-head pressure, water cut and gas-oil ratio, written as a table a reservoir simulator reads? You enter one vertical well's completion and fluid, a gauge test, and the axes of each table. You read off the tubing correlation that best matches the gauge, a FIELD-unit VFPPROD table for the producer and a VFPINJ table for a water injector in the same tubing, ready to copy into the simulator deck.
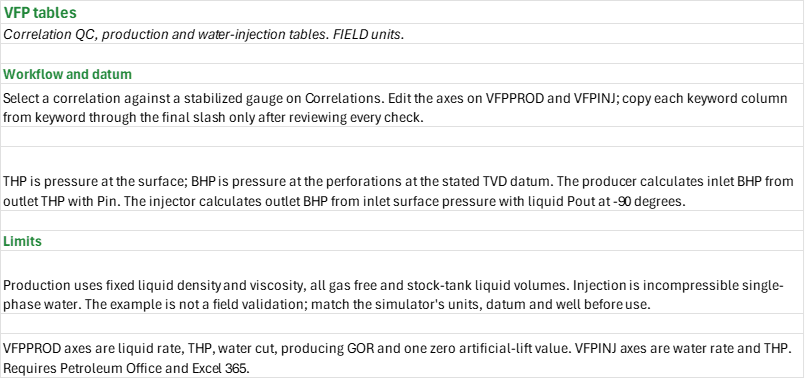
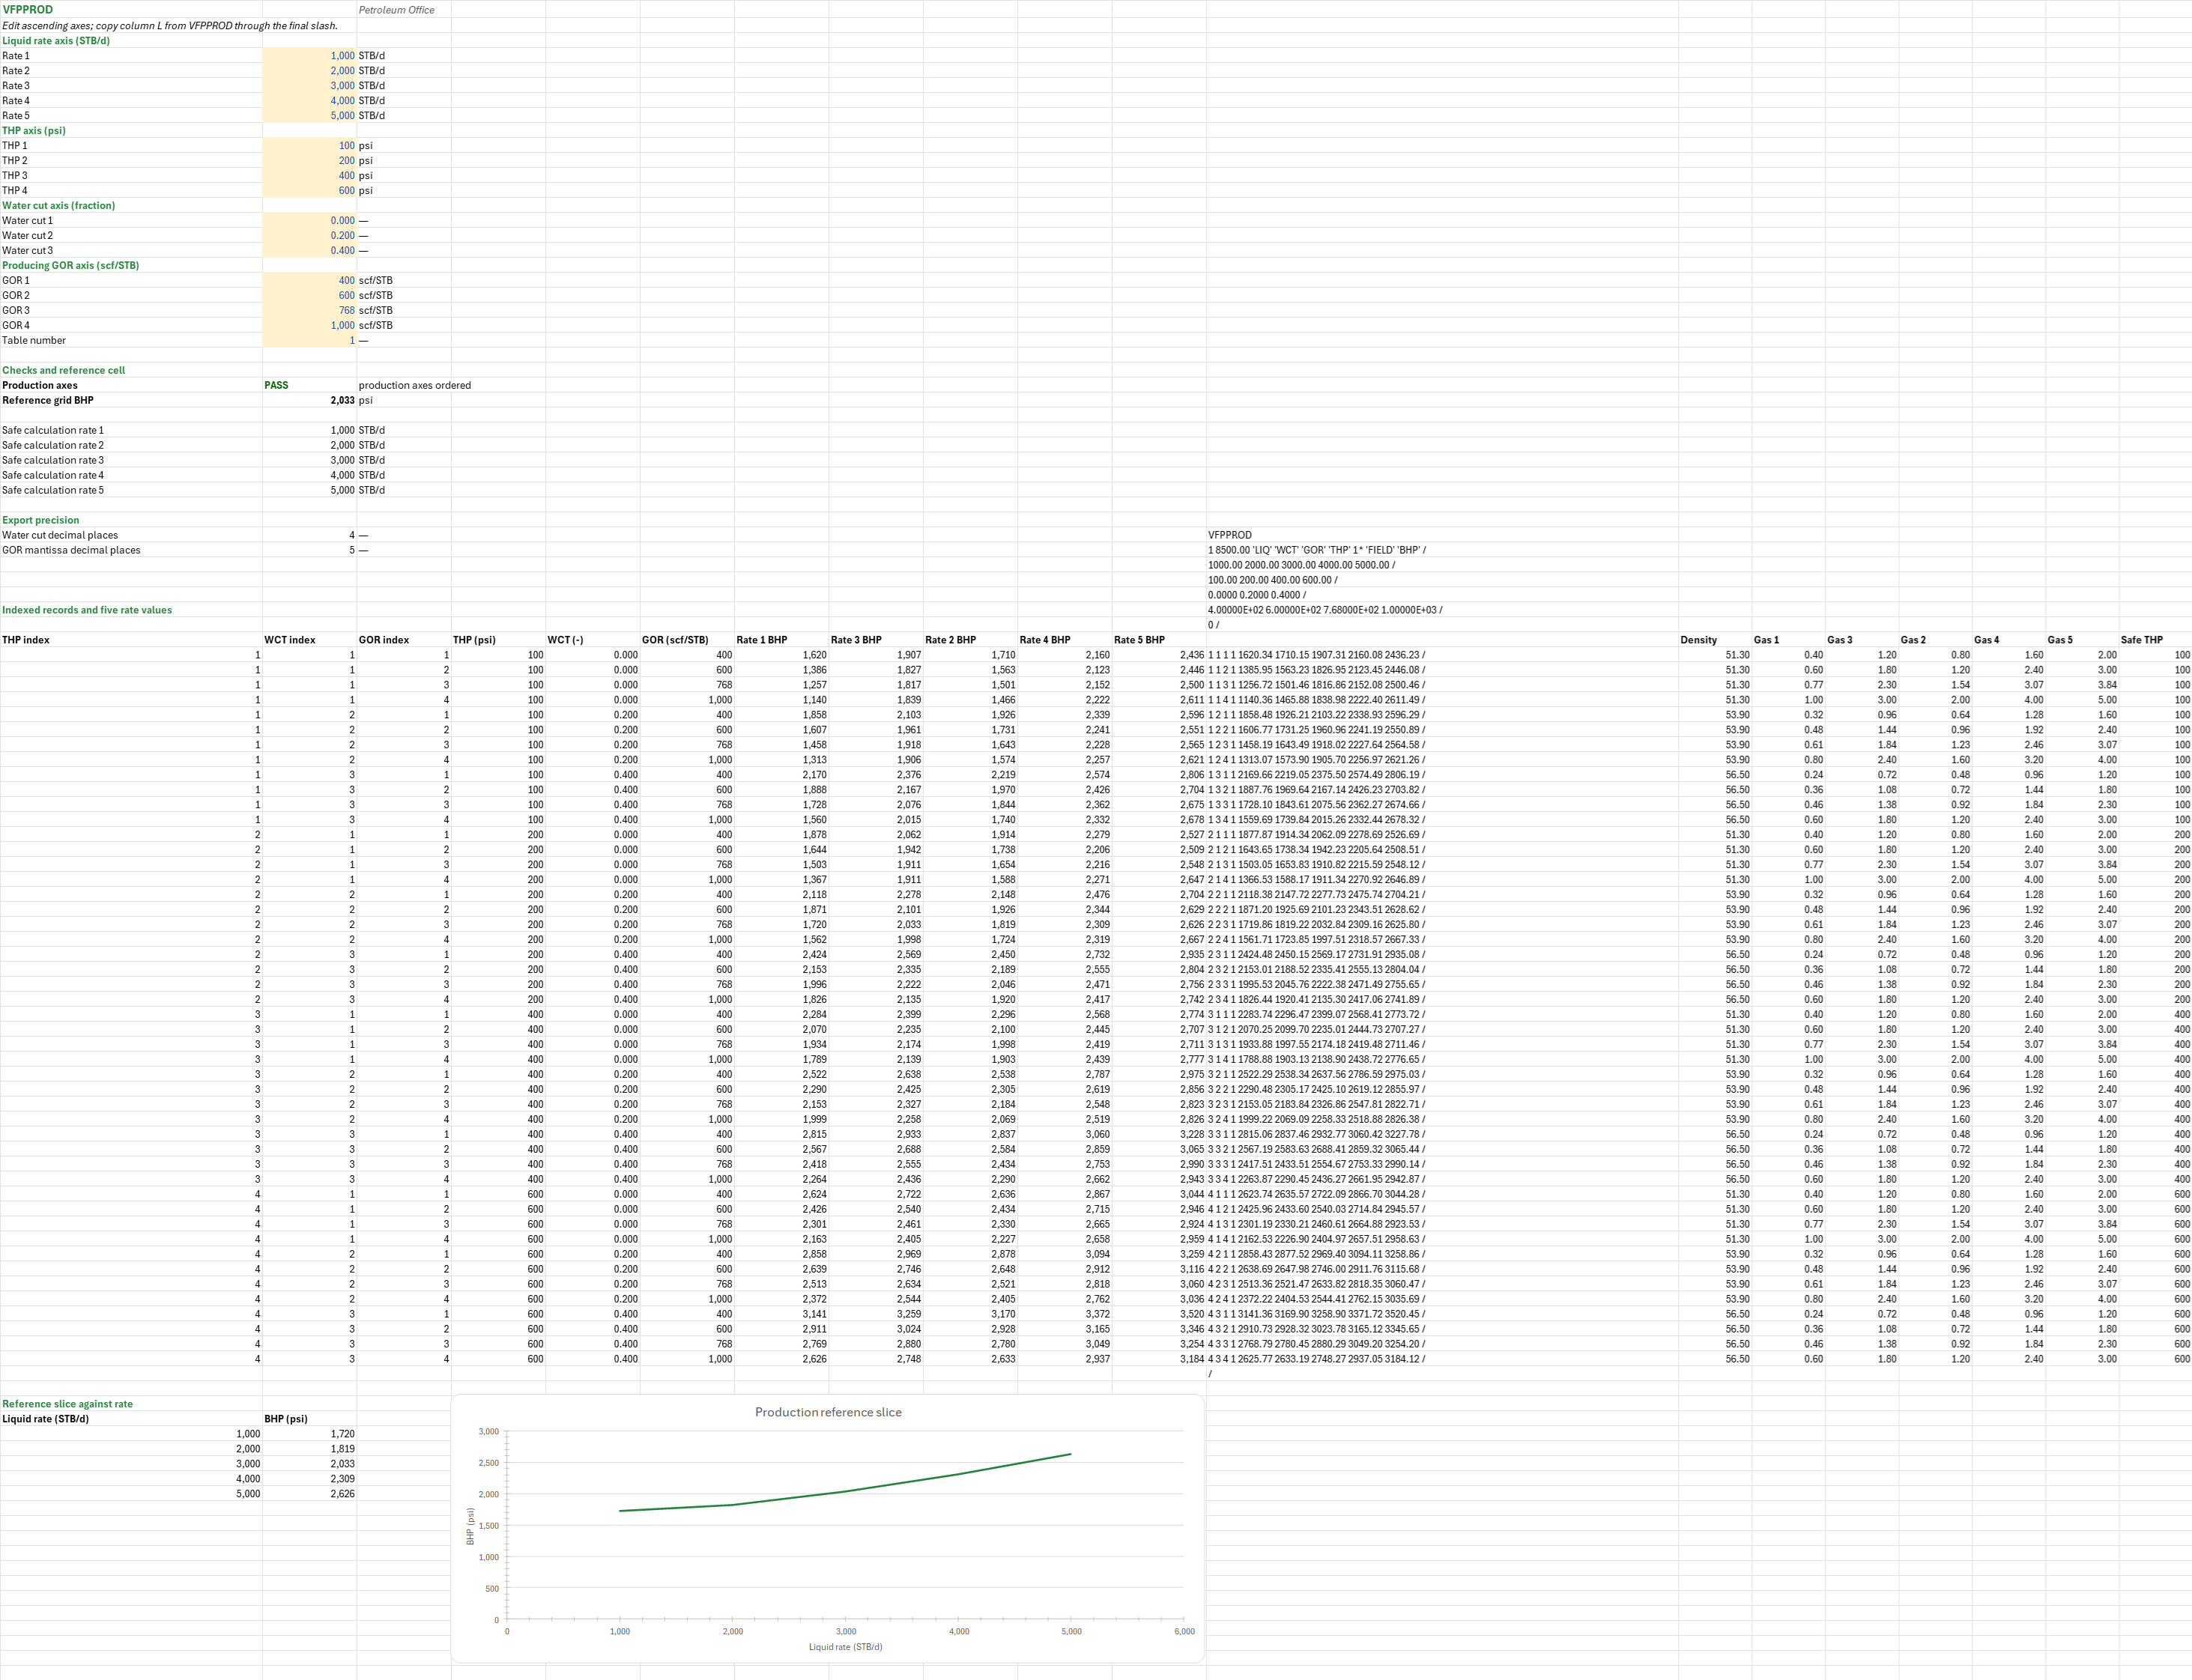
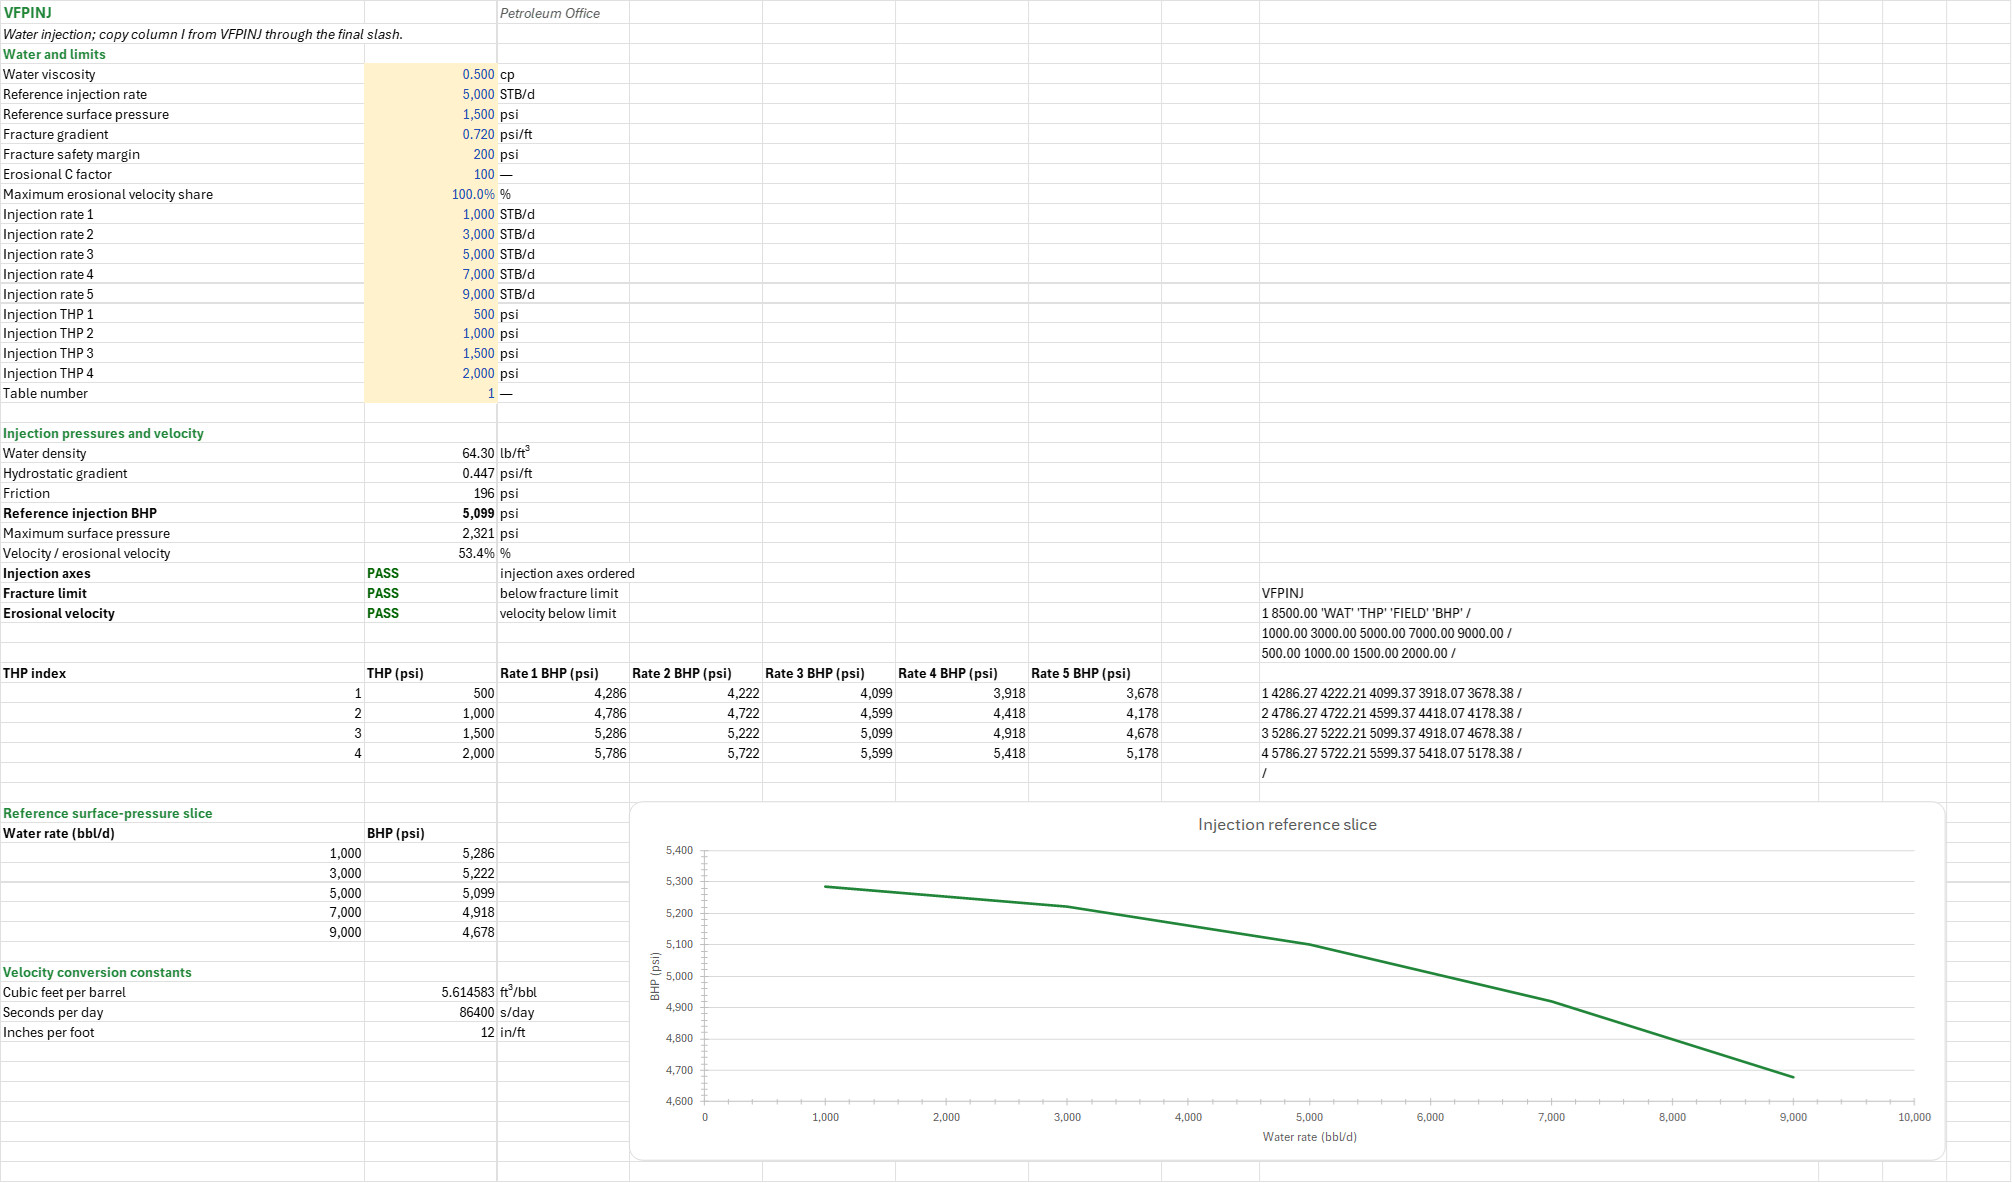
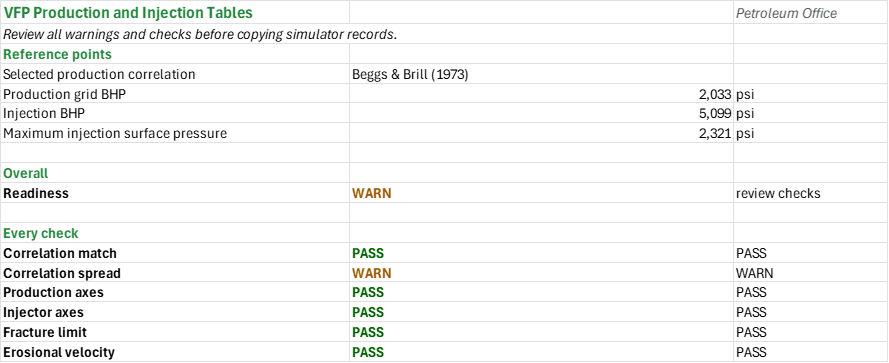
How to use it: Enter the completion, the fluid and a stabilized gauge test on the Correlations sheet, compare the nine production correlations against the gauge and choose one. Type ascending axes on the VFPPROD sheet (5 liquid rates, 4 tubing-head pressures, 3 water cuts and 4 producing gas-oil ratios) and on the VFPINJ sheet (5 water rates and 4 surface pressures, with the injection water, the fracture gradient and the limits). Review every check on the Summary, then copy each keyword column from the keyword through its last slash; an invalid axis withholds the text.
Method: The production BHP is the inlet pressure the chosen correlation gives from the outlet THP. Water cut is water over liquid, and the gas rate is the GOR times the oil rate. The liquid density is the volume-weighted stock-tank oil and water density. The injection BHP is the outlet pressure from the surface inlet pressure, flowing down at -90 degrees; friction and hydrostatic pressure use the single-phase liquid equations. The largest surface injection pressure comes from the fracture gradient at the perforations, the water's hydrostatic gradient, the friction and a safety margin, and the water velocity is compared with API RP 14E's erosional velocity, C over the square root of the density.
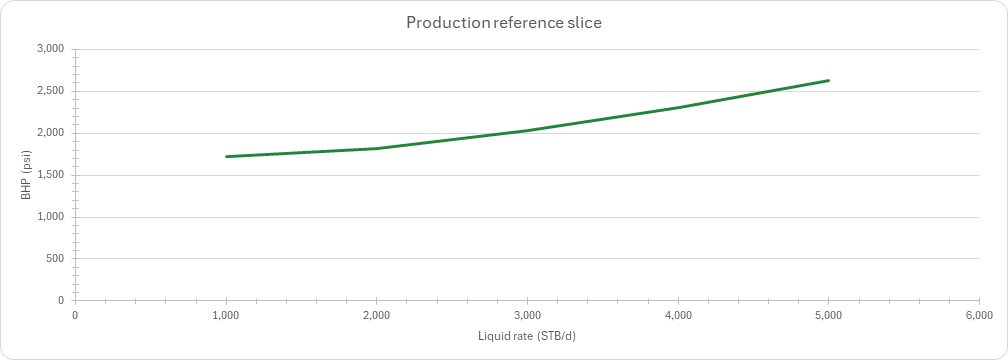
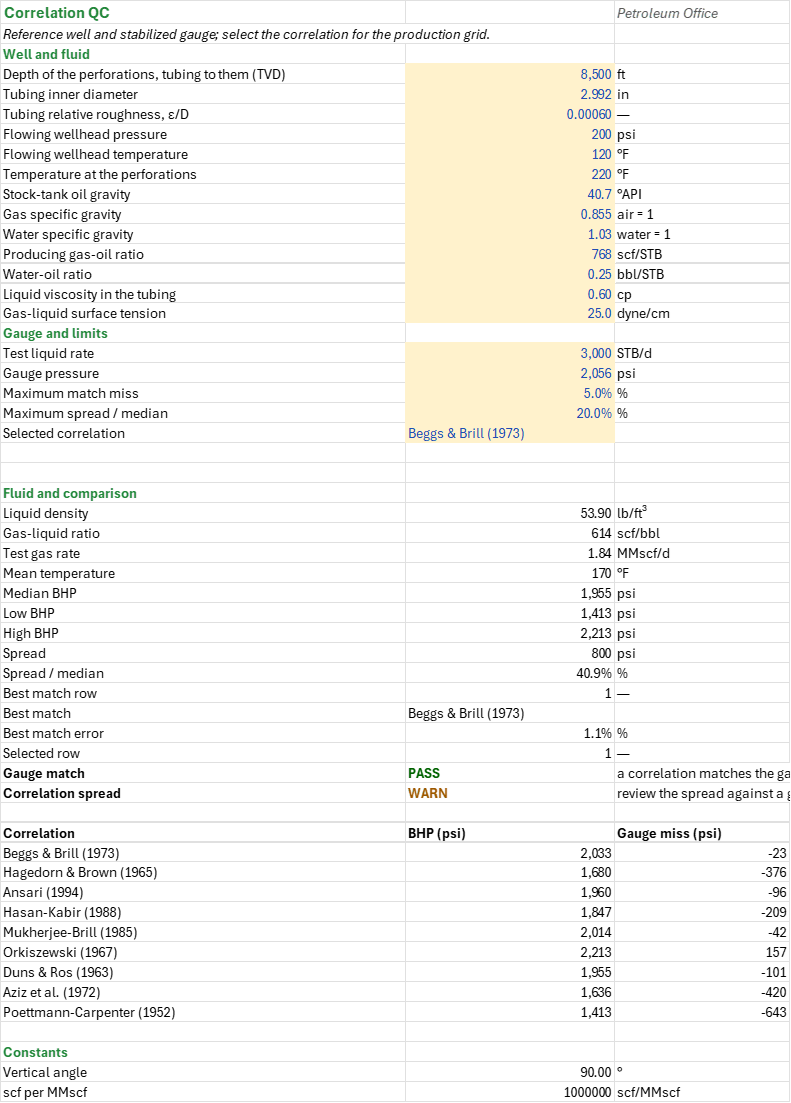
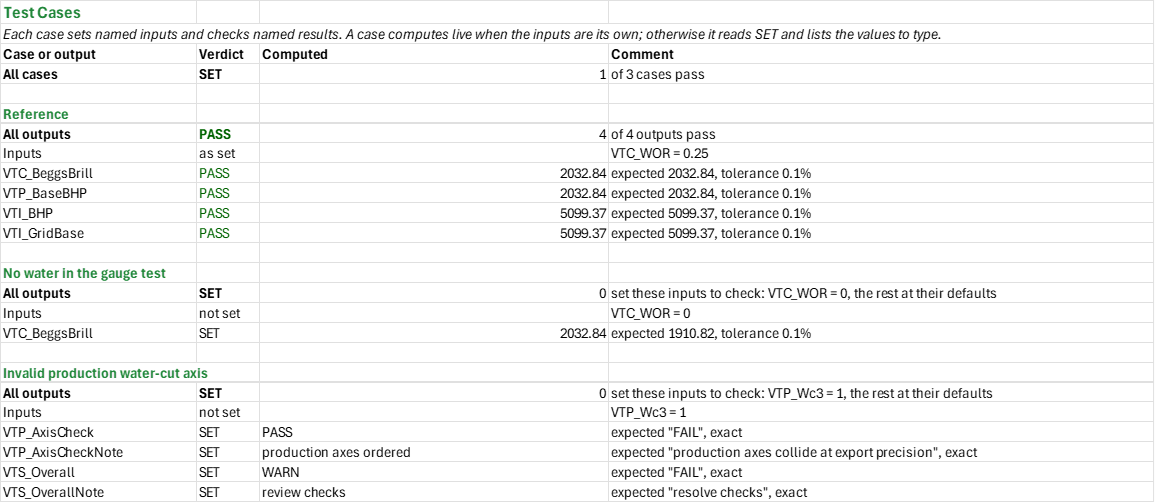
Example: The vertical-lift reference well reaches 8,500 ft in 2.992-in tubing and produces 3,000 STB/d of liquid against 200 psi at the wellhead, with 768 scf/STB GOR and 20% water cut. Beggs-Brill gives approximately 2,032.84 psi at the bottom, against a 2,056 psi gauge. A separate water injector in the same tubing injects 5,000 bbl/d at 1,500 psi surface pressure; its bottomhole pressure is approximately 5,099.37 psi. The spread between the correlations is wide enough to review against the gauge.
Validity
The production model holds liquid density and viscosity fixed, treats all gas as free and uses stock-tank volumes, not a compositional or black-oil PVT traverse. All nine correlations are used here for a vertical well; choose with a representative stabilized test and gauge. The injection model is incompressible single-phase water with a fixed viscosity; the fracture gradient and margin must come from the actual interval. THP is at the surface; BHP and the table datum are at the perforation TVD. Replace the synthetic axes and check the simulator and its unit system before use. FIELD rate is STB/d, pressure psi, depth ft, and GOR scf/STB. Artificial lift is a single zero-valued axis, not a gas-lift model. Pressures are rounded to two decimals in the keyword text; review that against the project's precision needs.
References
- OPM VFPPROD keyword schema.
- OPM VFPINJ keyword schema.
- Beggs, H.D. and Brill, J.P. (1973). A Study of Two-Phase Flow in Inclined Pipes. JPT 25(5), 607-617.
- Hagedorn, A.R. and Brown, K.E. (1965). Experimental Study of Pressure Gradients Occurring During Continuous Two-Phase Flow in Small-Diameter Vertical Conduits. JPT 17(4), 475-484.
- Brill, J.P. and Mukherjee, H. (1999). Multiphase Flow in Wells. SPE Monograph Vol. 17.
- API RP 14E (1991). Design and Installation of Offshore Production Platform Piping Systems, 5th ed. American Petroleum Institute.
Inputs
| Input | Unit | Default | Name |
|---|---|---|---|
| Depth of the perforations, tubing to them (TVD) | ft | 8500 | VTC_TVD |
| Tubing inner diameter | in | 2.992 | VTC_ID |
| Tubing relative roughness, ε/D | — | 0.0006 | VTC_Rough |
| Flowing wellhead pressure | psi | 200 | VTC_Pwh |
| Flowing wellhead temperature | F | 120 | VTC_Twh |
| Temperature at the perforations | F | 220 | VTC_Tbh |
| Stock-tank oil gravity | API | 40.7 | VTC_API |
| Gas specific gravity | — | 0.855 | VTC_SGg |
| Water specific gravity | — | 1.03 | VTC_SGw |
| Producing gas-oil ratio | scf/STB | 768 | VTC_GOR |
| Water-oil ratio | bbl/STB | 0.25 | VTC_WOR |
| Liquid viscosity in the tubing | cp | 0.6 | VTC_UL |
| Gas-liquid surface tension | dyne/cm | 25 | VTC_IFT |
| Test liquid rate | STB/d | 3000 | VTC_QL |
| Gauge pressure | psi | 2056 | VTC_Pmeas |
| Maximum match miss | fraction | see the Correlations sheet | VTC_MatchTol |
| Maximum spread / median | fraction | see the Correlations sheet | VTC_SpreadTol |
| Selected correlation (from a list) | — | Beggs & Brill (1973) | VTC_Selected |
| Rate 1 to Rate 5, ascending | STB/d | 1000-5000 | VTP_Rate1 to VTP_Rate5 |
| THP 1 to THP 4, ascending | psi | 100-600 | VTP_Thp1 to VTP_Thp4 |
| Water cut 1 to Water cut 3, ascending | fraction | 0-0.4 | VTP_Wc1 to VTP_Wc3 |
| GOR 1 to GOR 4, ascending | scf/STB | 400-1000 | VTP_Gor1 to VTP_Gor4 |
| Table number (production) | integer | 1 | VTP_Table |
| Water viscosity | cp | 0.5 | VTI_UW |
| Reference injection rate | bbl/d | 5000 | VTI_Q |
| Reference surface pressure | psi | 1500 | VTI_Ps |
| Fracture gradient | psi/ft | 0.72 | VTI_FG |
| Fracture safety margin | psi | 200 | VTI_Margin |
| Erosional C factor | — | 100 | VTI_C |
| Maximum erosional velocity share | fraction | 1 | VTI_VeMax |
| Injection rate 1 to 5, ascending | bbl/d | 1000-9000 | VTI_Rate1 to VTI_Rate5 |
| Injection THP 1 to 4, ascending | psi | 500-2000 | VTI_Thp1 to VTI_Thp4 |
| Table number (injection) | integer | 1 | VTI_Table |
Sheets
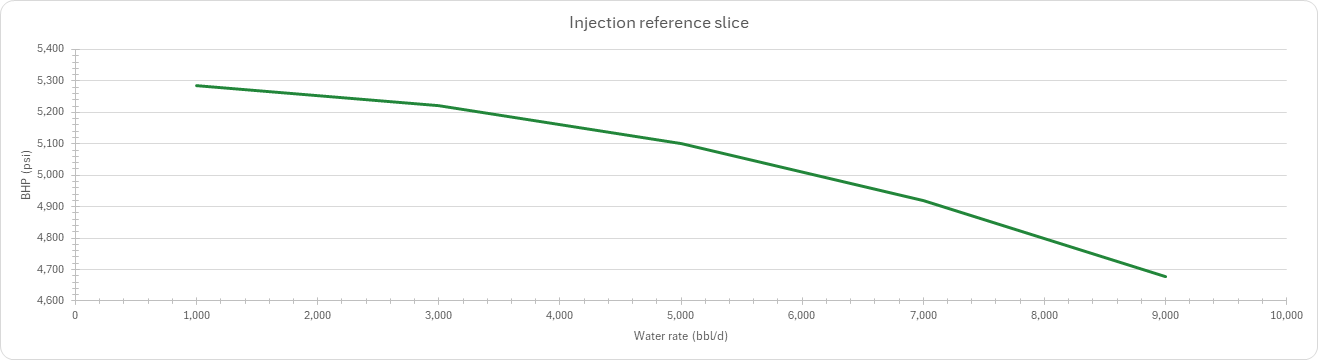
Guide— the workflow, the pressure datum (THP at the surface, BHP at the perforations) and the model's limits.Correlations— the well, fluid and gauge test, the nine production correlations' bottomhole pressures and misses against the gauge, their spread, the best match and the correlation chosen for the production table.VFPPROD— the four production axes, 5 liquid rates by 4 tubing-head pressures by 3 water cuts by 4 producing gas-oil ratios, the VFPPROD keyword text to copy, and a chart of the reference slice against liquid rate.VFPINJ— the injection water, limits and axes, 5 water rates by 4 surface pressures, the reference injection BHP, the fracture-limited surface pressure and the erosional-velocity ratio, the VFPINJ keyword text, and a chart of the reference slice against water rate.Summary— the chosen correlation, the reference pressures and every check under one verdict.Test Cases— the worked example and other cases, with expected and computed results.
Functions used
Names (130)
| Name | Refers to | Comment |
|---|---|---|
PO.PE.Inj.FracPressureLAMBDA |
=LAMBDA(frac_gradient, tvd, fluid_gradient, friction, margin, IF(OR(frac_gradient<=0, tvd<=0, fluid_gradient<=0, friction<0, margin<0), NA(), frac_gradient*tvd-fluid_gradient*tvd+friction-margin)) |
Maximum surface injection pressure, psi: frac_gradient·tvd (fracture pressure) − fluid_gradient·tvd (the column) + friction (tubing loss at the rate) − margin (the safety margin kept below fracture pressure). |
PO.VFP.Corr.MatchLAMBDA |
=LAMBDA(predicted, measured, row, LET(n, ROWS(predicted), m, COLUMNS(predicted), i, INT(row), ones, SEQUENCE(m, 1, 1, 0), num, --ISNUMBER(predicted), err, IFERROR(ABS(predicted-measured)/measured, 0), full, IF(m=1, num, MMULT(num, ones))=m, aare, IF(m=1, err, MMULT(err, ones))/m, k, COUNT(measured), valid, AND(IFERROR(ROWS(measured), 1)=1, OR(k=1, k=m), IFERROR(COLUMNS(measured), 1)=k, MIN(measured)>0), IF(OR(NOT(valid), i<0, i>n, row<>i), NA(), IF(i=0, MATCH(1, full*(aare=MIN(FILTER(aare, full, NA()))), 0), IF(SUM((SEQUENCE(n)=i)*full)=1, SUM((SEQUENCE(n)=i)*aare), NA()))))) |
Scores flow correlations against measured pressures: predicted has one row per correlation, measured one value or a row of m survey values. row = i gives row i's average absolute relative error (AARE); row = 0 the row with the least. |
VTP_SelectedPinLAMBDA |
=LAMBDA(q_liq,q_gas,p_out,rho_liq,IF(VTC_SelectedRow=1,PO.VFP.BeggsBrill.Pin(q_liq,q_gas,p_out,VTC_Tm,rho_liq,VTC_UL,VTC_SGg,VTC_IFT,VTC_ID,VTC_TVD,VTC_Rough,VTC_Vert),IF(VTC_SelectedRow=2,PO.VFP.HagedornBrown.Pin(q_liq,q_gas,p_out,VTC_Tm,rho_liq,VTC_UL,VTC_SGg,VTC_IFT,VTC_ID,VTC_TVD,VTC_Rough),IF(VTC_SelectedRow=3,PO.VFP.Ansari.Pin(q_liq,q_gas,p_out,VTC_Tm,rho_liq,VTC_UL,VTC_SGg,VTC_IFT,VTC_ID,VTC_TVD,VTC_Rough),IF(VTC_SelectedRow=4,PO.VFP.HasanKabir.Pin(q_liq,q_gas,p_out,VTC_Tm,rho_liq,VTC_UL,VTC_SGg,VTC_IFT,VTC_ID,VTC_TVD,VTC_Rough,VTC_Vert),IF(VTC_SelectedRow=5,PO.VFP.MukherjeeBrill.Pin(q_liq,q_gas,p_out,VTC_Tm,rho_liq,VTC_UL,VTC_SGg,VTC_IFT,VTC_ID,VTC_TVD,VTC_Rough,VTC_Vert),IF(VTC_SelectedRow=6,PO.VFP.Orkiszewski.Pin(q_liq,q_gas,p_out,VTC_Tm,rho_liq,VTC_UL,VTC_SGg,VTC_IFT,VTC_ID,VTC_TVD,VTC_Rough),IF(VTC_SelectedRow=7,PO.VFP.DunsRos.Pin(q_liq,q_gas,p_out,VTC_Tm,rho_liq,VTC_UL,VTC_SGg,VTC_IFT,VTC_ID,VTC_TVD,VTC_Rough),IF(VTC_SelectedRow=8,PO.VFP.Aziz.Pin(q_liq,q_gas,p_out,VTC_Tm,rho_liq,VTC_UL,VTC_SGg,VTC_IFT,VTC_ID,VTC_TVD,VTC_Rough),PO.VFP.PoettmannCarpenter.Pin(q_liq,q_gas,p_out,VTC_Tm,rho_liq,VTC_UL,VTC_SGg,VTC_IFT,VTC_ID,VTC_TVD,VTC_Rough)))))))))) |
|
VTC_API |
Correlations!$B$10 |
Stock-tank oil gravity, °API |
VTC_Ansari |
Correlations!$B$45 |
Ansari (1994) BHP |
VTC_Aziz |
Correlations!$B$50 |
Aziz et al. (1972) BHP |
VTC_BeggsBrill |
Correlations!$B$43 |
Beggs & Brill (1973) BHP |
VTC_Best |
Correlations!$B$36 |
Best match |
VTC_BestErr |
Correlations!$B$37 |
Best match error, % |
VTC_BestRow |
Correlations!$B$35 |
Best match row |
VTC_Compare |
Correlations!$A$43:$C$51 |
Nine correlation pressures and misses |
VTC_DunsRos |
Correlations!$B$49 |
Duns & Ros (1963) BHP |
VTC_GLR |
Correlations!$B$27 |
Gas-liquid ratio, scf/bbl |
VTC_GOR |
Correlations!$B$13 |
Producing gas-oil ratio, scf/STB |
VTC_HagedornBrown |
Correlations!$B$44 |
Hagedorn & Brown (1965) BHP |
VTC_HasanKabir |
Correlations!$B$46 |
Hasan-Kabir (1988) BHP |
VTC_High |
Correlations!$B$32 |
High BHP, psi |
VTC_ID |
Correlations!$B$5 |
Tubing inner diameter, in |
VTC_IFT |
Correlations!$B$16 |
Gas-liquid surface tension, dyne/cm |
VTC_Inputs |
Correlations!$B$4:$B$23 |
Reference well, gauge, limits and correlation selection |
VTC_Low |
Correlations!$B$31 |
Low BHP, psi |
VTC_MatchCheck |
Correlations!$B$39 |
Gauge match verdict |
VTC_MatchCheckNote |
Correlations!$C$39 |
Gauge match comment |
VTC_MatchTol |
Correlations!$B$20 |
Maximum match miss, % |
VTC_Median |
Correlations!$B$30 |
Median BHP, psi |
VTC_MukherjeeBrill |
Correlations!$B$47 |
Mukherjee-Brill (1985) BHP |
VTC_Orkiszewski |
Correlations!$B$48 |
Orkiszewski (1967) BHP |
VTC_Pmeas |
Correlations!$B$19 |
Gauge pressure, psi |
VTC_PoettmannCarpenter |
Correlations!$B$51 |
Poettmann-Carpenter (1952) BHP |
VTC_Pwh |
Correlations!$B$7 |
Flowing wellhead pressure, psi |
VTC_QL |
Correlations!$B$18 |
Test liquid rate, STB/d |
VTC_Qg |
Correlations!$B$28 |
Test gas rate, MMscf/d |
VTC_Results |
Correlations!$B$26:$B$40 |
Fluid, comparison and checks |
VTC_RhoL |
Correlations!$B$26 |
Liquid density, lb/ft³ |
VTC_Rough |
Correlations!$B$6 |
Tubing relative roughness, ε/D |
VTC_SGg |
Correlations!$B$11 |
Gas specific gravity, air = 1 |
VTC_SGw |
Correlations!$B$12 |
Water specific gravity, water = 1 |
VTC_Scf |
Correlations!$B$55 |
scf per MMscf, scf/MMscf |
VTC_Selected |
Correlations!$B$22 |
Selected correlation |
VTC_SelectedRow |
Correlations!$B$38 |
Selected row |
VTC_Spread |
Correlations!$B$33 |
Spread, psi |
VTC_SpreadCheck |
Correlations!$B$40 |
Correlation spread verdict |
VTC_SpreadCheckNote |
Correlations!$C$40 |
Correlation spread comment |
VTC_SpreadShare |
Correlations!$B$34 |
Spread / median, % |
VTC_SpreadTol |
Correlations!$B$21 |
Maximum spread / median, % |
VTC_TVD |
Correlations!$B$4 |
Depth of the perforations, tubing to them (TVD), ft |
VTC_Tbh |
Correlations!$B$9 |
Temperature at the perforations, °F |
VTC_Tm |
Correlations!$B$29 |
Mean temperature, °F |
VTC_Twh |
Correlations!$B$8 |
Flowing wellhead temperature, °F |
VTC_UL |
Correlations!$B$15 |
Liquid viscosity in the tubing, cp |
VTC_Vert |
Correlations!$B$54 |
Vertical angle, ° |
VTC_WOR |
Correlations!$B$14 |
Water-oil ratio, bbl/STB |
VTI_AxisCheck |
VFPINJ!$B$29 |
Injection axes verdict |
VTI_AxisCheckNote |
VFPINJ!$C$29 |
Injection axes comment |
VTI_BHP |
VFPINJ!$B$26 |
Reference injection BHP, psi |
VTI_C |
VFPINJ!$B$9 |
Erosional C factor |
VTI_ErosionCheck |
VFPINJ!$B$31 |
Erosional velocity verdict |
VTI_ErosionCheckNote |
VFPINJ!$C$31 |
Erosional velocity comment |
VTI_FG |
VFPINJ!$B$7 |
Fracture gradient, psi/ft |
VTI_FracCheck |
VFPINJ!$B$30 |
Fracture limit verdict |
VTI_FracCheckNote |
VFPINJ!$C$30 |
Fracture limit comment |
VTI_Fric |
VFPINJ!$B$25 |
Friction, psi |
VTI_Ft3PerBbl |
VFPINJ!$B$50 |
Cubic feet per barrel, ft³/bbl |
VTI_Gf |
VFPINJ!$B$24 |
Hydrostatic gradient, psi/ft |
VTI_Grid |
VFPINJ!$A$35:$G$38 |
Four pressures by five injection rates |
VTI_GridBase |
VFPINJ!$E$37 |
Grid BHP at reference injection rate and pressure |
VTI_InPerFt |
VFPINJ!$B$52 |
Inches per foot, in/ft |
VTI_Inputs |
VFPINJ!$B$4:$B$20 |
Water, reference operating point, limits and axes |
VTI_Keyword |
VFPINJ!$I$30:$I$39 |
VFPINJ keyword records |
VTI_MASP |
VFPINJ!$B$27 |
Maximum surface pressure, psi |
VTI_Margin |
VFPINJ!$B$8 |
Fracture safety margin, psi |
VTI_Ps |
VFPINJ!$B$6 |
Reference surface pressure, psi |
VTI_Q |
VFPINJ!$B$5 |
Reference injection rate, STB/d |
VTI_Rate1 |
VFPINJ!$B$11 |
Injection rate 1, STB/d |
VTI_Rate2 |
VFPINJ!$B$12 |
Injection rate 2, STB/d |
VTI_Rate3 |
VFPINJ!$B$13 |
Injection rate 3, STB/d |
VTI_Rate4 |
VFPINJ!$B$14 |
Injection rate 4, STB/d |
VTI_Rate5 |
VFPINJ!$B$15 |
Injection rate 5, STB/d |
VTI_ReferenceSlice |
VFPINJ!$A$43:$B$47 |
Reference surface-pressure slice by water rate |
VTI_Results |
VFPINJ!$B$23:$B$31 |
Water, pressures, velocity and checks |
VTI_Rho |
VFPINJ!$B$23 |
Water density, lb/ft³ |
VTI_SecPerDay |
VFPINJ!$B$51 |
Seconds per day, s/day |
VTI_Table |
VFPINJ!$B$20 |
Table number |
VTI_Thp1 |
VFPINJ!$B$16 |
Injection THP 1, psi |
VTI_Thp2 |
VFPINJ!$B$17 |
Injection THP 2, psi |
VTI_Thp3 |
VFPINJ!$B$18 |
Injection THP 3, psi |
VTI_Thp4 |
VFPINJ!$B$19 |
Injection THP 4, psi |
VTI_UW |
VFPINJ!$B$4 |
Water viscosity, cp |
VTI_VRatio |
VFPINJ!$B$28 |
Velocity / erosional velocity, % |
VTI_VeMax |
VFPINJ!$B$10 |
Maximum erosional velocity share, % |
VTP_AxisCheck |
VFPPROD!$B$26 |
Production axes verdict |
VTP_AxisCheckNote |
VFPPROD!$C$26 |
Production axes comment |
VTP_BaseBHP |
VFPPROD!$B$27 |
Reference grid BHP, psi |
VTP_Gor1 |
VFPPROD!$B$19 |
GOR 1, scf/STB |
VTP_Gor2 |
VFPPROD!$B$20 |
GOR 2, scf/STB |
VTP_Gor3 |
VFPPROD!$B$21 |
GOR 3, scf/STB |
VTP_Gor4 |
VFPPROD!$B$22 |
GOR 4, scf/STB |
VTP_Grid |
VFPPROD!$A$44:$K$91 |
48 THP, water-cut and GOR combinations, five rate values each |
VTP_Inputs |
VFPPROD!$B$4:$B$23 |
Editable axes and table number |
VTP_Keyword |
VFPPROD!$L$36:$L$92 |
VFPPROD keyword records |
VTP_Rate1 |
VFPPROD!$B$4 |
Rate 1, STB/d |
VTP_Rate2 |
VFPPROD!$B$5 |
Rate 2, STB/d |
VTP_Rate3 |
VFPPROD!$B$6 |
Rate 3, STB/d |
VTP_Rate4 |
VFPPROD!$B$7 |
Rate 4, STB/d |
VTP_Rate5 |
VFPPROD!$B$8 |
Rate 5, STB/d |
VTP_ReferenceSlice |
VFPPROD!$A$96:$B$100 |
Reference THP, WCT and GOR slice by liquid rate |
VTP_Results |
VFPPROD!$B$26:$B$27 |
Axis verdict and reference grid value |
VTP_SafeRate1 |
VFPPROD!$B$29 |
Safe calculation rate 1, STB/d |
VTP_SafeRate2 |
VFPPROD!$B$30 |
Safe calculation rate 2, STB/d |
VTP_SafeRate3 |
VFPPROD!$B$31 |
Safe calculation rate 3, STB/d |
VTP_SafeRate4 |
VFPPROD!$B$32 |
Safe calculation rate 4, STB/d |
VTP_SafeRate5 |
VFPPROD!$B$33 |
Safe calculation rate 5, STB/d |
VTP_SciDigits |
VFPPROD!$B$37 |
GOR mantissa decimal places |
VTP_Table |
VFPPROD!$B$23 |
Table number |
VTP_Thp1 |
VFPPROD!$B$10 |
THP 1, psi |
VTP_Thp2 |
VFPPROD!$B$11 |
THP 2, psi |
VTP_Thp3 |
VFPPROD!$B$12 |
THP 3, psi |
VTP_Thp4 |
VFPPROD!$B$13 |
THP 4, psi |
VTP_Wc1 |
VFPPROD!$B$15 |
Water cut 1 |
VTP_Wc2 |
VFPPROD!$B$16 |
Water cut 2 |
VTP_Wc3 |
VFPPROD!$B$17 |
Water cut 3 |
VTP_WcDigits |
VFPPROD!$B$36 |
Water cut decimal places |
VTS_Checks |
Summary!$B$13:$B$18 |
All workbook checks |
VTS_InjBHP |
Summary!$B$6 |
Injection BHP, psi |
VTS_MASP |
Summary!$B$7 |
Maximum injection surface pressure, psi |
VTS_Overall |
Summary!$B$10 |
Readiness verdict |
VTS_OverallNote |
Summary!$C$10 |
Readiness comment |
VTS_ProdBHP |
Summary!$B$5 |
Production grid BHP, psi |
VTS_Results |
Summary!$B$4:$B$10 |
Headline values and overall readiness |
VTS_Selected |
Summary!$B$4 |
Selected production correlation |
Details
| Opens in | Needs the Petroleum Office add-in: its PO functions show #NAME? without it once Excel recalculates. Needs Microsoft 365 or Excel 2024: it uses functions Excel 2016 doesn't have, such as named LAMBDAs, which show #NAME? there. |
| File | VfpTables.xlsx, 62 KB |
| Category | Production |
| For agents and tools | Descriptor (.md) |