Nodal Analysis
Description
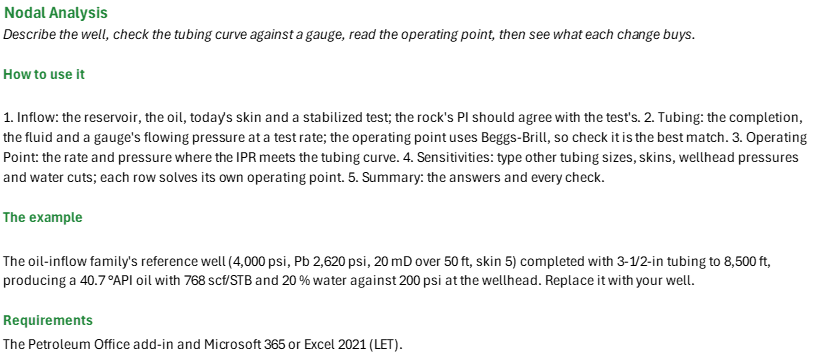
At what rate and pressure will this oil well flow, and what moves that rate most? You enter the reservoir and inflow data with a stabilized test, the completion and fluid, and a gauge reading on test. You read off the composite IPR and its AOF, the tubing correlation that best matches the gauge, the operating point where the IPR crosses the tubing curve, and how tubing size, skin, wellhead pressure and water cut change the oil rate. Field units; the node is at the bottom of the hole.
How to use it: On the Inflow sheet, enter k h and the skin from a buildup, Bo and μo at Pr from the PVT report, and a stabilized test above Pb; check the rock's PI against the test's. On the Tubing sheet, enter the completion, the producing GOR and WOR, and a gauge's flowing pressure with the test's wellhead pressure, and see which of the nine correlations matches the gauge. Read the operating point and its flow, stability and IPR checks on the Operating Point sheet. On the Sensitivities sheet, type the cases you are weighing over the table's fifteen values. The Summary gathers the answers and the checks.
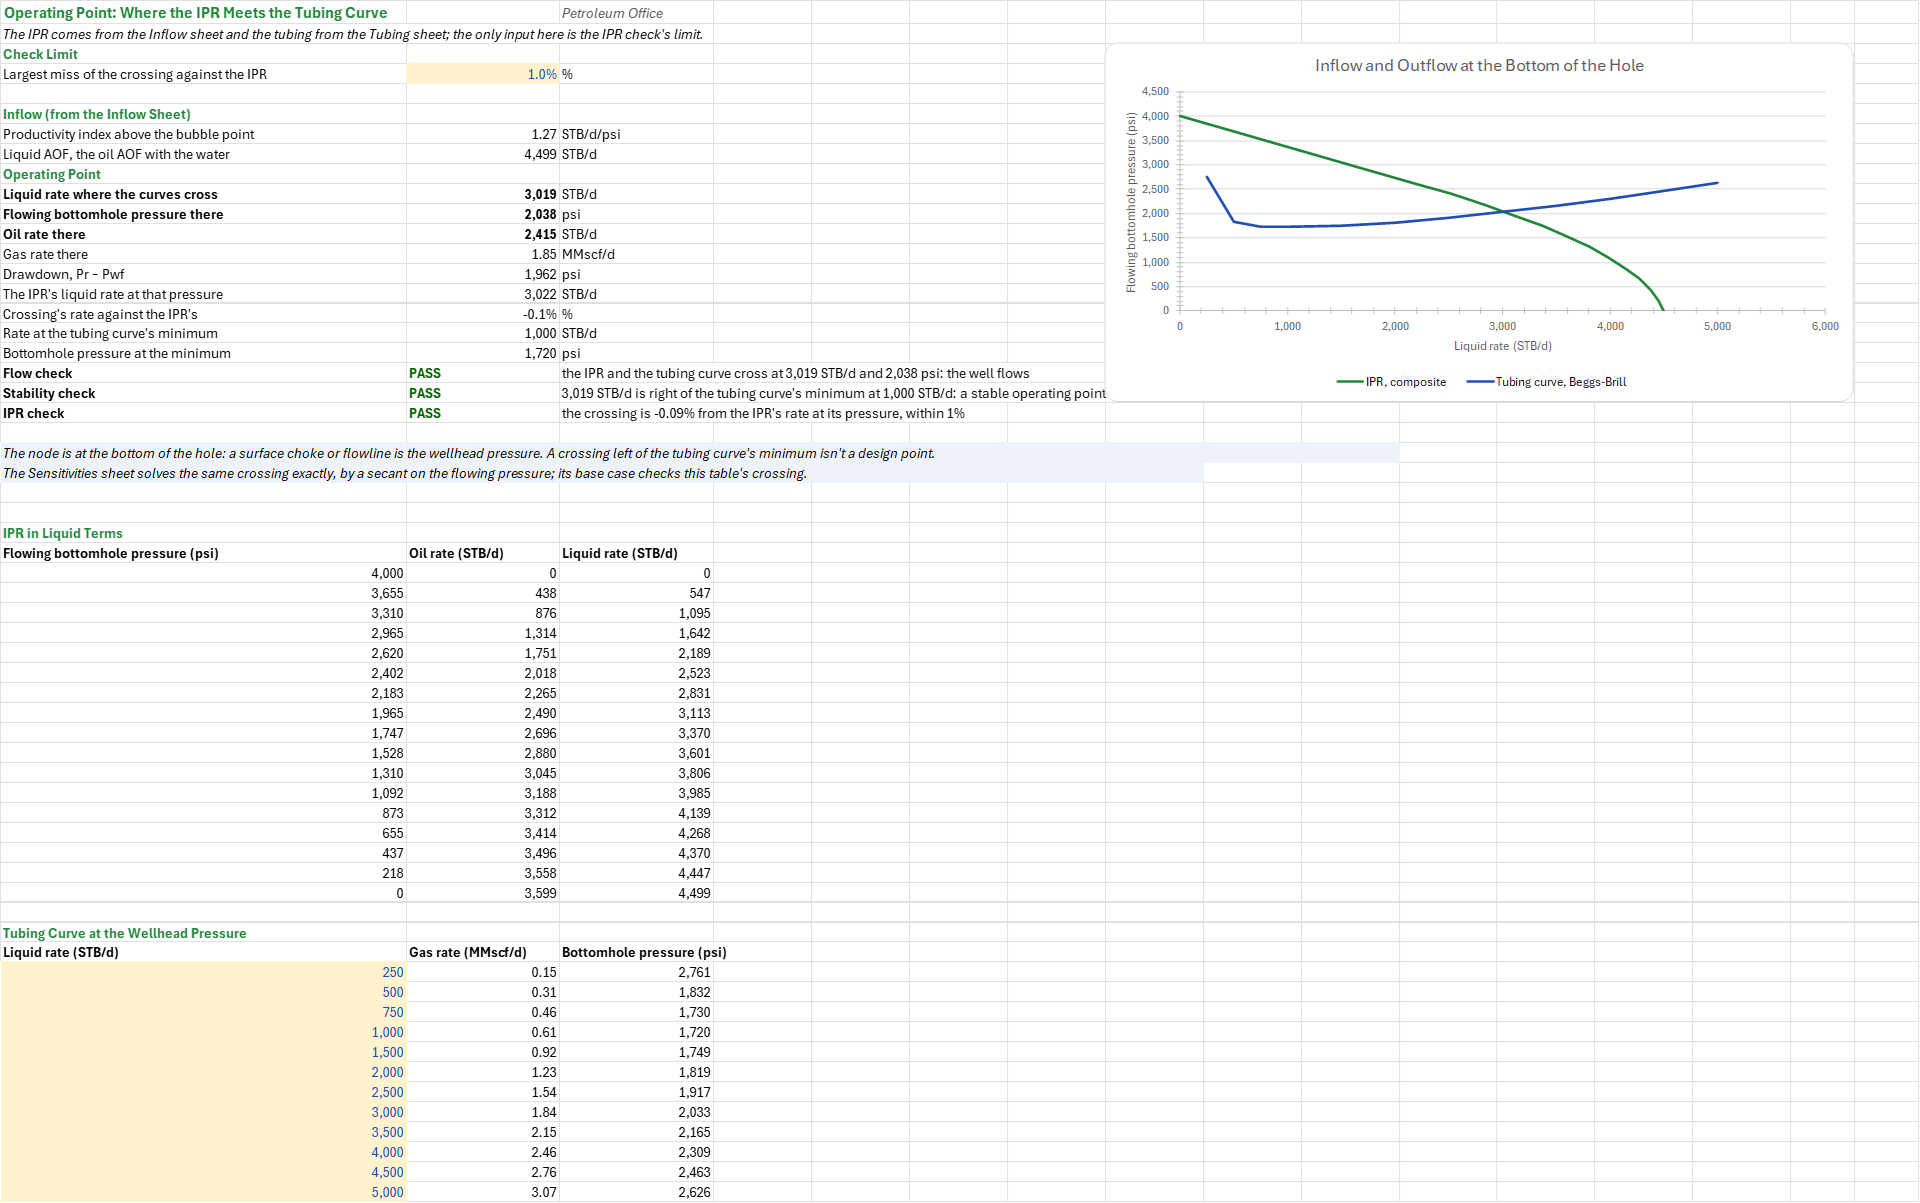
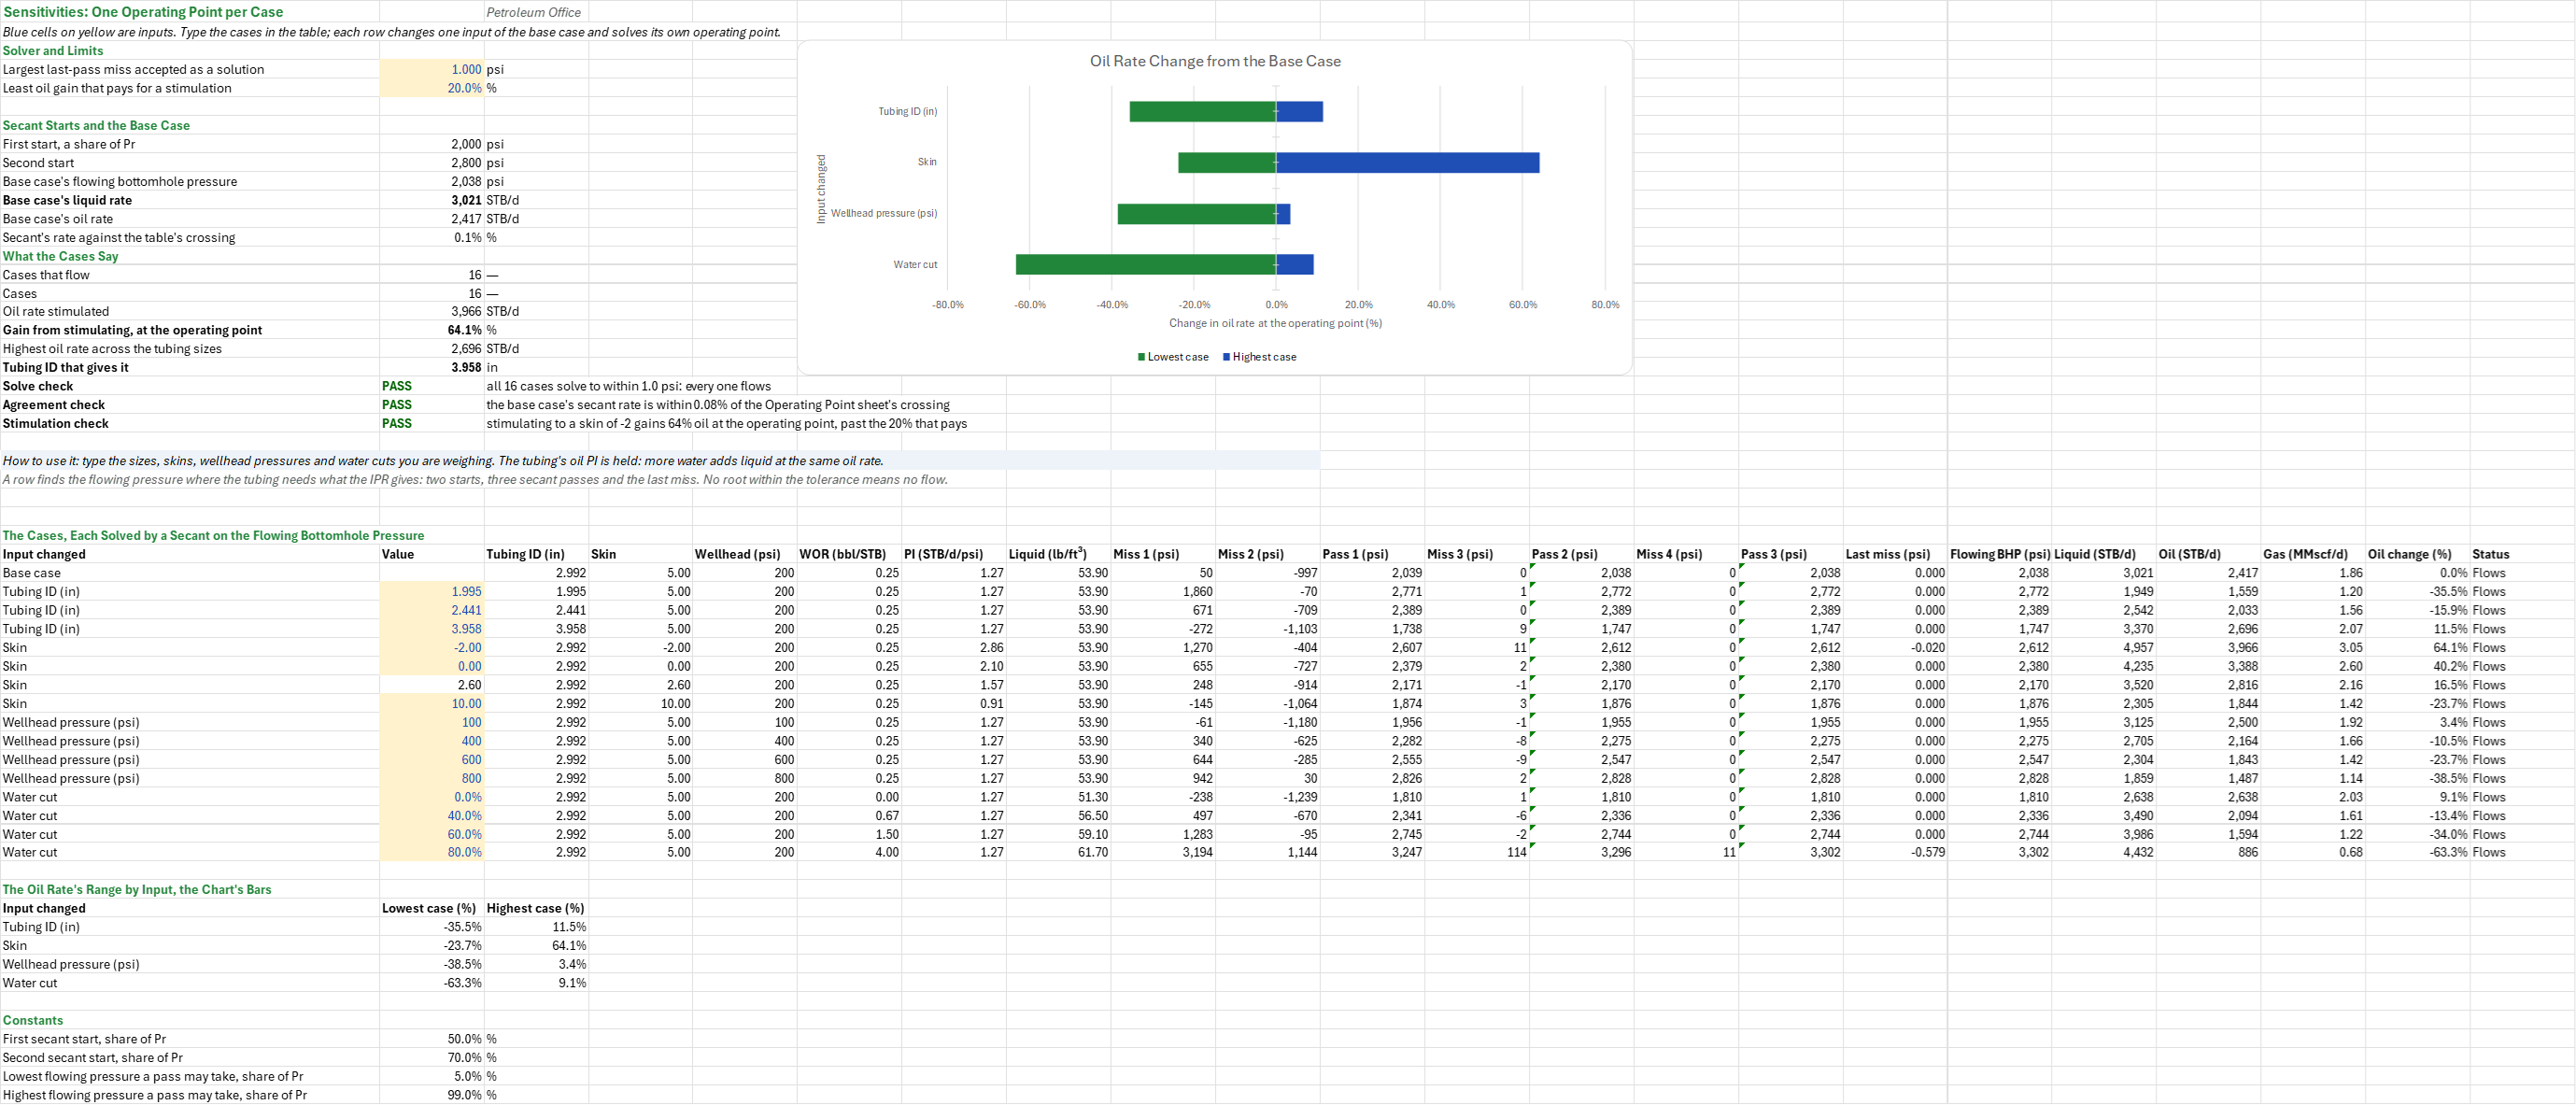
Method: J = k h / (141.2 Bo μo (ln(re/rw) - 0.75 + s)); the test's J = q / (Pr - Pwf) above Pb; q = J (Pr - Pwf) above Pb and J (Pr - Pb) + J Pb/1.8 (1 - 0.2 Pwf/Pb - 0.8 (Pwf/Pb)^2) below; the Hawkins skin is (k/ks - 1) ln(rs/rw). The tubing curve takes all the gas free at GOR/(1 + WOR) and the liquid's density blended by volume; the best match is the correlation with the least absolute relative error against the gauge; the trajectory's TVD is by average angle. The Operating Point sheet tabulates the IPR's liquid rate q (1 + WOR) at 17 pressures and Beggs-Brill at 12 rates, and takes the last crossing by linear interpolation. Each sensitivity row solves g(Pwf) = BeggsBrill(q(Pwf)) - Pwf = 0 by a secant on Pwf: it starts at 0.5 and 0.7 Pr, takes three passes held between 0.05 and 0.99 Pr, and no root within 1 psi means no flow. No circular reference.
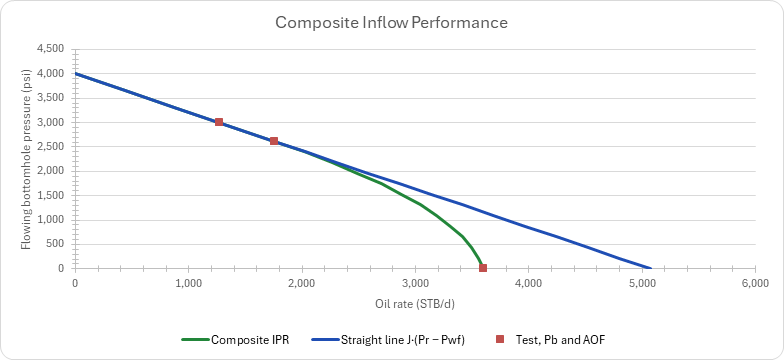
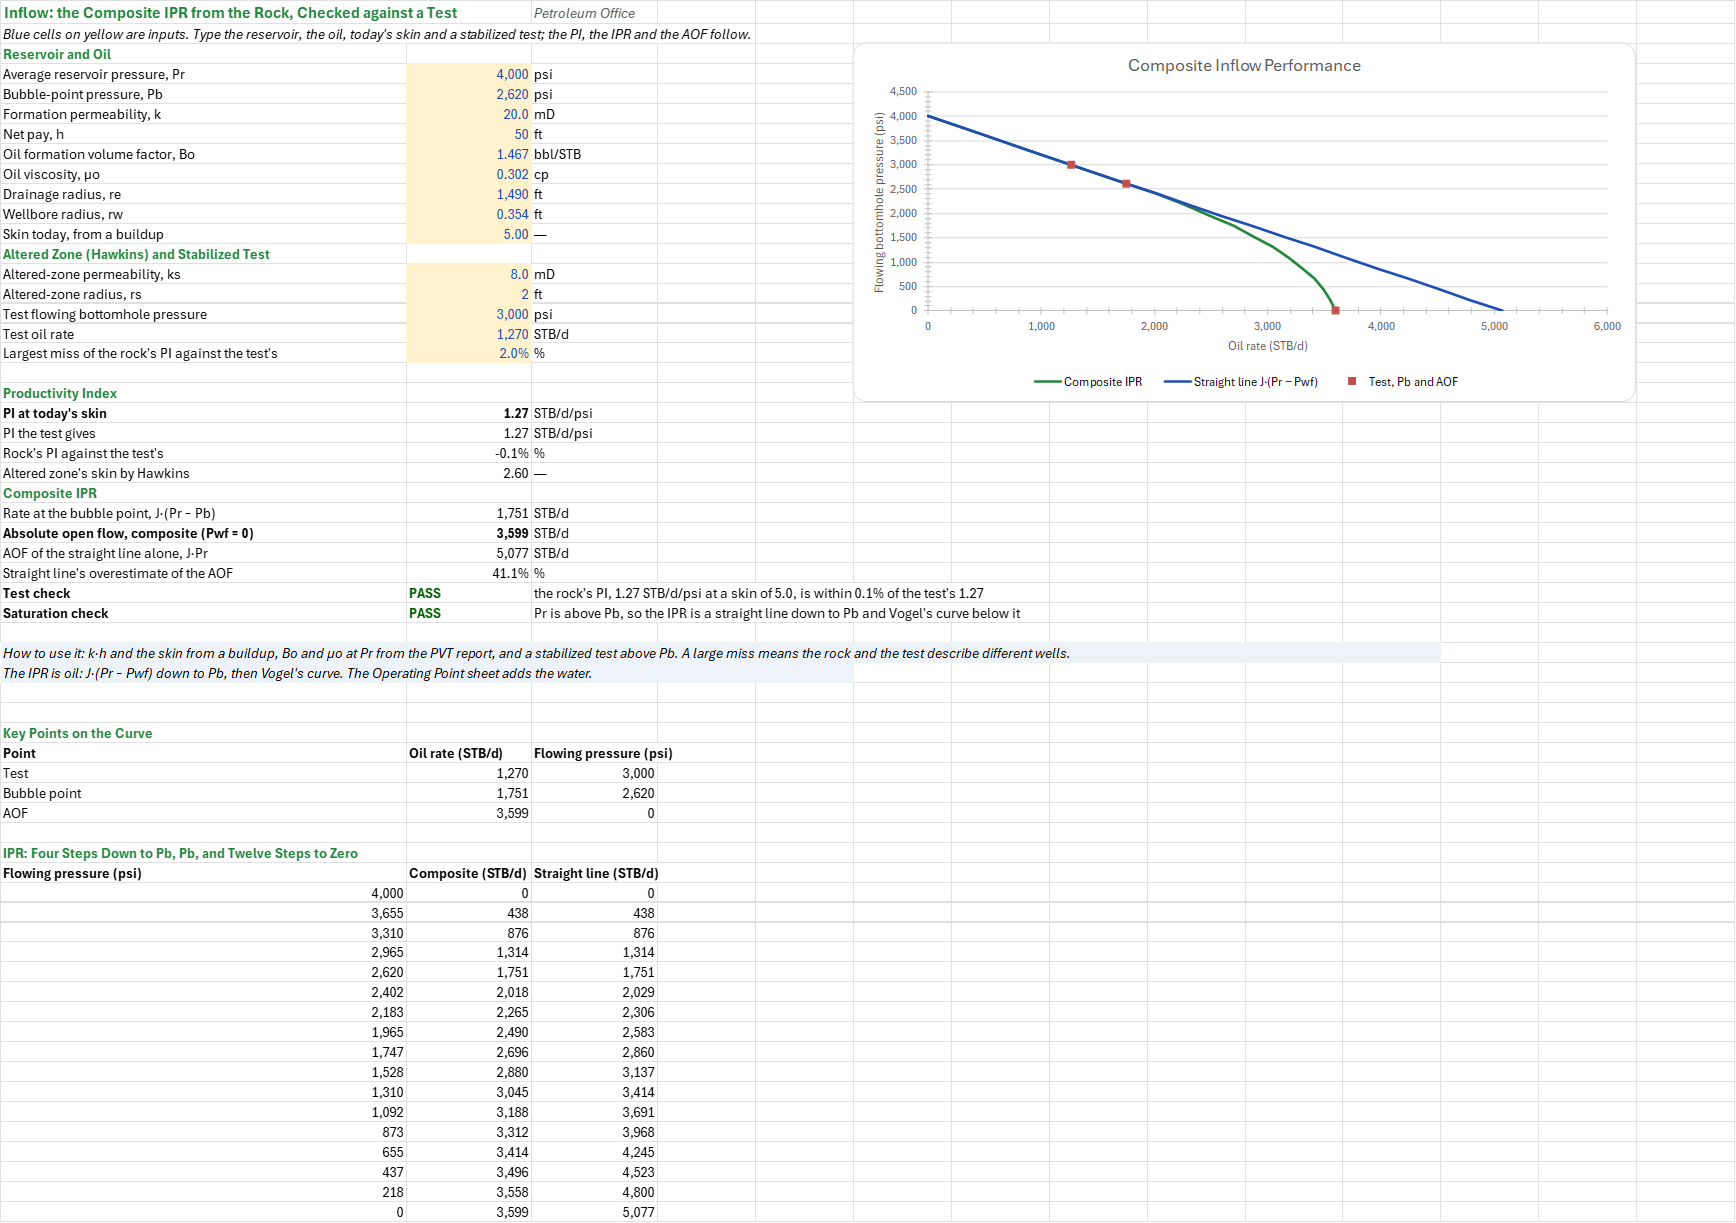
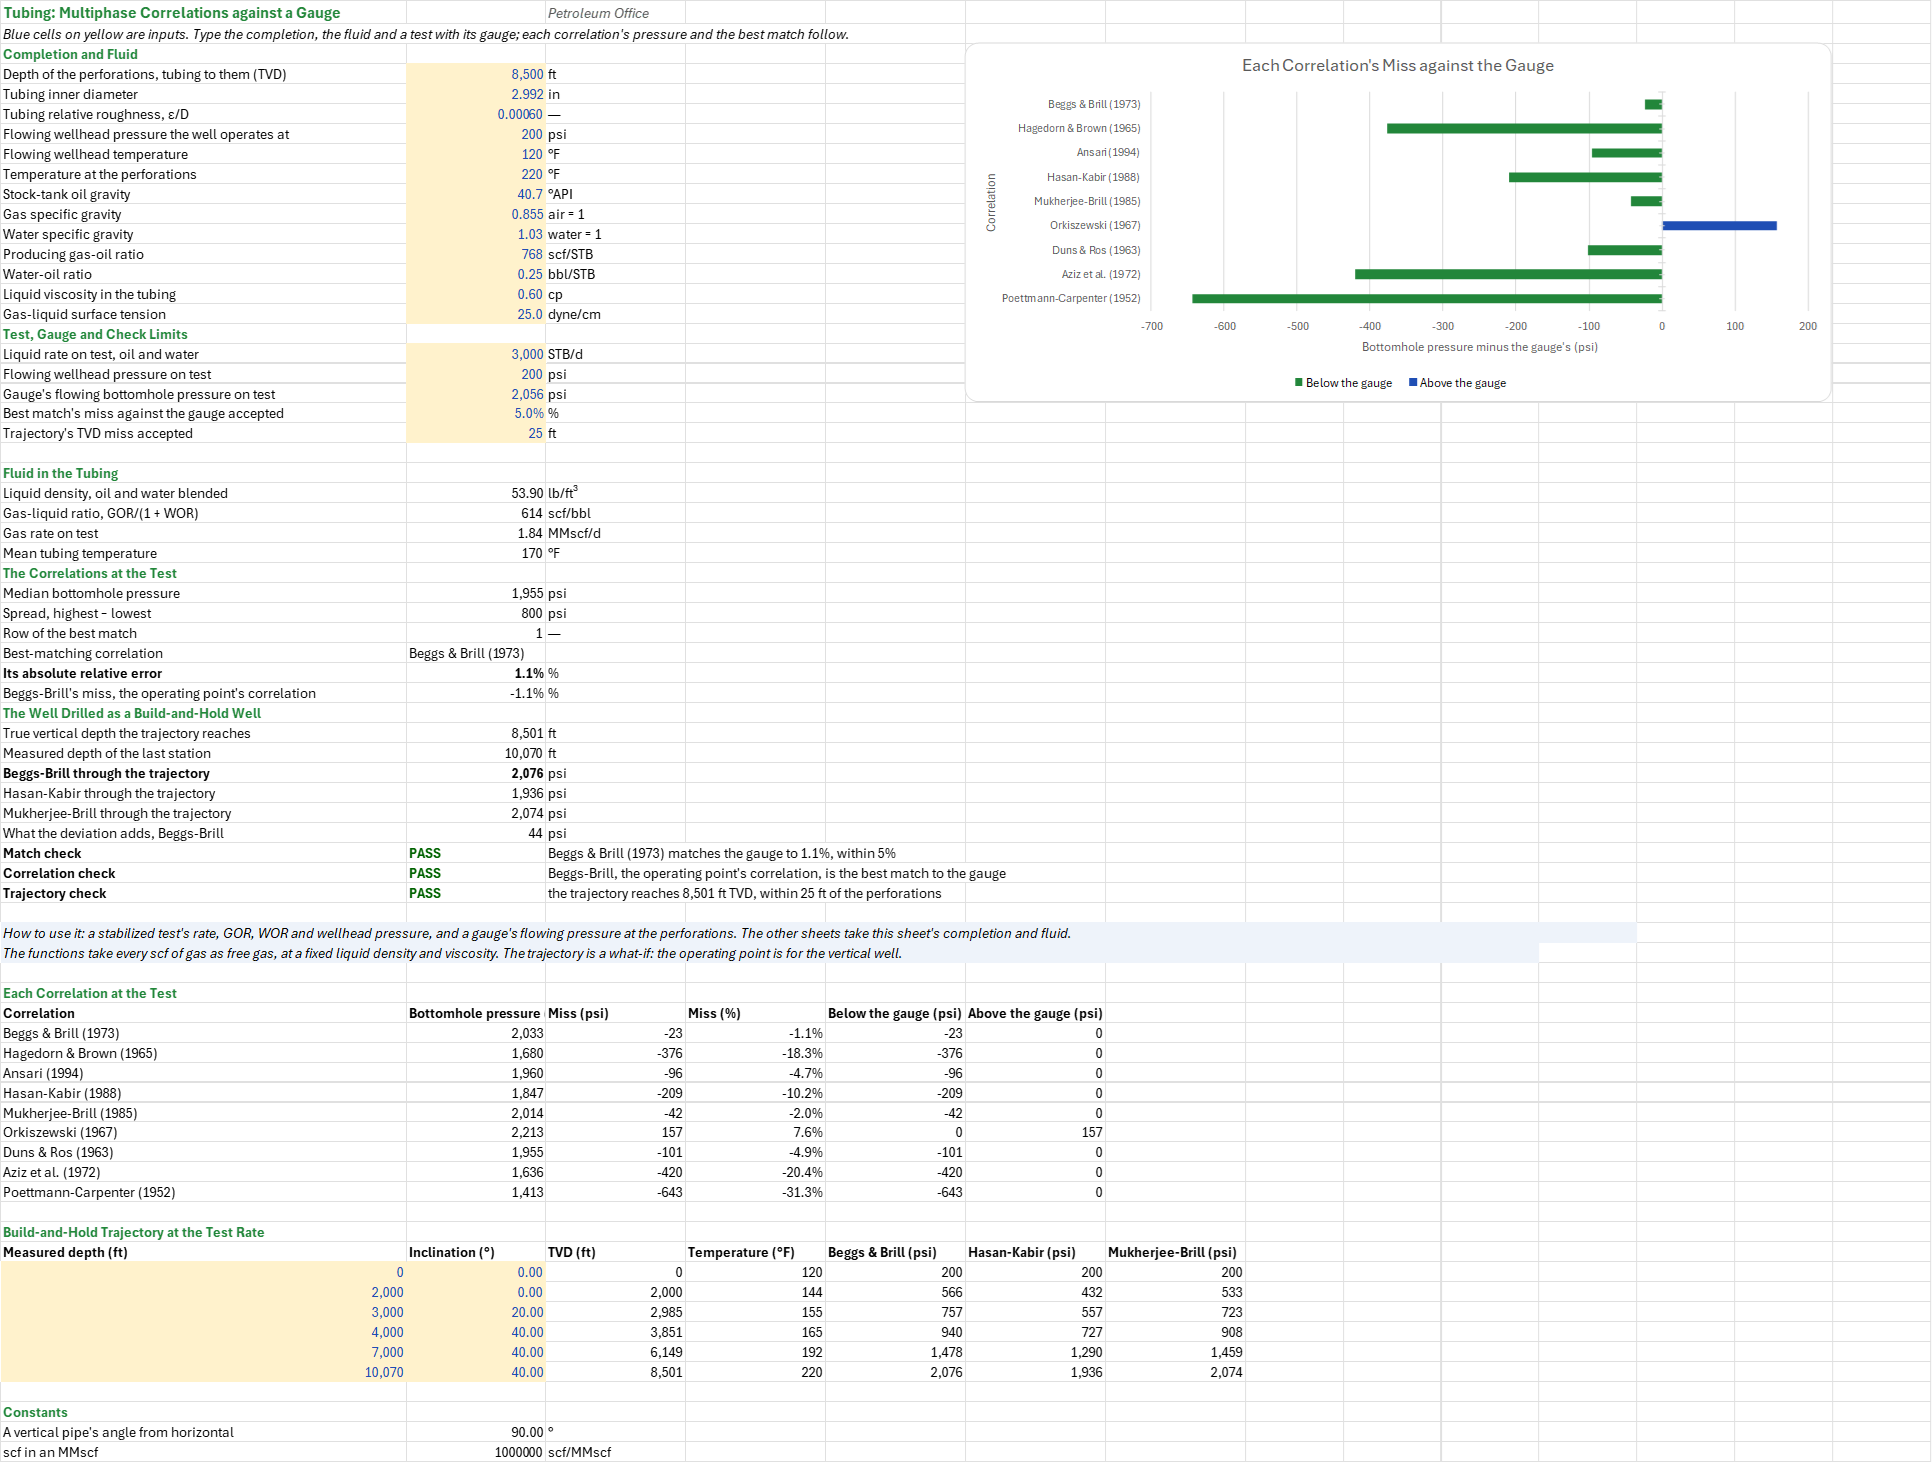
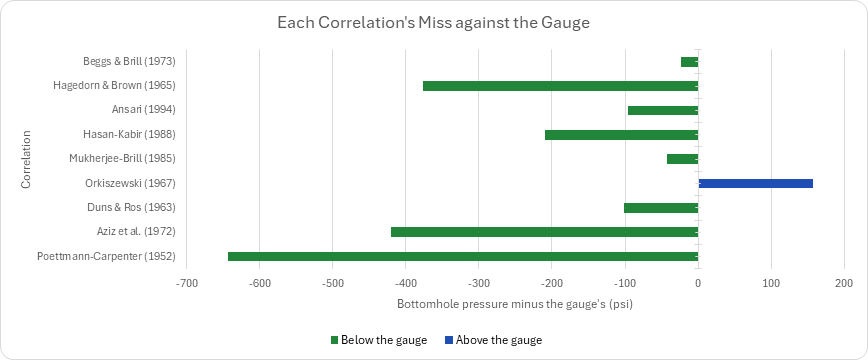
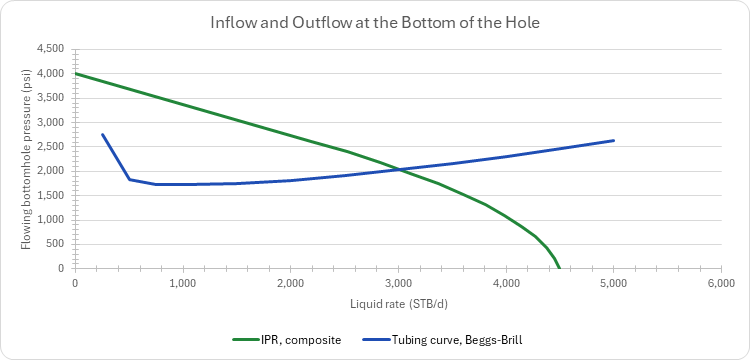
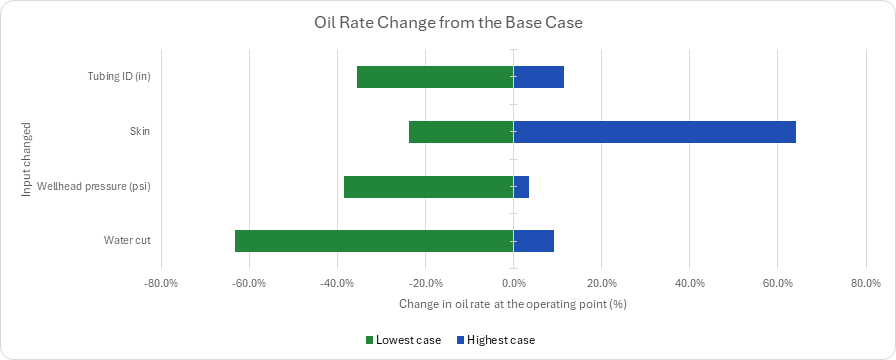
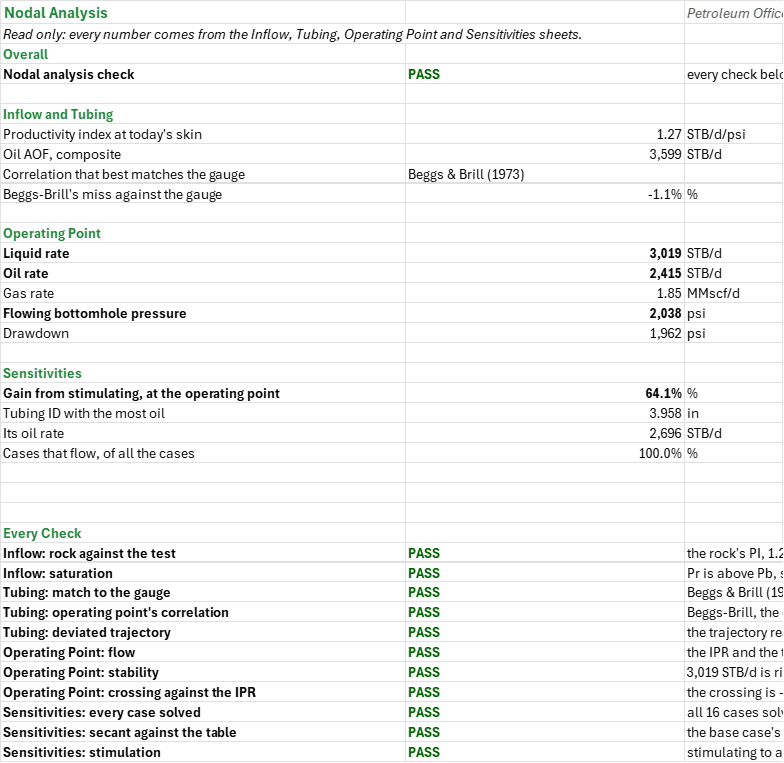
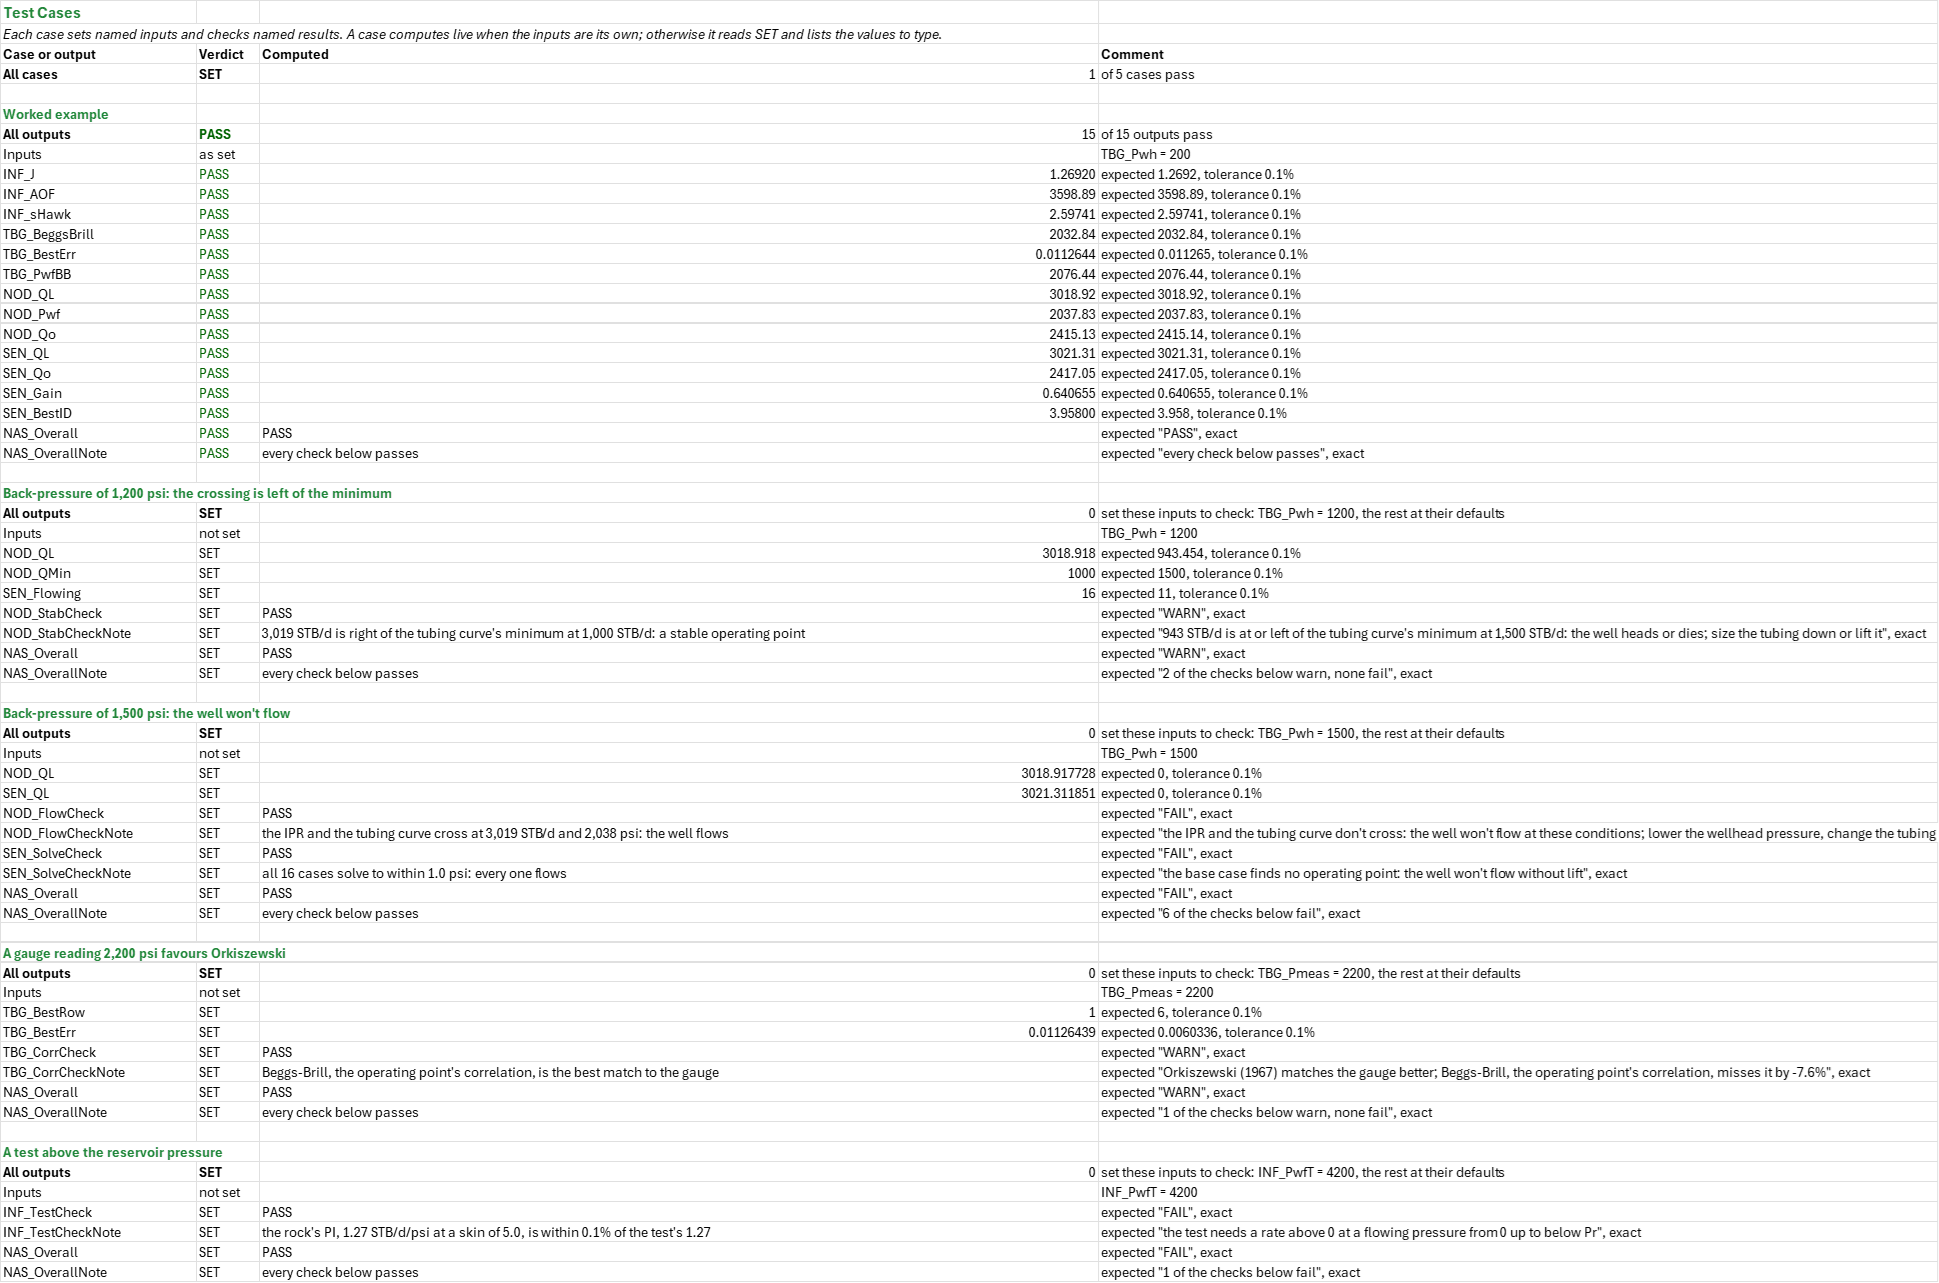
Example: The oil-inflow family's reference well (4,000 psi, Pb 2,620 psi, 20 mD over 50 ft, Bo 1.467, μo 0.302 cp, re 1,490 ft, rw 0.354 ft, skin 5) in 3-1/2-in tubing (2.992 in) to 8,500 ft, 40.7 API oil with 768 scf/STB of 0.855 gas and 0.25 bbl of 1.03 brine per STB, 200 psi at the wellhead. The rock gives J = 1.2692 STB/d/psi, 0.06 % from the test's 1.27 (1,270 STB/d at 3,000 psi); the AOF is 3,598.9 STB/d and the Hawkins skin 2.60. At the test (3,000 STB/d, gauge 2,056 psi) the correlations run 1,413 to 2,213 psi, median 1,955; Beggs-Brill, 2,032.8 psi, matches best at 1.1 %. Drilled as a 40 degree build-and-hold well it would need 2,076.4 psi, 43.6 psi more. The curves cross at 3,018.9 STB/d of liquid (2,415.1 STB/d of oil, 1.85 MMscf/d) and 2,037.8 psi, right of the tubing curve's 1,000 STB/d minimum; the secant puts the base case at 3,021.3 STB/d, 0.08 % away. Oil against the base case's 2,417.1 STB/d: 2-3/8-in -35.5 %, 2-7/8-in -15.9 %, 4-1/2-in +11.5 % (the most oil); skin -2 +64.1 %, 0 +40.2 %, 2.60 +16.5 %, 10 -23.7 %; 100 psi at the wellhead +3.4 %, 400 -10.5 %, 600 -23.7 %, 800 -38.5 %; water cut 0 +9.1 %, 40 % -13.4 %, 60 % -34.0 %, 80 % -63.3 %. At 1,200 psi at the wellhead the curves cross at 943 STB/d, left of the 1,500 STB/d minimum, so the well would head or die, and five cases don't flow; at 1,500 psi the well doesn't flow.
Validity
The IPR is pseudosteady state at today's Pr; the PI is oil, so more water adds liquid at the same oil PI, and the GOR is held. Below Pb a damaged well's flow efficiency would also bend the curve (Standing), which the composite leaves out. The tubing correlations take all the gas free at a fixed liquid density and viscosity, which overstates the gas low in the tubing; the gauge check says which correlation to trust. The operating point uses Beggs-Brill, the best match here; if another correlation matches the gauge better, re-run the operating point with it by hand. The table's crossing is linear between points (within 0.3 % of the secant's here); the secant needs a root between 0.05 and 0.99 Pr. Only the base case is checked for stability: a case left of its tubing curve's minimum would head or die. The trajectory is a what-if. A surface choke or flowline is represented by the wellhead pressure. Alternatives: Fetkovich or Klins-Clark IPRs for a depleted well, gas lift or a pump where the curves don't cross, the gas-well tubing-sizing sheet with Turner's loading rate.
References
- Brown, K.E. and Lea, J.F. (1985). Nodal Systems Analysis of Oil and Gas Wells. JPT 37(10), 1751-1763.
- Beggs, H.D. (2003). Production Optimization Using Nodal Analysis, 2nd ed. OGCI and Petroskills.
- Vogel, J.V. (1968). Inflow Performance Relationships for Solution-Gas Drive Wells. JPT 20(1), 83-92.
- Hawkins, M.F. Jr. (1956). A Note on the Skin Effect. Trans. AIME 207, 356-357.
- Beggs, H.D. and Brill, J.P. (1973). A Study of Two-Phase Flow in Inclined Pipes. JPT 25(5), 607-617.
- Economides, M.J., Hill, A.D., Ehlig-Economides, C. and Zhu, D. (2013). Petroleum Production Systems, 2nd ed. Prentice Hall, ch. 2, 7 and 10.
Inputs
| Input | Unit | Default | Name |
|---|---|---|---|
| Average reservoir pressure, Pr | psi | 4000 | INF_Pr |
| Bubble-point pressure, Pb | psi | 2620 | INF_Pb |
| Formation permeability, k | mD | 20 | INF_k |
| Net pay, h | ft | 50 | INF_h |
| Oil formation volume factor, Bo | bbl/STB | 1.467 | INF_Bo |
| Oil viscosity, μo | cp | 0.302 | INF_Uo |
| Drainage radius, re | ft | 1490 | INF_re |
| Wellbore radius, rw | ft | 0.354 | INF_rw |
| Skin today, from a buildup | — | 5 | INF_s |
| Altered-zone permeability, ks | mD | 8 | INF_ks |
| Altered-zone radius, rs | ft | 2 | INF_rs |
| Test flowing bottomhole pressure | psi | 3000 | INF_PwfT |
| Test oil rate | STB/d | 1270 | INF_qT |
| Largest miss of the rock's PI against the test's | fraction | 0.02 | INF_PiTol |
| Depth of the perforations, tubing to them (TVD) | ft | 8500 | TBG_TVD |
| Tubing inner diameter | in | 2.992 | TBG_ID |
| Tubing relative roughness, ε/D | — | 0.0006 | TBG_Rough |
| Flowing wellhead pressure the well operates at | psi | 200 | TBG_Pwh |
| Flowing wellhead temperature | F | 120 | TBG_Twh |
| Temperature at the perforations | F | 220 | TBG_Tbh |
| Stock-tank oil gravity | API | 40.7 | TBG_API |
| Gas specific gravity | — | 0.855 | TBG_SGg |
| Water specific gravity | — | 1.03 | TBG_SGw |
| Producing gas-oil ratio | scf/STB | 768 | TBG_GOR |
| Water-oil ratio | bbl/STB | 0.25 | TBG_WOR |
| Liquid viscosity in the tubing | cp | 0.6 | TBG_UL |
| Gas-liquid surface tension | dyne/cm | 25 | TBG_IFT |
| Liquid rate on test, oil and water | STB/d | 3000 | TBG_QL |
| Flowing wellhead pressure on test | psi | 200 | TBG_PwhT |
| Gauge's flowing bottomhole pressure on test | psi | 2056 | TBG_Pmeas |
| Best match's miss against the gauge accepted | fraction | 0.05 | TBG_MatchTol |
| Trajectory's TVD miss accepted | ft | 25 | TBG_TvdTol |
| Largest miss of the crossing against the IPR | fraction | 0.01 | NOD_IprTol |
| Largest last-pass miss accepted as a solution | psi | 1 | SEN_Tol |
| Least oil gain that pays for a stimulation | fraction | 0.2 | SEN_GainMin |
| Survey stations, MD and inclination | ft, degrees | 6 stations | TBG_Trajectory |
| Sensitivity cases, each case's changed value | — | 15 cases | SEN_Cases |
Sheets
Guide— what the workbook answers and the order to work through its sheets.Inflow— the pseudosteady-state PI at today's skin from k, h, Bo, μo, re and rw, checked against the PI a stabilized test gives; the composite IPR (straight line to Pb, Vogel below), its AOF and the altered zone's Hawkins skin.Tubing— the nine oil-well correlations at a test rate against a gauge, the best match, and the same well drilled as a build-and-hold well, marched station by station.Operating Point— the IPR in liquid terms against the Beggs-Brill tubing curve, the crossing, and the flow, stability and IPR checks, with an IPR/VLP chart.Sensitivities— fifteen cases on tubing size, skin, wellhead pressure and water cut, each solving its own operating point, and a tornado of the oil rate's change.Summary— the answers and every check under one verdict.Test Cases— the worked example and other cases, with expected and computed results.
Four charts: the composite IPR with the test, Pb and AOF; each correlation's miss against the gauge; the IPR and Beggs-Brill tubing curve; the oil rate's change by input.
Functions used
Names (158)
| Name | Refers to | Comment |
|---|---|---|
PO.CO.Damage.HawkinsLAMBDA |
=LAMBDA(k, k_s, r_s, r_w, IF((k<=0)+(k_s<=0)+(r_w<=0)+(r_s<r_w), NA(), (k/k_s-1)*LN(r_s/r_w))) |
Hawkins (1956) skin of an altered zone round the wellbore: (k/k_s - 1)*ln(r_s/r_w). k formation and k_s altered-zone permeability (mD), r_s altered-zone and r_w wellbore radius (ft). Positive when damaged, negative when stimulated. |
PO.VFP.Corr.MatchLAMBDA |
=LAMBDA(predicted, measured, row, LET(n, ROWS(predicted), m, COLUMNS(predicted), i, INT(row), ones, SEQUENCE(m, 1, 1, 0), num, --ISNUMBER(predicted), err, IFERROR(ABS(predicted-measured)/measured, 0), full, IF(m=1, num, MMULT(num, ones))=m, aare, IF(m=1, err, MMULT(err, ones))/m, k, COUNT(measured), valid, AND(IFERROR(ROWS(measured), 1)=1, OR(k=1, k=m), IFERROR(COLUMNS(measured), 1)=k, MIN(measured)>0), IF(OR(NOT(valid), i<0, i>n, row<>i), NA(), IF(i=0, MATCH(1, full*(aare=MIN(FILTER(aare, full, NA()))), 0), IF(SUM((SEQUENCE(n)=i)*full)=1, SUM((SEQUENCE(n)=i)*aare), NA()))))) |
Scores flow correlations against measured pressures: predicted has one row per correlation, measured one value or a row of m survey values. row = i gives row i's average absolute relative error (AARE); row = 0 the row with the least. |
INF_AOF |
Inflow!$B$27 |
Absolute open flow, composite (Pwf = 0), STB/d |
INF_AOFLine |
Inflow!$B$28 |
AOF of the straight line alone, J·Pr, STB/d |
INF_Bo |
Inflow!$B$8 |
Oil formation volume factor, Bo, bbl/STB |
INF_Curve |
Inflow!$A$45:$C$61 |
The flowing pressure from Pr to zero with a row at Pb, the composite oil rate and the straight line's |
INF_Inputs |
Inflow!$B$4:$B$18 |
The reservoir pressure, bubble point, rock, oil, radii and today's skin, the altered zone, the stabilized test and the PI check's limit |
INF_J |
Inflow!$B$21 |
PI at today's skin, STB/d/psi |
INF_JTest |
Inflow!$B$22 |
PI the test gives, STB/d/psi |
INF_Over |
Inflow!$B$29 |
Straight line's overestimate of the AOF, % |
INF_Pb |
Inflow!$B$5 |
Bubble-point pressure, Pb, psi |
INF_PiErr |
Inflow!$B$23 |
Rock's PI against the test's, % |
INF_PiTol |
Inflow!$B$18 |
Largest miss of the rock's PI against the test's, % |
INF_Points |
Inflow!$A$39:$C$41 |
The test, the bubble point and the AOF as rate and flowing pressure, the chart's markers |
INF_Pr |
Inflow!$B$4 |
Average reservoir pressure, Pr, psi |
INF_PwfT |
Inflow!$B$16 |
Test flowing bottomhole pressure, psi |
INF_Results |
Inflow!$B$21:$B$31 |
The PI at today's skin and the test's, their miss, the Hawkins skin, the rate at Pb, the composite and straight-line AOF, and the two checks |
INF_SatCheck |
Inflow!$B$31 |
Saturation check verdict |
INF_SatCheckNote |
Inflow!$C$31 |
Saturation check comment |
INF_TestCheck |
Inflow!$B$30 |
Test check verdict |
INF_TestCheckNote |
Inflow!$C$30 |
Test check comment |
INF_Uo |
Inflow!$B$9 |
Oil viscosity, μo, cp |
INF_h |
Inflow!$B$7 |
Net pay, h, ft |
INF_k |
Inflow!$B$6 |
Formation permeability, k, mD |
INF_ks |
Inflow!$B$14 |
Altered-zone permeability, ks, mD |
INF_qT |
Inflow!$B$17 |
Test oil rate, STB/d |
INF_qb |
Inflow!$B$26 |
Rate at the bubble point, J·(Pr − Pb), STB/d |
INF_re |
Inflow!$B$10 |
Drainage radius, re, ft |
INF_rs |
Inflow!$B$15 |
Altered-zone radius, rs, ft |
INF_rw |
Inflow!$B$11 |
Wellbore radius, rw, ft |
INF_s |
Inflow!$B$12 |
Skin today, from a buildup |
INF_sHawk |
Inflow!$B$24 |
Altered zone's skin by Hawkins |
NAS_AOF |
Summary!$B$8 |
Oil AOF, composite, STB/d |
NAS_BBErr |
Summary!$B$10 |
Beggs-Brill's miss against the gauge, % |
NAS_Best |
Summary!$B$9 |
Correlation that best matches the gauge |
NAS_BestID |
Summary!$B$21 |
Tubing ID with the most oil, in |
NAS_Checks |
Summary!$B$28:$B$38 |
Every check of the workbook, read from its sheet |
NAS_DD |
Summary!$B$17 |
Drawdown, psi |
NAS_FlowShare |
Summary!$B$23 |
Cases that flow, of all the cases, % |
NAS_Gain |
Summary!$B$20 |
Gain from stimulating, at the operating point, % |
NAS_J |
Summary!$B$7 |
Productivity index at today's skin, STB/d/psi |
NAS_Operating_Results |
Summary!$B$13:$B$17 |
The operating liquid, oil and gas rates, the flowing pressure and the drawdown |
NAS_Overall |
Summary!$B$4 |
Nodal analysis check verdict |
NAS_OverallNote |
Summary!$C$4 |
Nodal analysis check comment |
NAS_Pwf |
Summary!$B$16 |
Flowing bottomhole pressure, psi |
NAS_QL |
Summary!$B$13 |
Liquid rate, STB/d |
NAS_Qg |
Summary!$B$15 |
Gas rate, MMscf/d |
NAS_Qo |
Summary!$B$14 |
Oil rate, STB/d |
NAS_QoTub |
Summary!$B$22 |
Its oil rate, STB/d |
NAS_Sensitivity_Results |
Summary!$B$20:$B$23 |
The stimulation gain, the best tubing and its oil rate, and the share of the cases that flow |
NAS_Verdict |
Summary!$B$4 |
One verdict over every check of the workbook |
NAS_VerdictNote |
Summary!$C$4 |
One verdict over every check of the workbook comment |
NAS_Well_Results |
Summary!$B$7:$B$10 |
The PI, the AOF, the best-matching correlation and Beggs-Brill's miss |
NOD_AOFL |
'Operating Point'!$B$8 |
Liquid AOF, the oil AOF with the water, STB/d |
NOD_DD |
'Operating Point'!$B$14 |
Drawdown, Pr − Pwf, psi |
NOD_FlowCheck |
'Operating Point'!$B$19 |
Flow check verdict |
NOD_FlowCheckNote |
'Operating Point'!$C$19 |
Flow check comment |
NOD_Inputs |
'Operating Point'!$B$4 |
The IPR check's limit |
NOD_Ipr |
'Operating Point'!$A$29:$C$45 |
Flowing bottomhole pressures from Pr to zero, four steps to the bubble point and twelve below it, the composite IPR's oil rate at each, and the liquid rate with the water |
NOD_IprCheck |
'Operating Point'!$B$21 |
IPR check verdict |
NOD_IprCheckNote |
'Operating Point'!$C$21 |
IPR check comment |
NOD_IprErr |
'Operating Point'!$B$16 |
Crossing's rate against the IPR's, % |
NOD_IprTol |
'Operating Point'!$B$4 |
Largest miss of the crossing against the IPR, % |
NOD_J |
'Operating Point'!$B$7 |
Productivity index above the bubble point, STB/d/psi |
NOD_PMin |
'Operating Point'!$B$18 |
Bottomhole pressure at the minimum, psi |
NOD_Pwf |
'Operating Point'!$B$11 |
Flowing bottomhole pressure there, psi |
NOD_QIpr |
'Operating Point'!$B$15 |
The IPR's liquid rate at that pressure, STB/d |
NOD_QL |
'Operating Point'!$B$10 |
Liquid rate where the curves cross, STB/d |
NOD_QMin |
'Operating Point'!$B$17 |
Rate at the tubing curve's minimum, STB/d |
NOD_Qg |
'Operating Point'!$B$13 |
Gas rate there, MMscf/d |
NOD_Qo |
'Operating Point'!$B$12 |
Oil rate there, STB/d |
NOD_Results |
'Operating Point'!$B$7:$B$21 |
The PI and the liquid AOF, the operating rate and pressure where the curves cross, the oil and gas rates and drawdown there, the IPR's rate at that pressure, the tubing curve's minimum, and the three checks |
NOD_StabCheck |
'Operating Point'!$B$20 |
Stability check verdict |
NOD_StabCheckNote |
'Operating Point'!$C$20 |
Stability check comment |
NOD_Vlp |
'Operating Point'!$A$49:$C$60 |
Liquid rates from 250 to 5,000 STB/d, the gas rate at the GLR, and the Beggs-Brill bottomhole pressure each needs |
SEN_AgreeCheck |
Sensitivities!$B$22 |
Agreement check verdict |
SEN_AgreeCheckNote |
Sensitivities!$C$22 |
Agreement check comment |
SEN_AgreeErr |
Sensitivities!$B$13 |
Secant's rate against the table's crossing, % |
SEN_BestID |
Sensitivities!$B$20 |
Tubing ID that gives it, in |
SEN_Cases |
Sensitivities!$A$31:$V$46 |
The base case and each case's changed input, its tubing, skin, wellhead pressure, WOR, PI and liquid density, the secant's misses and passes, and the operating pressure, rates, oil change and status |
SEN_Count |
Sensitivities!$B$16 |
Cases |
SEN_Fa |
Sensitivities!$B$56 |
First secant start, share of Pr, % |
SEN_Fb |
Sensitivities!$B$57 |
Second secant start, share of Pr, % |
SEN_Flowing |
Sensitivities!$B$15 |
Cases that flow |
SEN_Fmax |
Sensitivities!$B$59 |
Highest flowing pressure a pass may take, share of Pr, % |
SEN_Fmin |
Sensitivities!$B$58 |
Lowest flowing pressure a pass may take, share of Pr, % |
SEN_Gain |
Sensitivities!$B$18 |
Gain from stimulating, at the operating point, % |
SEN_GainMin |
Sensitivities!$B$5 |
Least oil gain that pays for a stimulation, % |
SEN_Inputs |
Sensitivities!$B$4:$B$5 |
The solver's tolerance and the least gain that pays for a stimulation; the cases are the table below |
SEN_Pwf |
Sensitivities!$B$10 |
Base case's flowing bottomhole pressure, psi |
SEN_QL |
Sensitivities!$B$11 |
Base case's liquid rate, STB/d |
SEN_Qo |
Sensitivities!$B$12 |
Base case's oil rate, STB/d |
SEN_QoStim |
Sensitivities!$B$17 |
Oil rate stimulated, STB/d |
SEN_QoTub |
Sensitivities!$B$19 |
Highest oil rate across the tubing sizes, STB/d |
SEN_Results |
Sensitivities!$B$8:$B$23 |
The secant's starts, the base case's pressure and rates, its agreement with the table's crossing, the cases that flow, the stimulation gain, the best tubing, and the three checks |
SEN_SolveCheck |
Sensitivities!$B$21 |
Solve check verdict |
SEN_SolveCheckNote |
Sensitivities!$C$21 |
Solve check comment |
SEN_StimCheck |
Sensitivities!$B$23 |
Stimulation check verdict |
SEN_StimCheckNote |
Sensitivities!$C$23 |
Stimulation check comment |
SEN_Tol |
Sensitivities!$B$4 |
Largest last-pass miss accepted as a solution, psi |
SEN_Tornado |
Sensitivities!$A$50:$C$53 |
For each input, the lowest and highest change in the oil rate across its cases, the base case's zero included |
SEN_X0 |
Sensitivities!$B$8 |
First start, a share of Pr, psi |
SEN_X1 |
Sensitivities!$B$9 |
Second start, psi |
TBG_API |
Tubing!$B$10 |
Stock-tank oil gravity, °API |
TBG_Ansari |
Tubing!$B$54 |
Ansari (1994) bottomhole pressure at the test, psi |
TBG_Aziz |
Tubing!$B$59 |
Aziz et al. (1972) bottomhole pressure at the test, psi |
TBG_BBErr |
Tubing!$B$35 |
Beggs-Brill's miss, the operating point's correlation, % |
TBG_BeggsBrill |
Tubing!$B$52 |
Beggs & Brill (1973) bottomhole pressure at the test, psi |
TBG_Best |
Tubing!$B$33 |
Best-matching correlation |
TBG_BestErr |
Tubing!$B$34 |
Its absolute relative error, % |
TBG_BestRow |
Tubing!$B$32 |
Row of the best match |
TBG_Compare |
Tubing!$A$52:$F$60 |
Each correlation's bottomhole pressure at the test, its miss against the gauge, and the misses split for the chart |
TBG_CorrCheck |
Tubing!$B$44 |
Correlation check verdict |
TBG_CorrCheckNote |
Tubing!$C$44 |
Correlation check comment |
TBG_DunsRos |
Tubing!$B$58 |
Duns & Ros (1963) bottomhole pressure at the test, psi |
TBG_GLR |
Tubing!$B$26 |
Gas-liquid ratio, GOR/(1 + WOR), scf/bbl |
TBG_GOR |
Tubing!$B$13 |
Producing gas-oil ratio, scf/STB |
TBG_HagedornBrown |
Tubing!$B$53 |
Hagedorn & Brown (1965) bottomhole pressure at the test, psi |
TBG_HasanKabir |
Tubing!$B$55 |
Hasan-Kabir (1988) bottomhole pressure at the test, psi |
TBG_ID |
Tubing!$B$5 |
Tubing inner diameter, in |
TBG_IFT |
Tubing!$B$16 |
Gas-liquid surface tension, dyne/cm |
TBG_Inputs |
Tubing!$B$4:$B$22 |
The tubing, the operating wellhead pressure, temperatures and fluid, the test's rate, wellhead and gauge pressures, and the match and trajectory limits; the trajectory is the table below |
TBG_MD |
Tubing!$B$38 |
Measured depth of the last station, ft |
TBG_MatchCheck |
Tubing!$B$43 |
Match check verdict |
TBG_MatchCheckNote |
Tubing!$C$43 |
Match check comment |
TBG_MatchTol |
Tubing!$B$21 |
Best match's miss against the gauge accepted, % |
TBG_Median |
Tubing!$B$30 |
Median bottomhole pressure, psi |
TBG_MukherjeeBrill |
Tubing!$B$56 |
Mukherjee-Brill (1985) bottomhole pressure at the test, psi |
TBG_Orkiszewski |
Tubing!$B$57 |
Orkiszewski (1967) bottomhole pressure at the test, psi |
TBG_Pmeas |
Tubing!$B$20 |
Gauge's flowing bottomhole pressure on test, psi |
TBG_PoettmannCarpenter |
Tubing!$B$60 |
Poettmann-Carpenter (1952) bottomhole pressure at the test, psi |
TBG_PwfBB |
Tubing!$B$39 |
Beggs-Brill through the trajectory, psi |
TBG_PwfHK |
Tubing!$B$40 |
Hasan-Kabir through the trajectory, psi |
TBG_PwfMB |
Tubing!$B$41 |
Mukherjee-Brill through the trajectory, psi |
TBG_Pwh |
Tubing!$B$7 |
Flowing wellhead pressure, psi |
TBG_PwhT |
Tubing!$B$19 |
Flowing wellhead pressure on test, psi |
TBG_QL |
Tubing!$B$18 |
Liquid rate on test, oil and water, STB/d |
TBG_Qg |
Tubing!$B$27 |
Gas rate on test, MMscf/d |
TBG_Results |
Tubing!$B$25:$B$45 |
The liquid density, GLR, gas rate and mean temperature, the correlations' median and spread, the best match and its error, Beggs-Brill's miss, the deviated well's pressures, and the three checks |
TBG_RhoL |
Tubing!$B$25 |
Liquid density, oil and water blended, lb/ft³ |
TBG_Rough |
Tubing!$B$6 |
Tubing relative roughness, ε/D |
TBG_SGg |
Tubing!$B$11 |
Gas specific gravity, air = 1 |
TBG_SGw |
Tubing!$B$12 |
Water specific gravity, water = 1 |
TBG_Scf |
Tubing!$B$73 |
scf in an MMscf, scf/MMscf |
TBG_Spread |
Tubing!$B$31 |
Spread, highest − lowest, psi |
TBG_TVD |
Tubing!$B$4 |
Depth of the perforations, tubing to them (TVD), ft |
TBG_TVDTraj |
Tubing!$B$37 |
True vertical depth the trajectory reaches, ft |
TBG_Tbh |
Tubing!$B$9 |
Temperature at the perforations, °F |
TBG_Tm |
Tubing!$B$28 |
Mean tubing temperature, °F |
TBG_TrajCheck |
Tubing!$B$45 |
Trajectory check verdict |
TBG_TrajCheckNote |
Tubing!$C$45 |
Trajectory check comment |
TBG_Trajectory |
Tubing!$A$64:$G$69 |
The survey's stations, measured depth and inclination, the TVD and temperature at each, and the flowing pressure there by each inclined-pipe correlation |
TBG_TvdTol |
Tubing!$B$22 |
Trajectory's TVD miss accepted, ft |
TBG_Twh |
Tubing!$B$8 |
Flowing wellhead temperature, °F |
TBG_UL |
Tubing!$B$15 |
Liquid viscosity in the tubing, cp |
TBG_Vert |
Tubing!$B$72 |
A vertical pipe's angle from horizontal, ° |
TBG_WOR |
Tubing!$B$14 |
Water-oil ratio, bbl/STB |
TBG_dPDev |
Tubing!$B$42 |
What the deviation adds, Beggs-Brill, psi |
Details
| Opens in | Needs the Petroleum Office add-in: its PO functions show #NAME? without it once Excel recalculates. Needs Microsoft 365 or Excel 2024: it uses functions Excel 2016 doesn't have, such as named LAMBDAs, which show #NAME? there. |
| File | NodalAnalysis.xlsx, 76 KB |
| Category | Production |
| For agents and tools | Descriptor (.md) |