Type Well Builder
Description
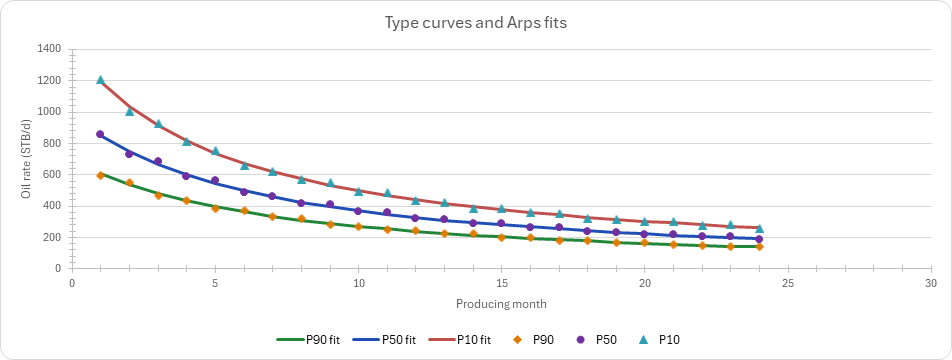
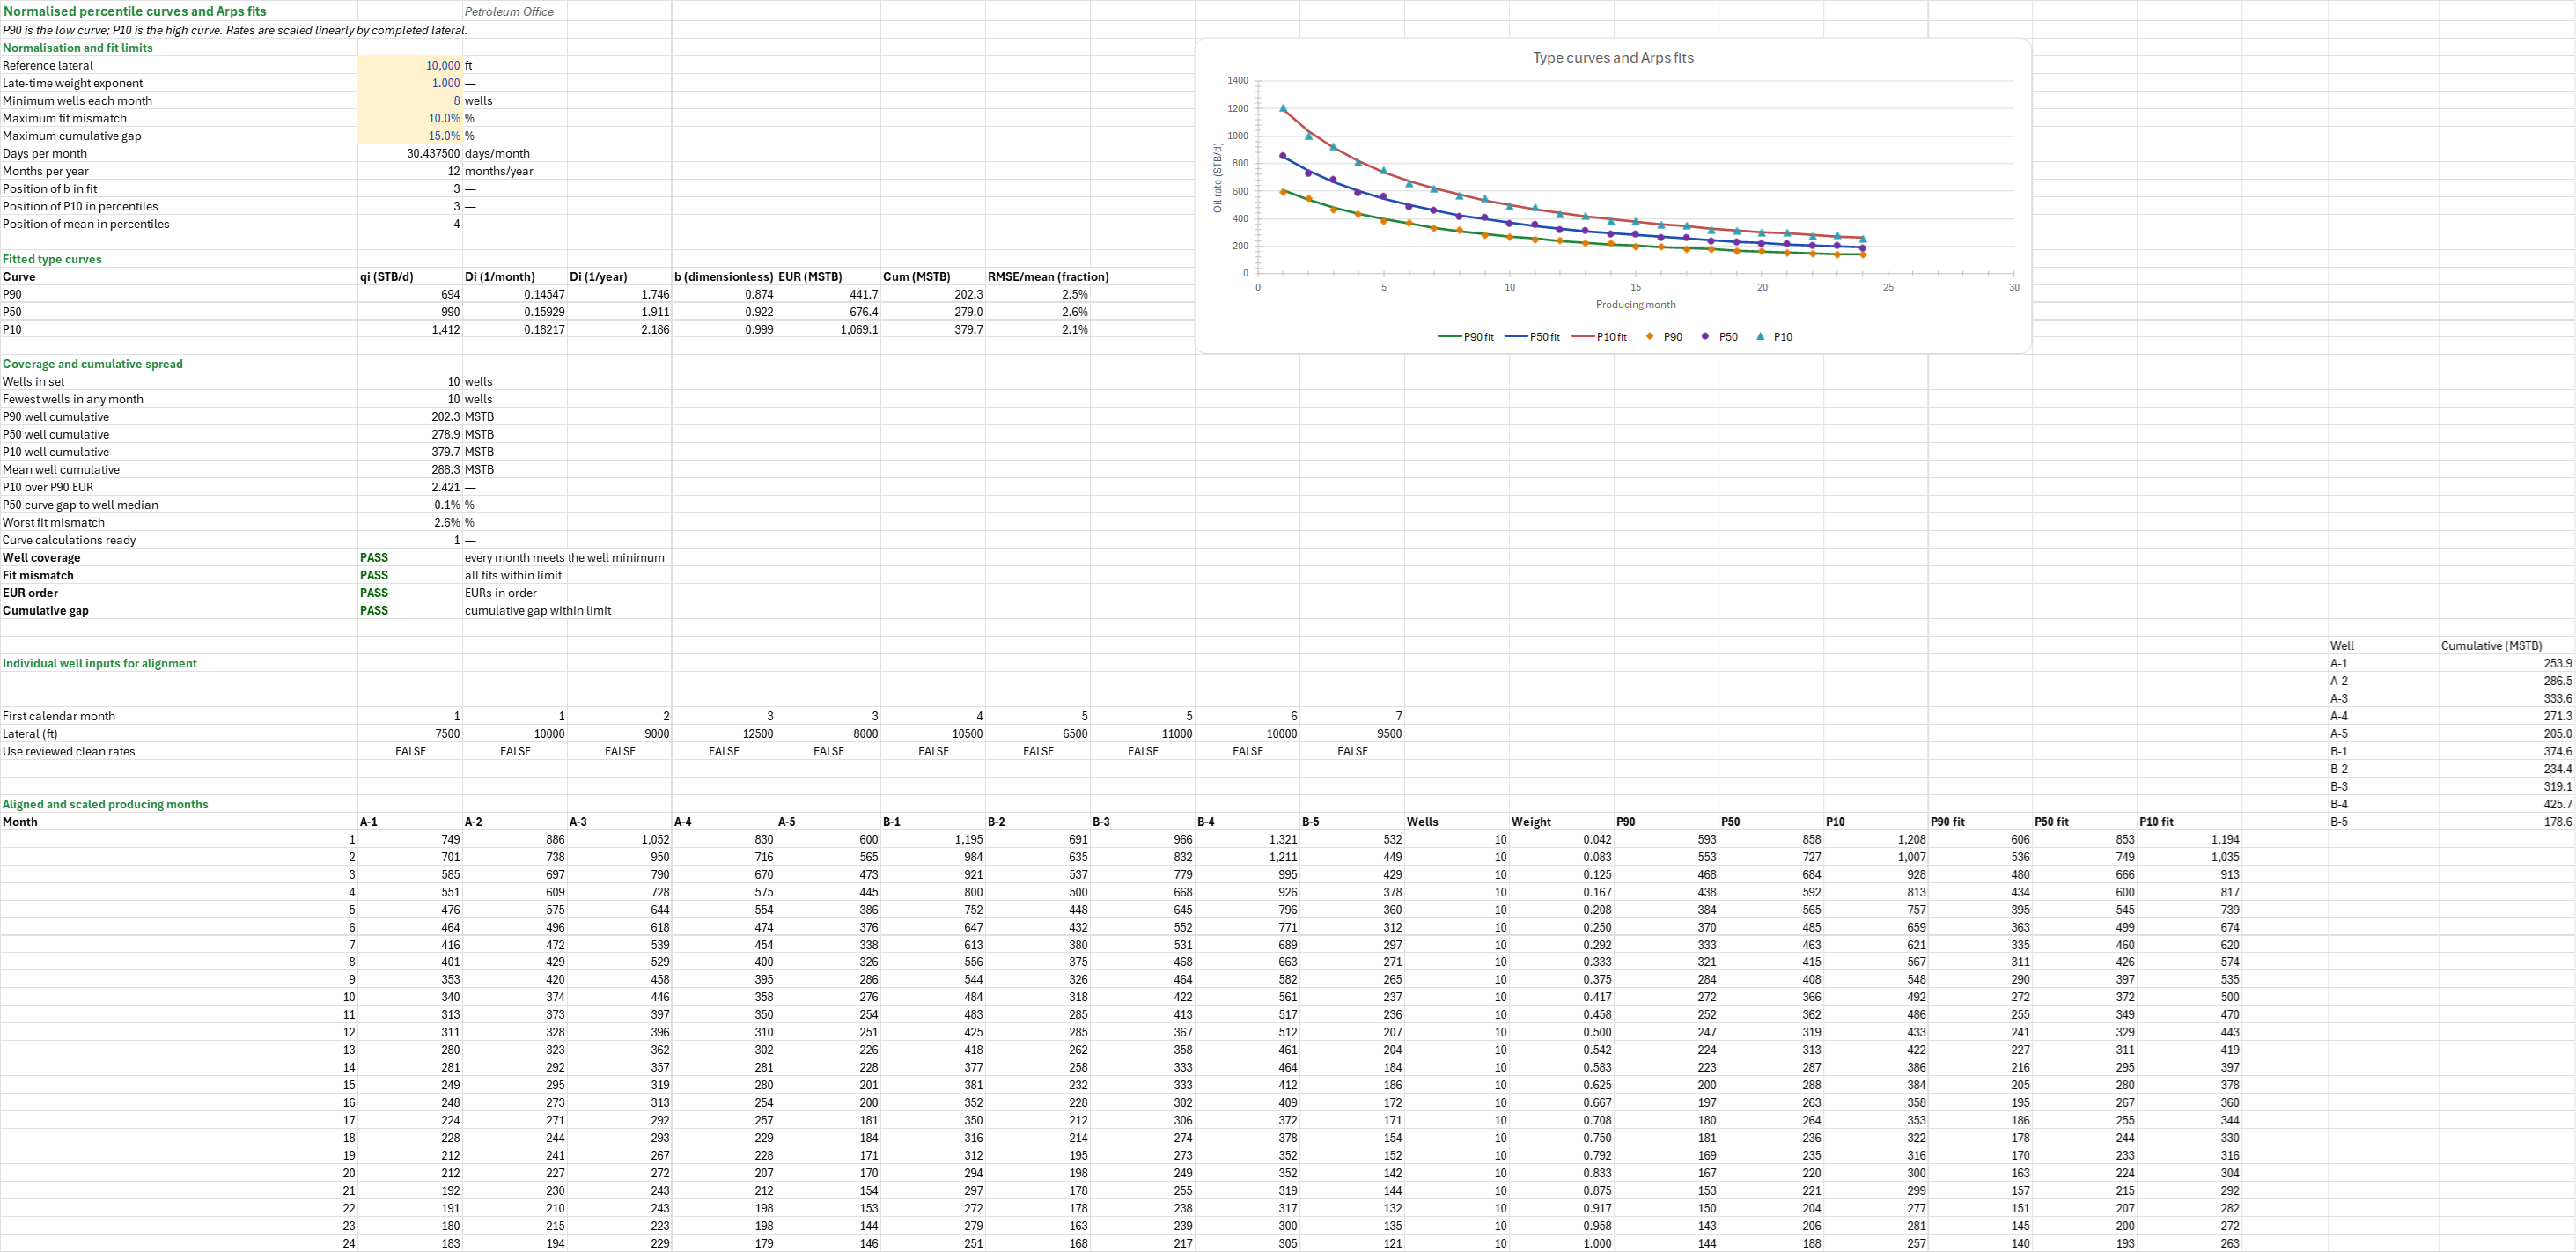
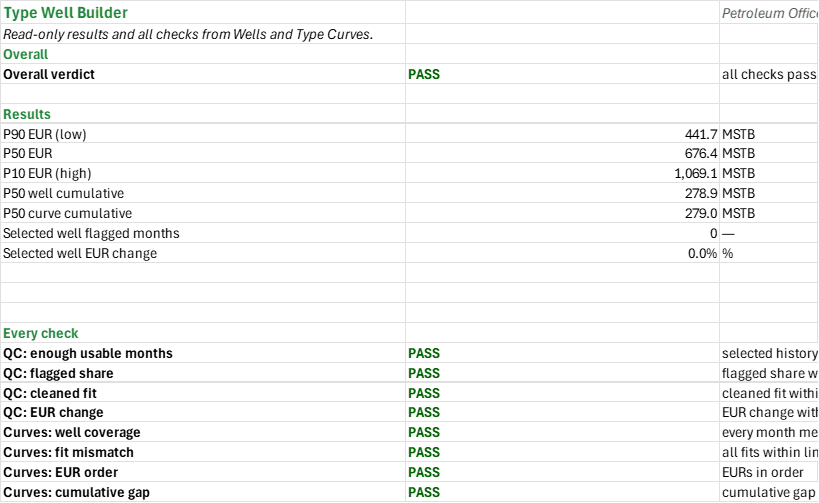
What should a new well in this play produce, low, middle and high? You enter ten offset wells' completed laterals and 30 calendar months of oil rates; the workbook aligns them at first production, scales each to a reference lateral, takes the monthly P90, P50 and P10 and fits each with Arps. You read off the three type curves and their EURs, the P50's 24-month cumulative against the wells' median, and an outlier screen of any one well before it joins the set.
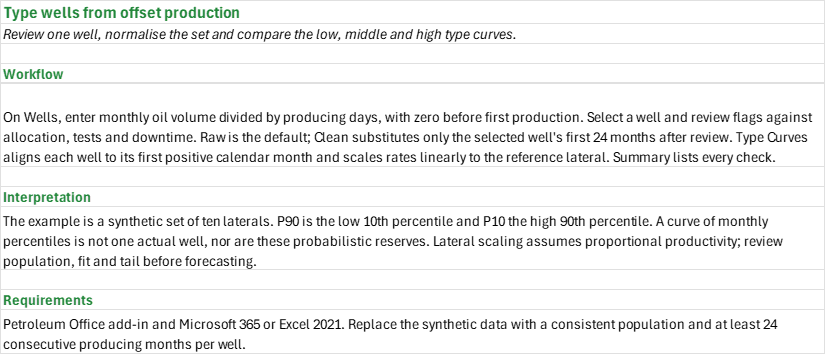
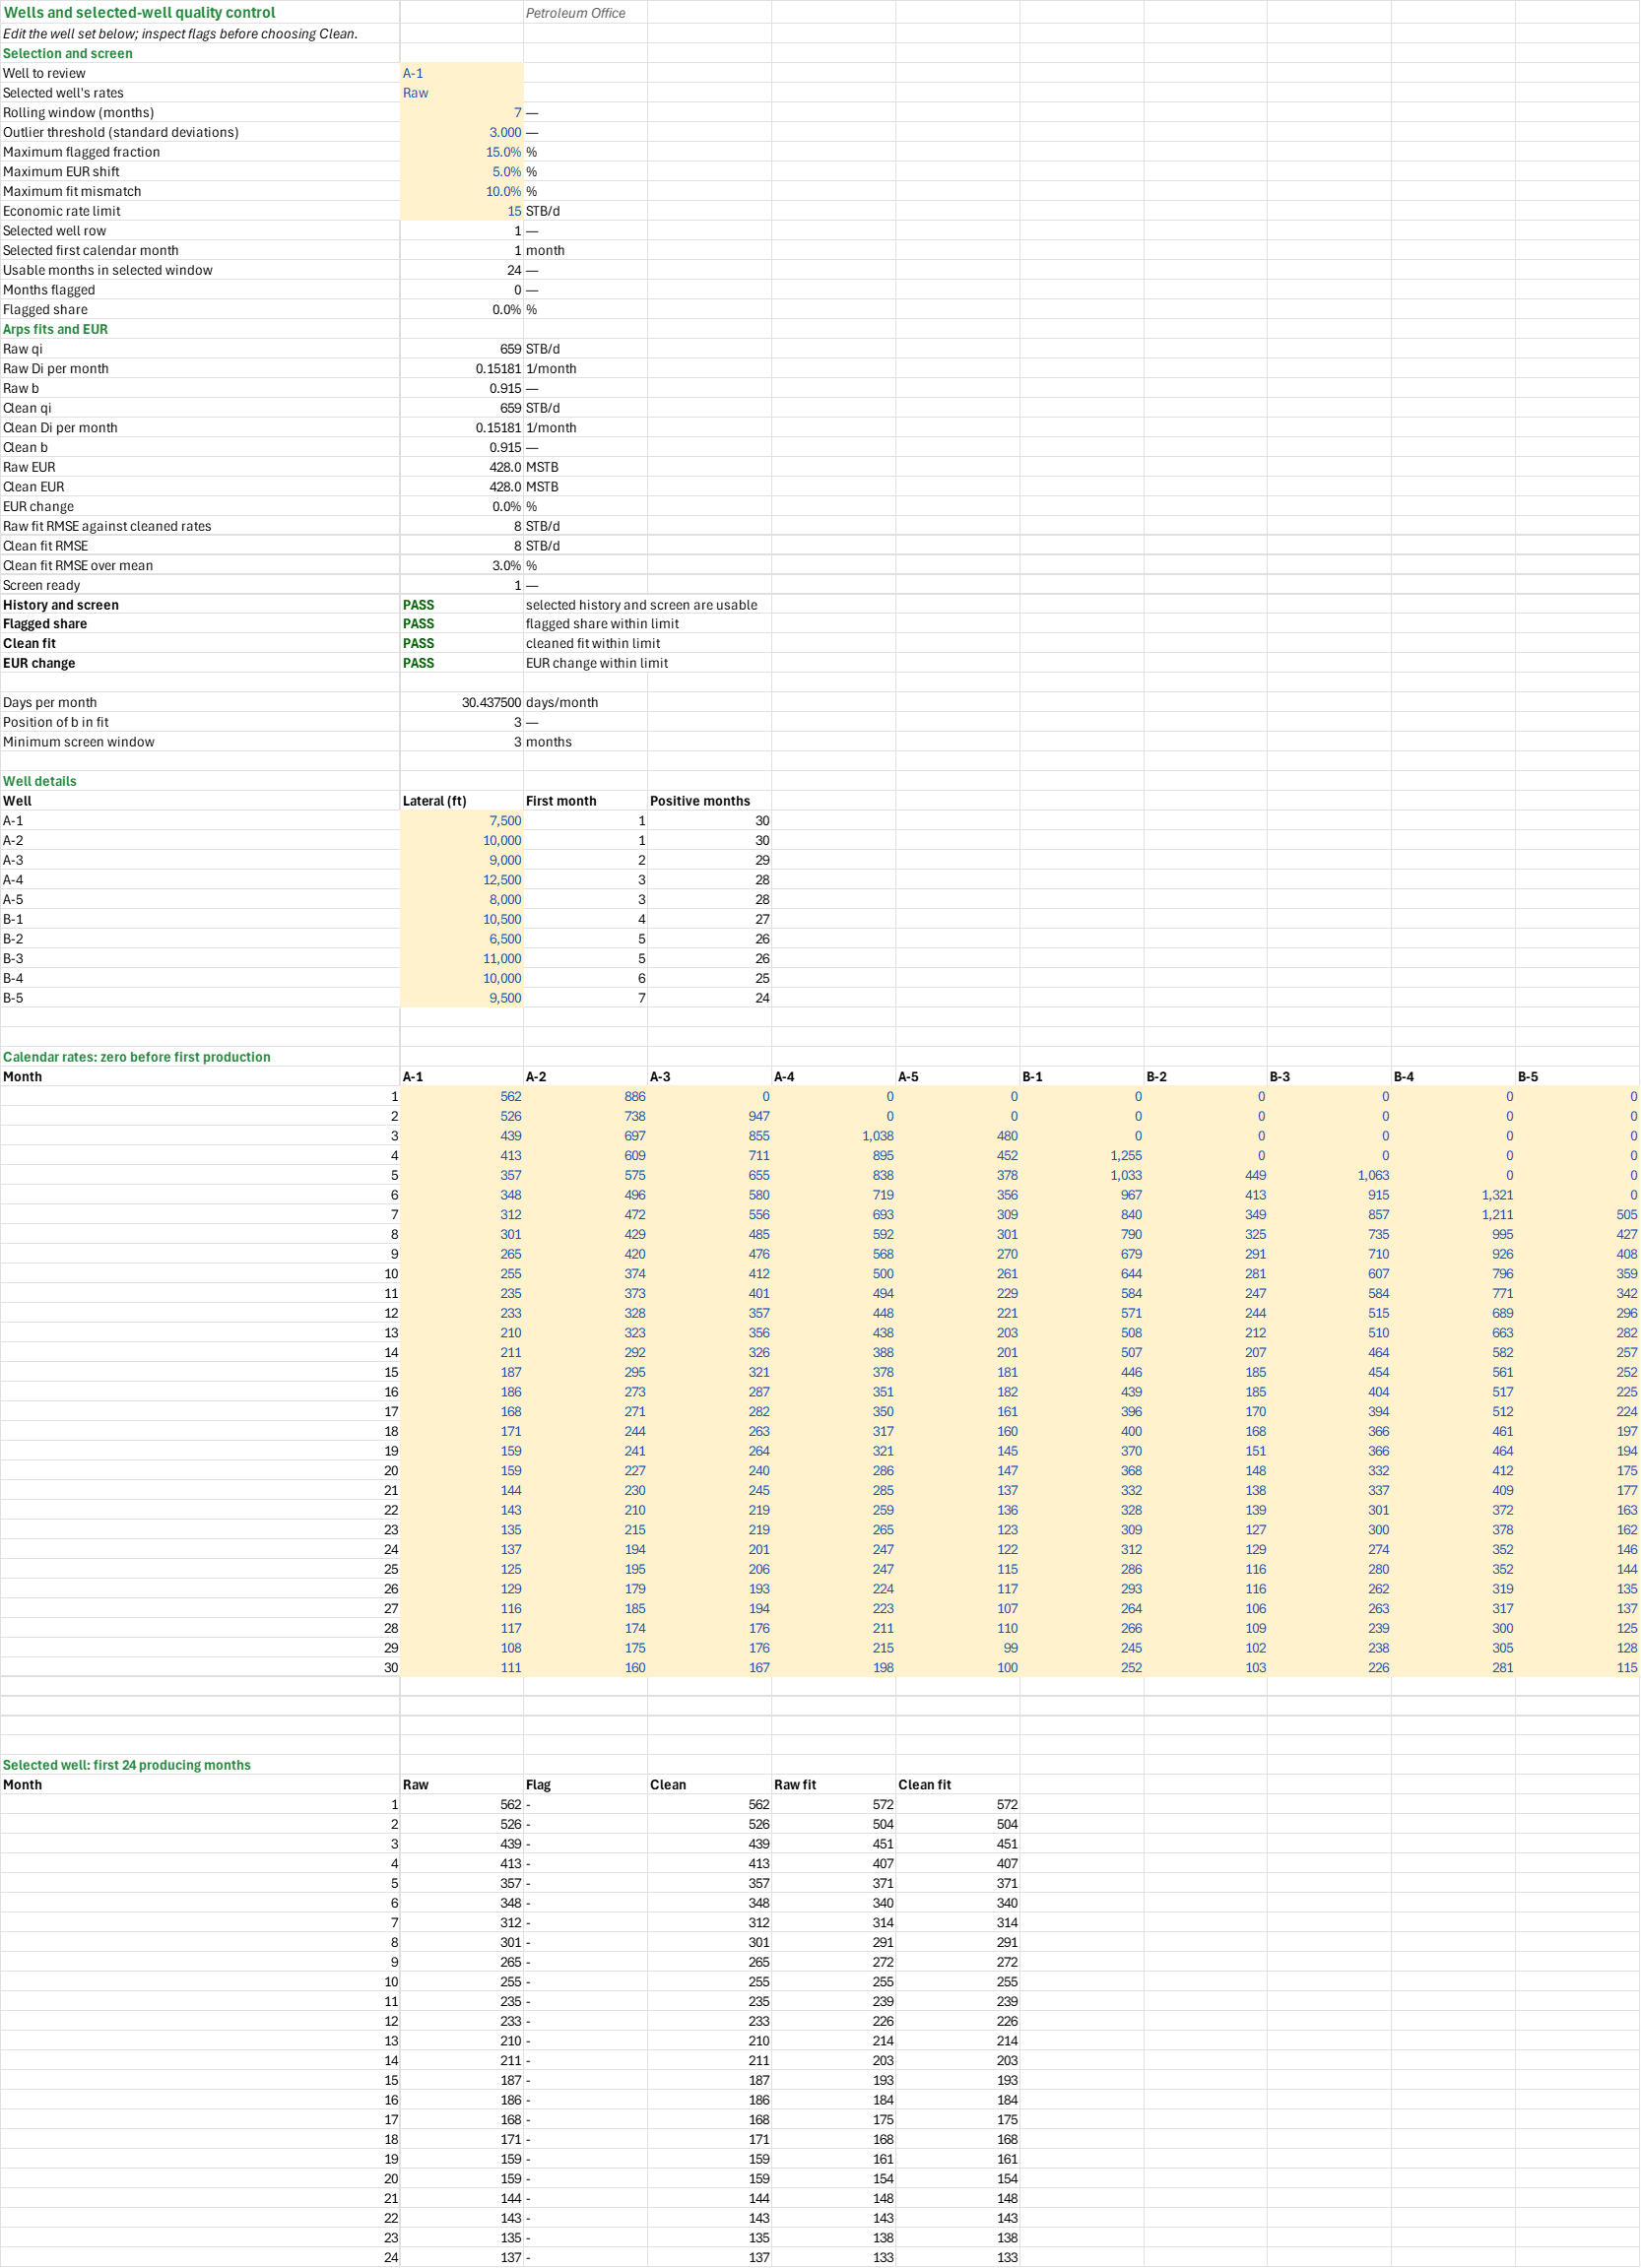
How to use it: On the Wells sheet, enter monthly volume divided by producing days, zeros before first production, and the completed length for each well. Use a consistent landing zone, completion and vintage, and at least eight to ten comparable wells with 24 consecutive producing months. Pick a well to review and check allocation, downtime, tests, frac hits and recompletions before changing it to Clean; review each flagged month against field records, as an outlier is not necessarily an error. On the Type Curves sheet, set the reference lateral, the late-time weight exponent and the coverage and fit limits, and read the percentile curves and EURs. Linear lateral scaling is an assumption, not a physical law. The Summary gathers the results and checks.
Method: A rate is monthly oil volume divided by producing days. Each well is aligned to its first positive calendar month and multiplied by reference lateral / well lateral. Each producing month's P90, P50 and P10 are PERCENTILE.INC at 0.1, 0.5 and 0.9. The Arps fits minimise weighted log error, using (month/24)^p as weight, with p the late-time weight exponent. EUR is calculated to the economic rate limit, with 30.4375 days per month. The selected well's rolling Z-score flags are reviewed and the flagged rates interpolated; an Arps fit compares the raw and clean histories. The raw set remains in use unless Clean is explicitly selected; Clean substitutes only the selected well's first 24 producing months.
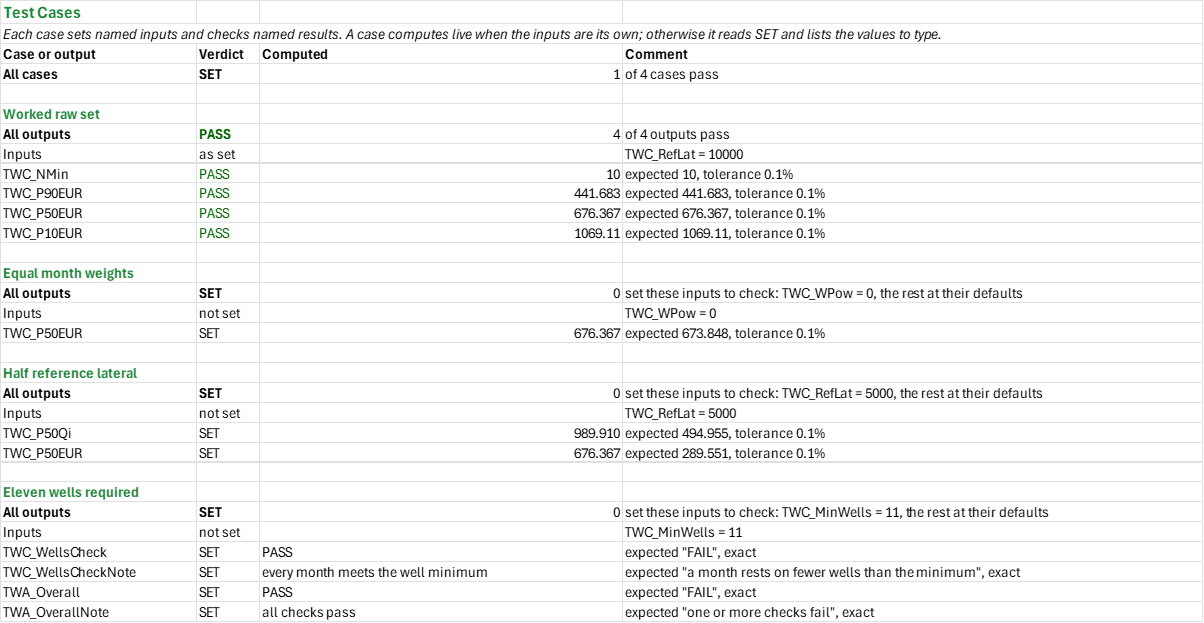
Example: Ten synthetic tight-oil laterals, 6,500 to 12,500 ft, start over seven calendar months. With raw rates, a 10,000 ft reference, late-time weight exponent 1 and a 15 STB/d limit, the independent type-well blueprint gives P90, P50 and P10 EURs of about 442, 676 and 1,069 MSTB. The P50 curve's 24-month cumulative is about 279.0 MSTB versus the wells' median of 278.9 MSTB. These are synthetic results, not reserves.
Validity
A curve of monthly percentiles is not a single well. P90 is the low 10th percentile, P10 the high 90th percentile, not probabilistic reserves for one well. The fitted Arps tail may be highly uncertain; compare with a terminal-decline forecast and older analogues. The outlier screen cannot distinguish a genuine operating event from an error and can miss runs of bad months. If a selected history is too short or the screen invalid, the screen reports FAIL and Clean does not substitute it. Missing months reduce the curve coverage; if any month has no contributing wells the fit is disabled. Review any FAIL or WARN before use.
References
- Arps, J.J. (1945), Analysis of Decline Curves, Transactions of the AIME 160, 228-247.
- Society of Petroleum Evaluation Engineers (2016), Monograph 4, Estimating Ultimate Recovery of Developed Wells in Low-Permeability Reservoirs.
- Society of Petroleum Engineers (2018), Petroleum Resources Management System, section 2.2.
Inputs
| Input | Unit | Default | Name |
|---|---|---|---|
| Well to review; selected well's rates (Raw or Clean) | — | A-1, Raw | TQC_Well, TQC_Mode |
| Lateral lengths and 30 months of oil rates | ft, STB/d | synthetic ten-well set | TQC_Lat, TQC_Rates |
| Rolling window; outlier threshold | months, standard deviations | 7, 3 | TQC_Window, TQC_NSigma |
| Maximum flagged fraction, maximum EUR shift, maximum fit mismatch | fraction | 0.15, 0.05, 0.1 | TQC_FlagMax, TQC_ShiftMax, TQC_FitMax |
| Economic rate limit (shared) | STB/d | 15 | TQC_QEcon |
| Reference lateral; late-time weight exponent | ft, dimensionless | 10000, 1 | TWC_RefLat, TWC_WPow |
| Minimum wells each month, maximum fit mismatch, maximum cumulative gap | wells, fraction, fraction | 8, 0.1, 0.15 | TWC_MinWells, TWC_FitMax, TWC_CumBand |
Sheets
Guide— the workflow and how to read the curves.Wells— the editable laterals and 30-month calendar of rates for the ten wells, the selected well's rolling Z-score screen, and its raw and clean Arps fits.Type Curves— the rates aligned at first production and scaled by lateral, the P90, P50 and P10 curves with their Arps fits and EURs, and the chart.Summary— the principal results and every check.Test Cases— the worked example and other cases, with expected and computed results.
Functions used
Names (125)
| Name | Refers to | Comment |
|---|---|---|
PO.RES.MC.PercentilesLAMBDA |
=LAMBDA(X, HSTACK(PERCENTILE.INC(X, 0.1), PERCENTILE.INC(X, 0.5), PERCENTILE.INC(X, 0.9), AVERAGE(X))) |
P90, P50, P10 (petroleum convention: P90 the low case, exceeded 90% of the time) and the mean of a column of outcomes; linear interpolation as PERCENTILE.INC. |
TQC_BPos |
Wells!$B$37 |
Position of b in fit |
TQC_Calendar |
Wells!$A$56:$K$85 |
Monthly oil rates by well |
TQC_Clean |
Wells!$D$92:$D$115 |
Selected well Clean |
TQC_CleanB |
Wells!$B$23 |
Clean b |
TQC_CleanDi |
Wells!$B$22 |
Clean Di per month, 1/month |
TQC_CleanEUR |
Wells!$B$25 |
Clean EUR, MSTB |
TQC_CleanFit |
Wells!$F$92:$F$115 |
Selected well CleanFit |
TQC_CleanQi |
Wells!$B$21 |
Clean qi, STB/d |
TQC_CleanRMSE |
Wells!$B$28 |
Clean fit RMSE, STB/d |
TQC_DMo |
Wells!$B$36 |
Days per month, days/month |
TQC_DataCheck |
Wells!$B$31 |
History and screen verdict |
TQC_DataCheckNote |
Wells!$C$31 |
History and screen comment |
TQC_First |
Wells!$C$42:$C$51 |
First producing month |
TQC_FitCheck |
Wells!$B$33 |
Clean fit verdict |
TQC_FitCheckNote |
Wells!$C$33 |
Clean fit comment |
TQC_FitMax |
Wells!$B$10 |
Maximum fit mismatch, % |
TQC_Flag |
Wells!$C$92:$C$115 |
Selected well Flag |
TQC_FlagCheck |
Wells!$B$32 |
Flagged share verdict |
TQC_FlagCheckNote |
Wells!$C$32 |
Flagged share comment |
TQC_FlagMax |
Wells!$B$8 |
Maximum flagged fraction, % |
TQC_FlagShare |
Wells!$B$16 |
Flagged share, % |
TQC_Flagged |
Wells!$B$15 |
Months flagged |
TQC_History |
Wells!$A$92:$F$115 |
Selected rates, flags, cleaned rates and fits |
TQC_Inputs |
Wells!$B$4:$B$11 |
Selected well, cleaning settings and economic limit |
TQC_Lat |
Wells!$B$42:$B$51 |
Lateral lengths |
TQC_M |
Wells!$A$56:$A$85 |
Calendar months |
TQC_MinWindow |
Wells!$B$38 |
Minimum screen window, months |
TQC_Mode |
Wells!$B$5 |
Selected well's rates |
TQC_N |
Wells!$B$14 |
Usable months in selected window |
TQC_NSigma |
Wells!$B$7 |
Outlier threshold (standard deviations) |
TQC_Names |
Wells!$A$42:$A$51 |
Well names |
TQC_Pick |
Wells!$B$12 |
Selected well row |
TQC_Q |
Wells!$B$92:$B$115 |
Selected well Q |
TQC_QEcon |
Wells!$B$11 |
Economic rate limit, STB/d |
TQC_Rates |
Wells!$B$56:$K$85 |
Calendar rates |
TQC_RawB |
Wells!$B$20 |
Raw b |
TQC_RawDi |
Wells!$B$19 |
Raw Di per month, 1/month |
TQC_RawEUR |
Wells!$B$24 |
Raw EUR, MSTB |
TQC_RawFit |
Wells!$E$92:$E$115 |
Selected well RawFit |
TQC_RawQi |
Wells!$B$18 |
Raw qi, STB/d |
TQC_RawRMSE |
Wells!$B$27 |
Raw fit RMSE against cleaned rates, STB/d |
TQC_Ready |
Wells!$B$30 |
Screen ready |
TQC_RefitCheck |
Wells!$B$34 |
EUR change verdict |
TQC_RefitCheckNote |
Wells!$C$34 |
EUR change comment |
TQC_RelErr |
Wells!$B$29 |
Clean fit RMSE over mean, % |
TQC_Results |
Wells!$B$12:$B$30 |
Screen, fits and recovery results |
TQC_Shift |
Wells!$B$26 |
EUR change, % |
TQC_ShiftMax |
Wells!$B$9 |
Maximum EUR shift, % |
TQC_Start |
Wells!$B$13 |
Selected first calendar month, month |
TQC_T |
Wells!$A$92:$A$115 |
Selected well T |
TQC_Well |
Wells!$B$4 |
Well to review |
TQC_Wells |
Wells!$A$42:$D$51 |
Names, editable laterals, first positive month and positive counts |
TQC_Window |
Wells!$B$6 |
Rolling window (months) |
TWA_Checks |
Summary!$B$18:$B$25 |
Every check from the workbook |
TWA_CumP50 |
Summary!$B$10 |
P50 well cumulative, MSTB |
TWA_Flagged |
Summary!$B$12 |
Selected well flagged months |
TWA_Overall |
Summary!$B$4 |
Overall verdict verdict |
TWA_OverallNote |
Summary!$C$4 |
Overall verdict comment |
TWA_P10EUR |
Summary!$B$9 |
P10 EUR (high), MSTB |
TWA_P50Cum |
Summary!$B$11 |
P50 curve cumulative, MSTB |
TWA_P50EUR |
Summary!$B$8 |
P50 EUR, MSTB |
TWA_P90EUR |
Summary!$B$7 |
P90 EUR (low), MSTB |
TWA_Shift |
Summary!$B$13 |
Selected well EUR change, % |
TWC_Aligned |
'Type Curves'!$A$48:$S$71 |
Scaled well rates, coverage, weights, percentiles and fits |
TWC_BPos |
'Type Curves'!$B$11 |
Position of b in fit |
TWC_Count |
'Type Curves'!$L$48:$L$71 |
Well count each month |
TWC_CumBand |
'Type Curves'!$B$8 |
Maximum cumulative gap, % |
TWC_CumCheck |
'Type Curves'!$B$35 |
Cumulative gap verdict |
TWC_CumCheckNote |
'Type Curves'!$C$35 |
Cumulative gap comment |
TWC_CumGap |
'Type Curves'!$B$29 |
P50 curve gap to well median, % |
TWC_CumMean |
'Type Curves'!$B$27 |
Mean well cumulative, MSTB |
TWC_CumP10 |
'Type Curves'!$B$26 |
P10 well cumulative, MSTB |
TWC_CumP50 |
'Type Curves'!$B$25 |
P50 well cumulative, MSTB |
TWC_CumP90 |
'Type Curves'!$B$24 |
P90 well cumulative, MSTB |
TWC_Cums |
'Type Curves'!$V$38:$V$47 |
Individual well cumulatives, MSTB |
TWC_DMo |
'Type Curves'!$B$9 |
Days per month, days/month |
TWC_EurRatio |
'Type Curves'!$B$28 |
P10 over P90 EUR |
TWC_FitCheck |
'Type Curves'!$B$33 |
Fit mismatch verdict |
TWC_FitCheckNote |
'Type Curves'!$C$33 |
Fit mismatch comment |
TWC_FitMax |
'Type Curves'!$B$7 |
Maximum fit mismatch, % |
TWC_FitP10 |
'Type Curves'!$S$48:$S$71 |
P10 Arps fit |
TWC_FitP50 |
'Type Curves'!$R$48:$R$71 |
P50 Arps fit |
TWC_FitP90 |
'Type Curves'!$Q$48:$Q$71 |
P90 Arps fit |
TWC_Fits |
'Type Curves'!$A$17:$H$19 |
Arps parameters, EUR, cumulative and mismatch |
TWC_K |
'Type Curves'!$A$48:$A$71 |
Producing months |
TWC_MeanPos |
'Type Curves'!$B$13 |
Position of mean in percentiles |
TWC_MinWells |
'Type Curves'!$B$6 |
Minimum wells each month, wells |
TWC_MoYr |
'Type Curves'!$B$10 |
Months per year, months/year |
TWC_NMin |
'Type Curves'!$B$23 |
Fewest wells in any month, wells |
TWC_NWells |
'Type Curves'!$B$22 |
Wells in set, wells |
TWC_OrderCheck |
'Type Curves'!$B$34 |
EUR order verdict |
TWC_OrderCheckNote |
'Type Curves'!$C$34 |
EUR order comment |
TWC_P10 |
'Type Curves'!$P$48:$P$71 |
P10 type curve |
TWC_P10B |
'Type Curves'!$E$19 |
P10 B |
TWC_P10Cum |
'Type Curves'!$G$19 |
P10 Cum |
TWC_P10Di |
'Type Curves'!$D$19 |
P10 Di |
TWC_P10DiM |
'Type Curves'!$C$19 |
P10 DiM |
TWC_P10EUR |
'Type Curves'!$F$19 |
P10 EUR |
TWC_P10Err |
'Type Curves'!$H$19 |
P10 Err |
TWC_P10Pos |
'Type Curves'!$B$12 |
Position of P10 in percentiles |
TWC_P10Qi |
'Type Curves'!$B$19 |
P10 Qi |
TWC_P50 |
'Type Curves'!$O$48:$O$71 |
P50 type curve |
TWC_P50B |
'Type Curves'!$E$18 |
P50 B |
TWC_P50Cum |
'Type Curves'!$G$18 |
P50 Cum |
TWC_P50Di |
'Type Curves'!$D$18 |
P50 Di |
TWC_P50DiM |
'Type Curves'!$C$18 |
P50 DiM |
TWC_P50EUR |
'Type Curves'!$F$18 |
P50 EUR |
TWC_P50Err |
'Type Curves'!$H$18 |
P50 Err |
TWC_P50Qi |
'Type Curves'!$B$18 |
P50 Qi |
TWC_P90 |
'Type Curves'!$N$48:$N$71 |
P90 type curve |
TWC_P90B |
'Type Curves'!$E$17 |
P90 B |
TWC_P90Cum |
'Type Curves'!$G$17 |
P90 Cum |
TWC_P90Di |
'Type Curves'!$D$17 |
P90 Di |
TWC_P90DiM |
'Type Curves'!$C$17 |
P90 DiM |
TWC_P90EUR |
'Type Curves'!$F$17 |
P90 EUR |
TWC_P90Err |
'Type Curves'!$H$17 |
P90 Err |
TWC_P90Qi |
'Type Curves'!$B$17 |
P90 Qi |
TWC_Ready |
'Type Curves'!$B$31 |
Curve calculations ready |
TWC_RefLat |
'Type Curves'!$B$4 |
Reference lateral, ft |
TWC_W |
'Type Curves'!$M$48:$M$71 |
Fit weights |
TWC_WPow |
'Type Curves'!$B$5 |
Late-time weight exponent |
TWC_WellsCheck |
'Type Curves'!$B$32 |
Well coverage verdict |
TWC_WellsCheckNote |
'Type Curves'!$C$32 |
Well coverage comment |
TWC_WorstErr |
'Type Curves'!$B$30 |
Worst fit mismatch, % |
Details
| Opens in | Needs the Petroleum Office add-in: its PO functions show #NAME? without it once Excel recalculates. Needs Microsoft 365 or Excel 2024: it uses functions Excel 2016 doesn't have, such as named LAMBDAs, which show #NAME? there. |
| File | TypeWell.xlsx, 51 KB |
| Category | Production |
| For agents and tools | Descriptor (.md) |