Gas Well Deliverability
Description
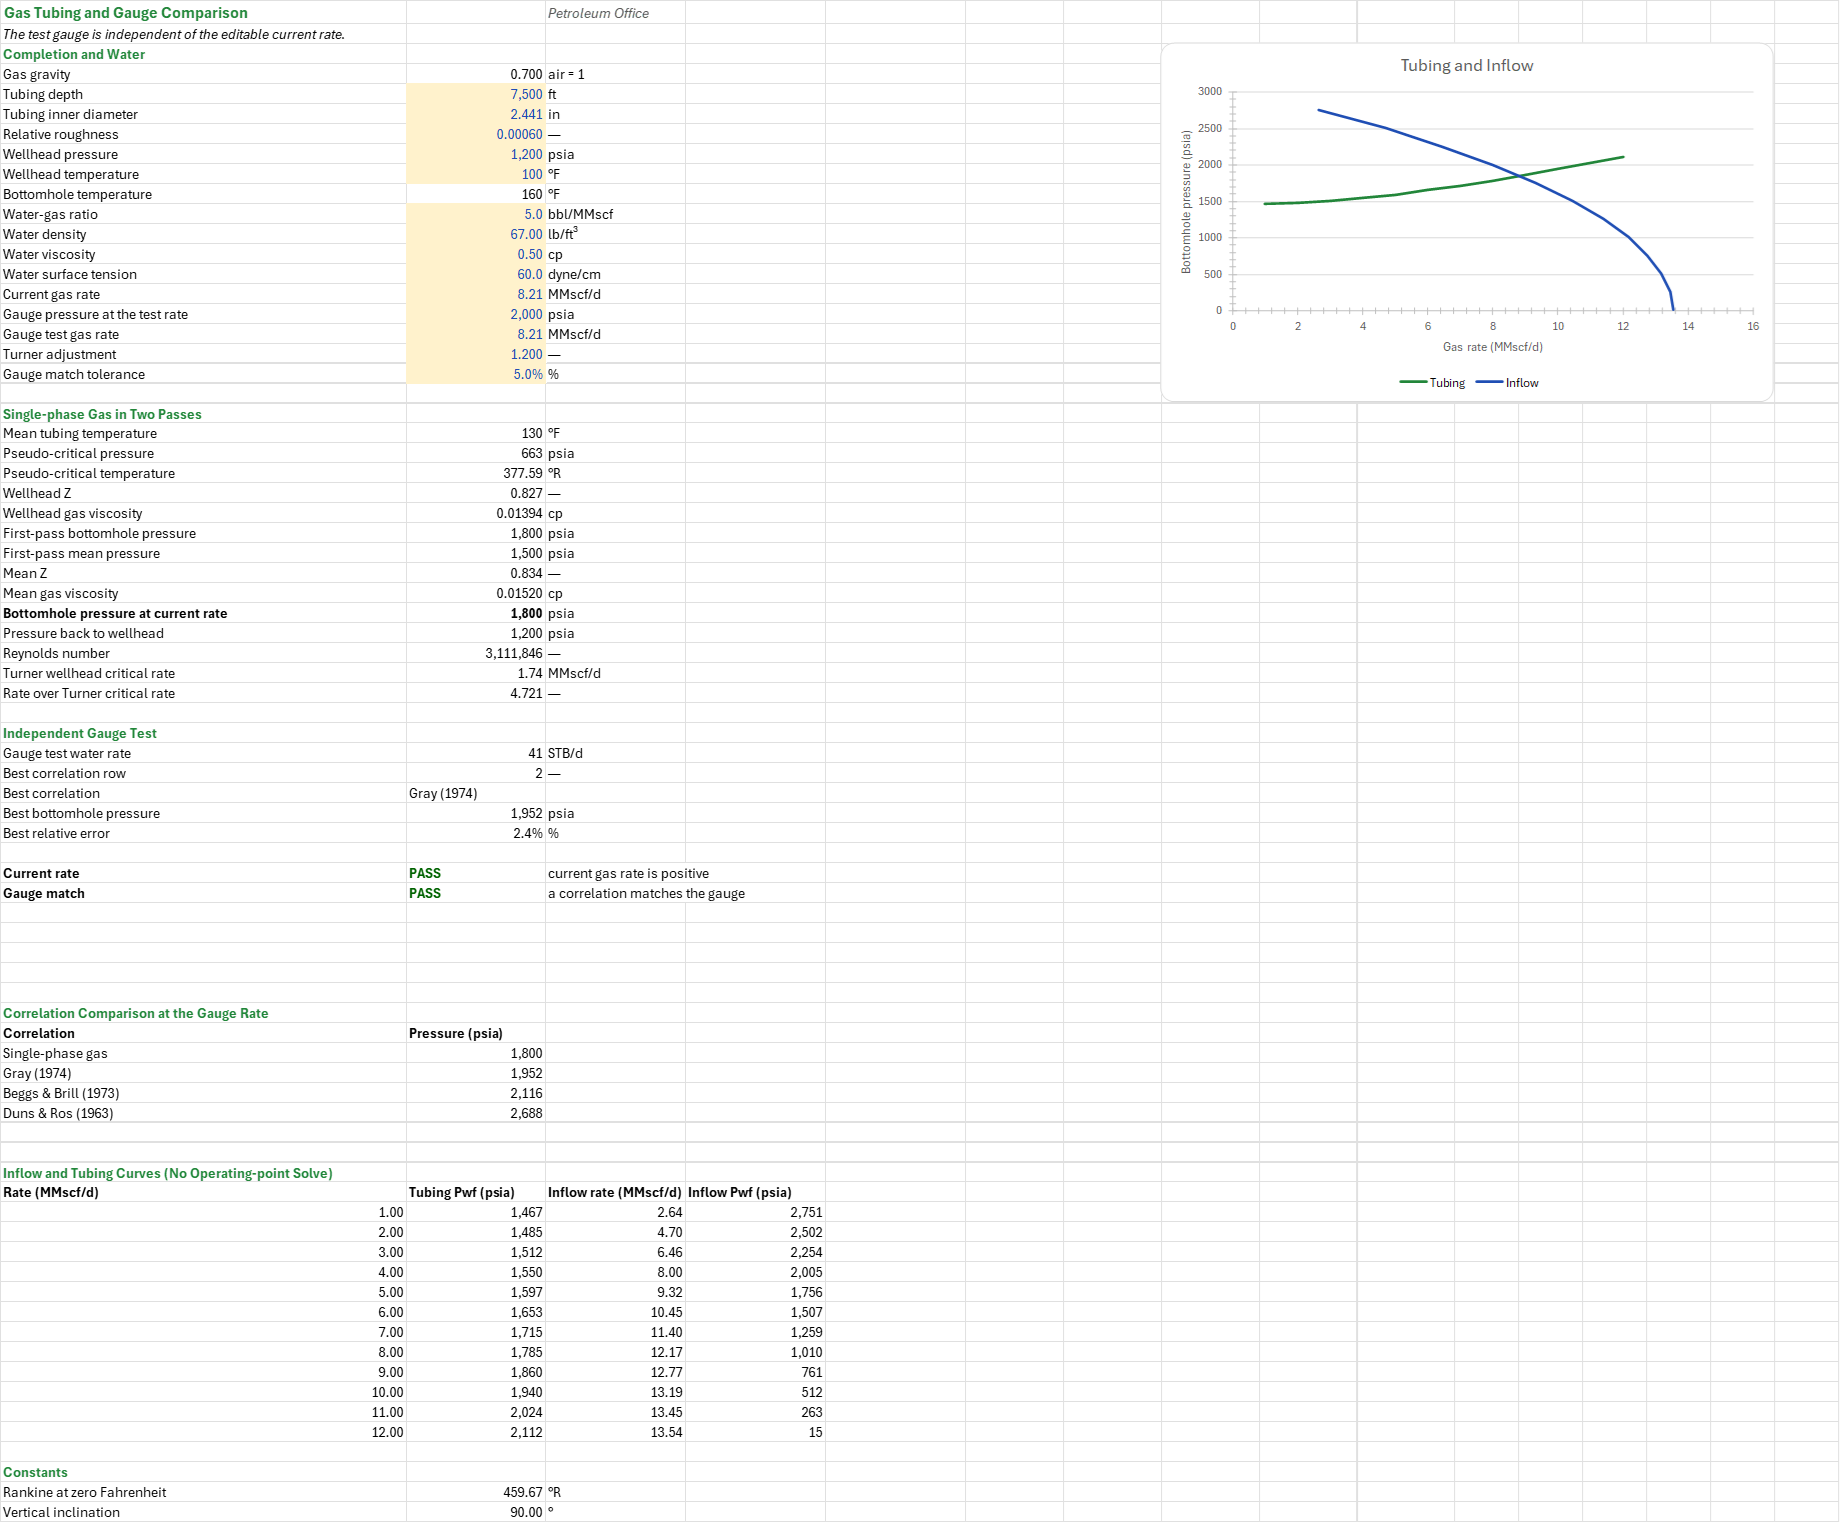
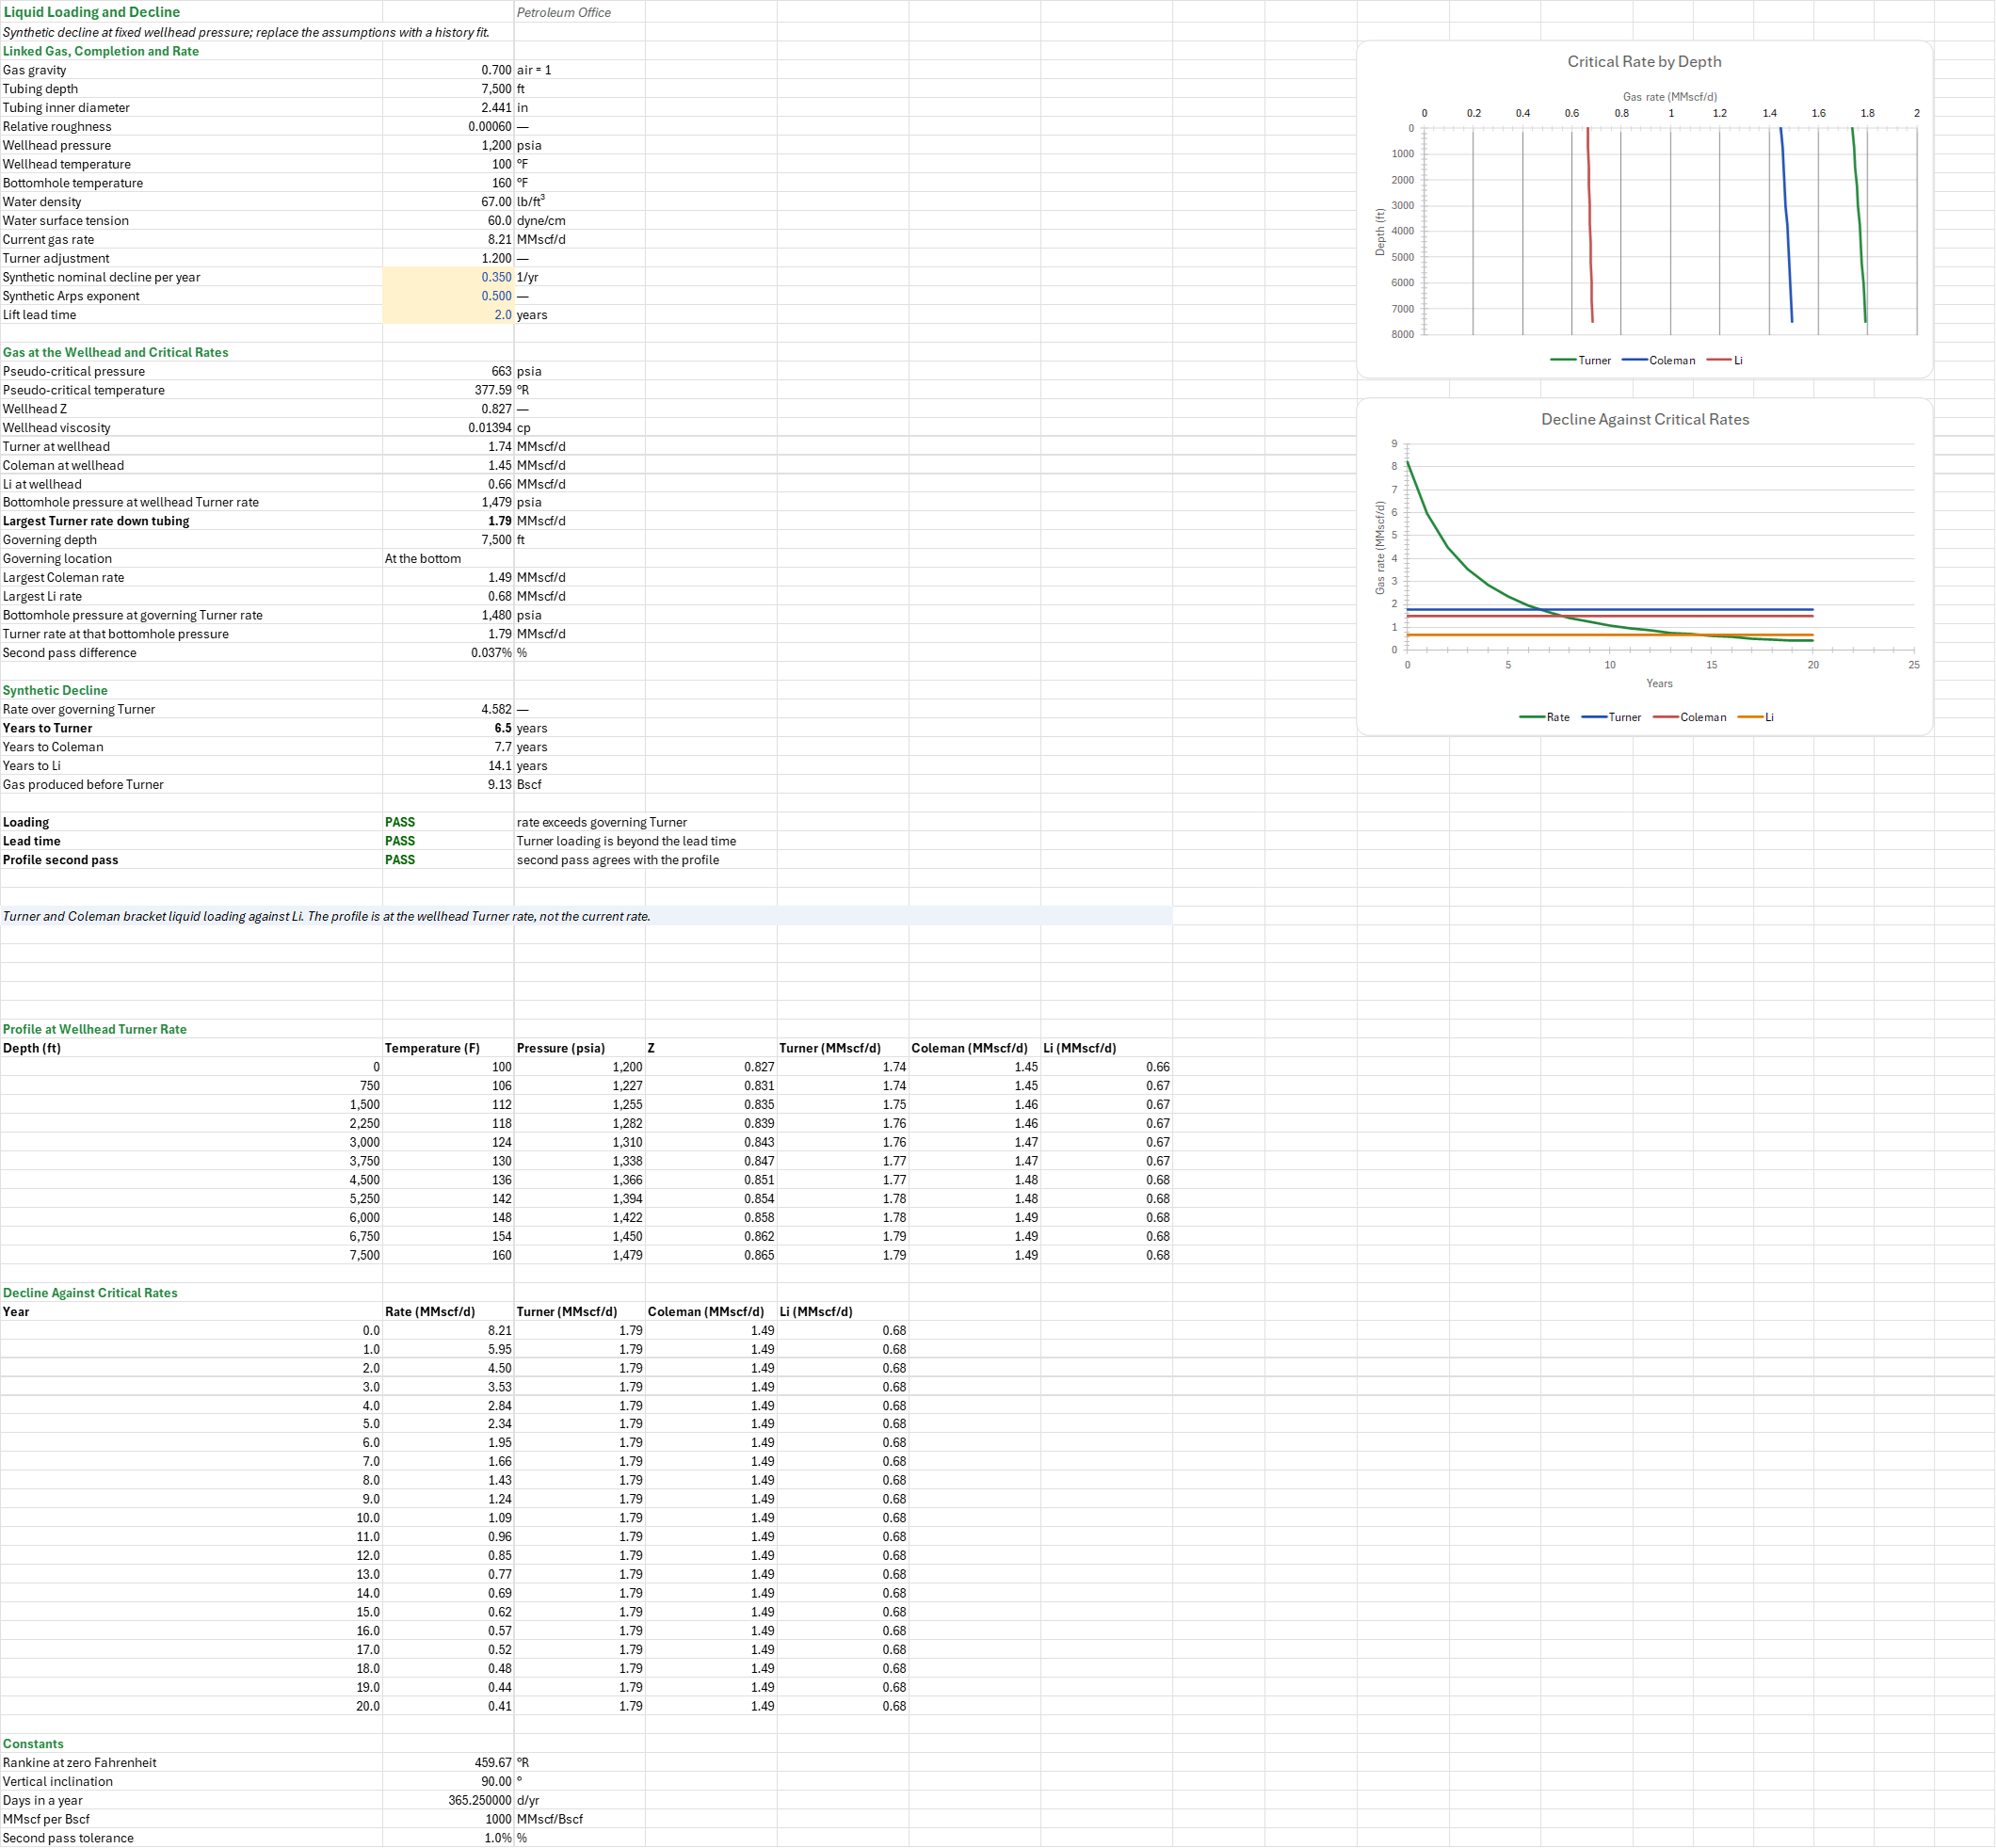
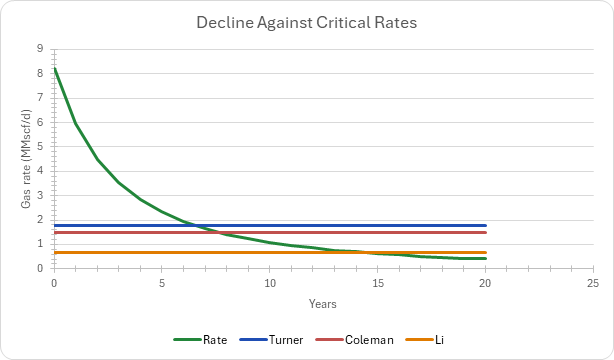
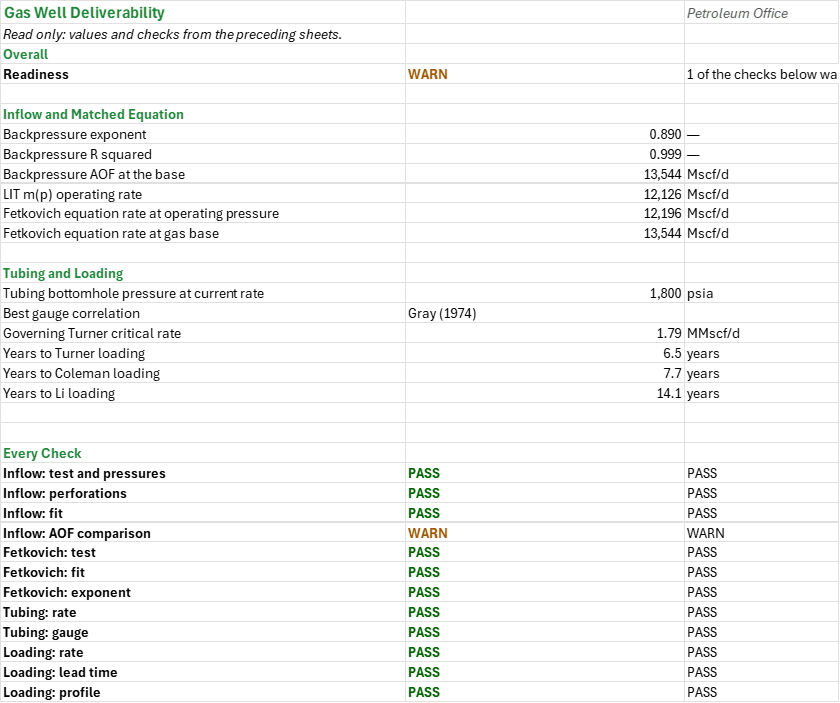
How much gas can this well deliver, and when will it start to load up with liquid? You enter the reservoir and completion, four stabilized flow-after-flow test points, the tubing and wellhead, the water yield, an independent gauge test and a synthetic decline. You read off the backpressure and laminar-inertial-turbulent fits with their AOF, the tubing's match to the gauge, and the Turner, Coleman and Li critical rates along the tubing and against the decline. Pressures psia; inflow rates Mscf/d, tubing and loading rates MMscf/d.
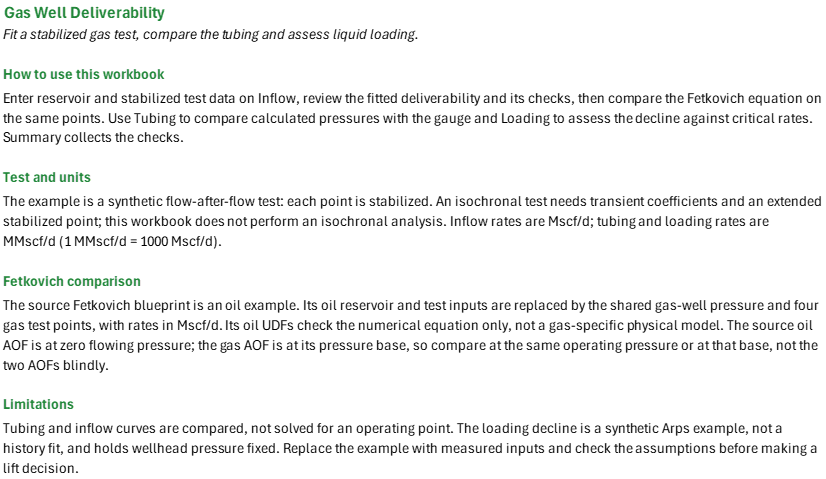
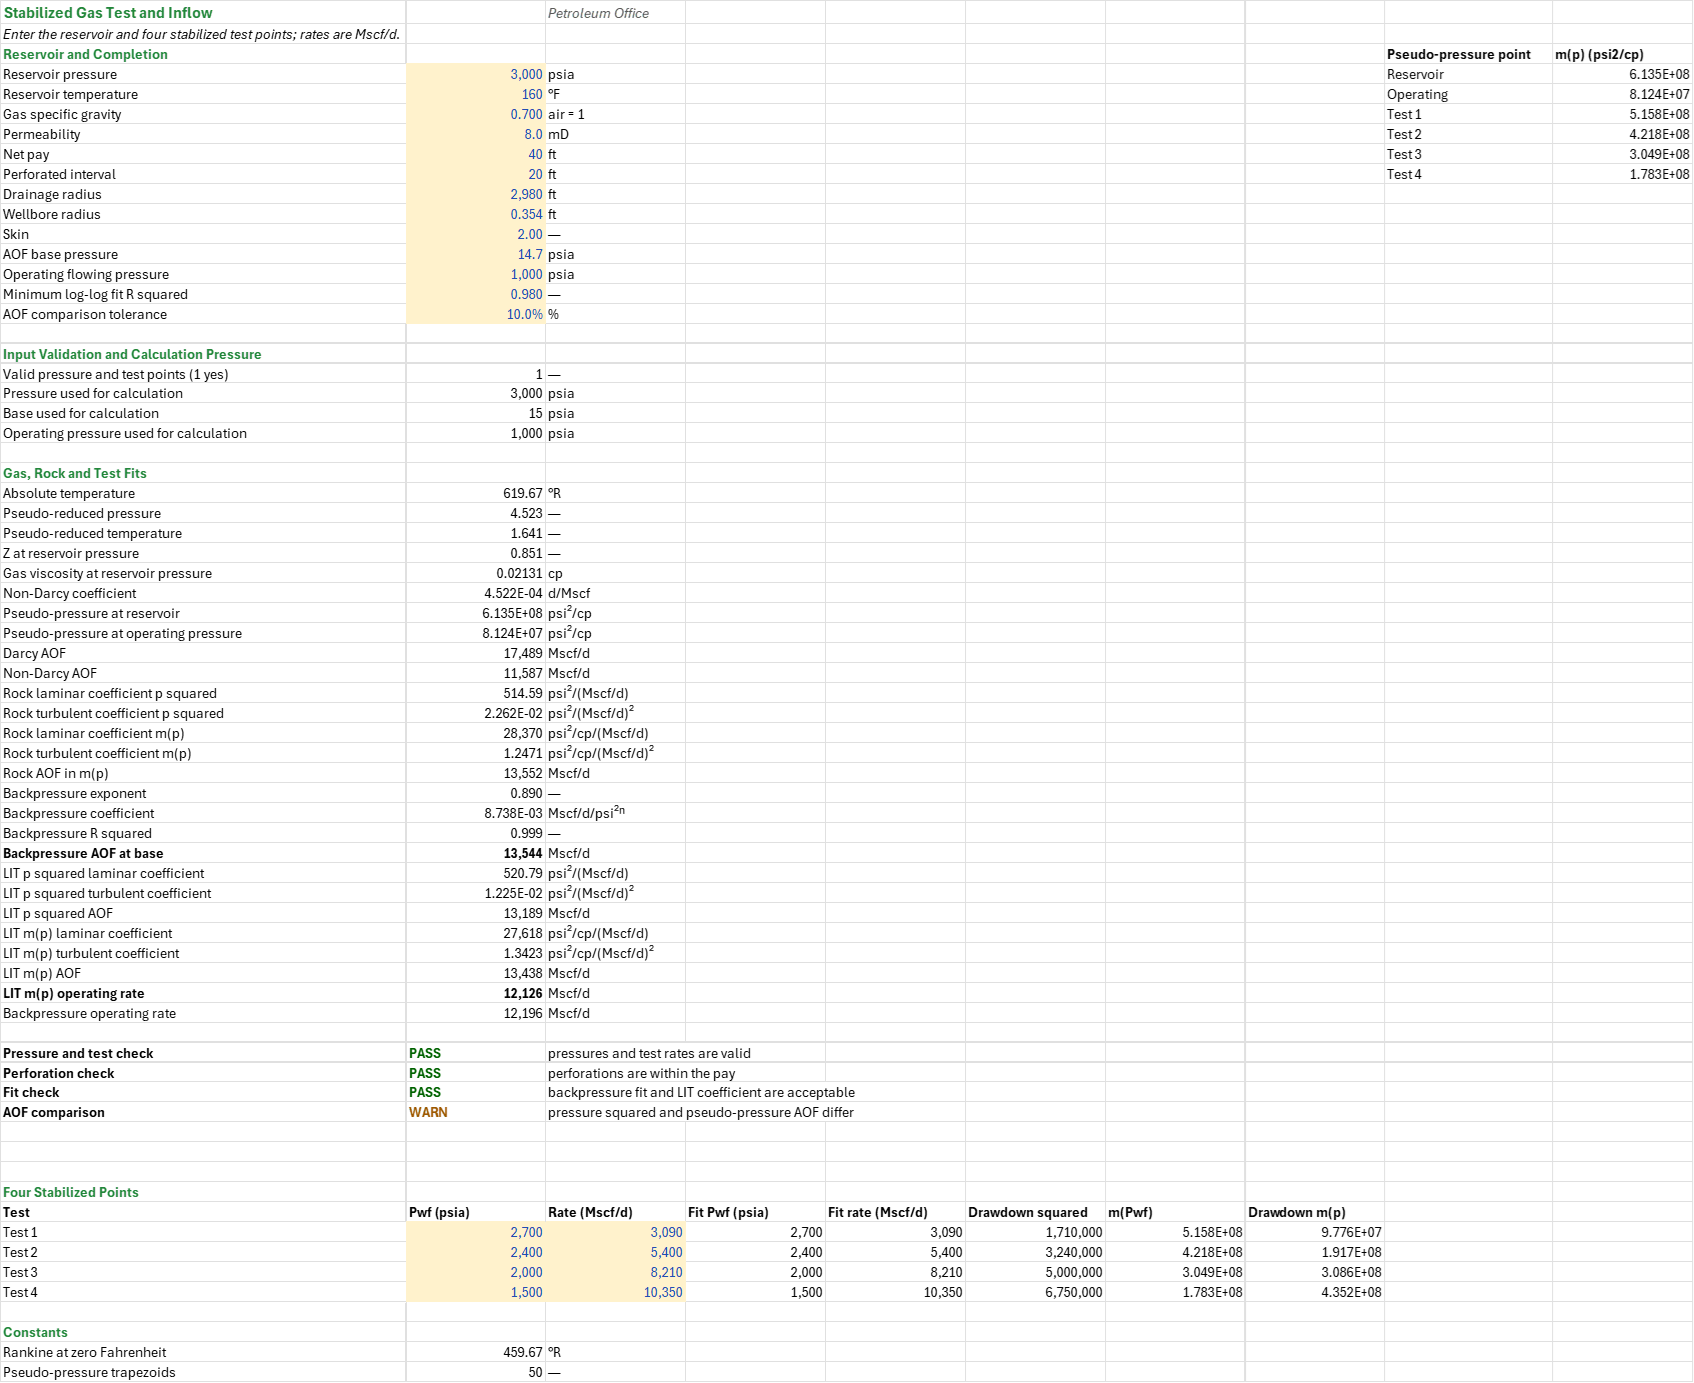
How to use it: The well and its test are synthetic; replace the example with measured data. Enter the reservoir, completion and the four stabilized test points on the Inflow sheet; the Fetkovich sheet reads them and needs no input. Enter the tubing, wellhead, water properties, the current rate and the gauge test on the Tubing sheet, and check the correlations against the gauge. Replace the synthetic decline on the Loading sheet with a history fit, then read the lead time to lift and every check on the Summary.
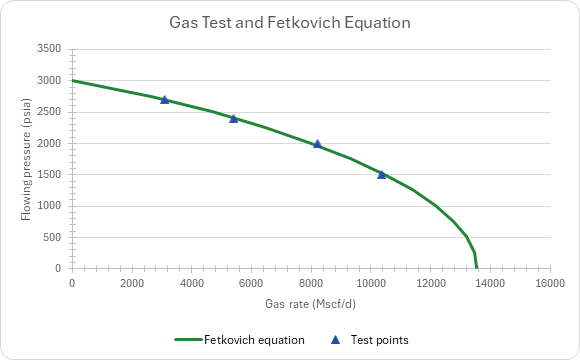
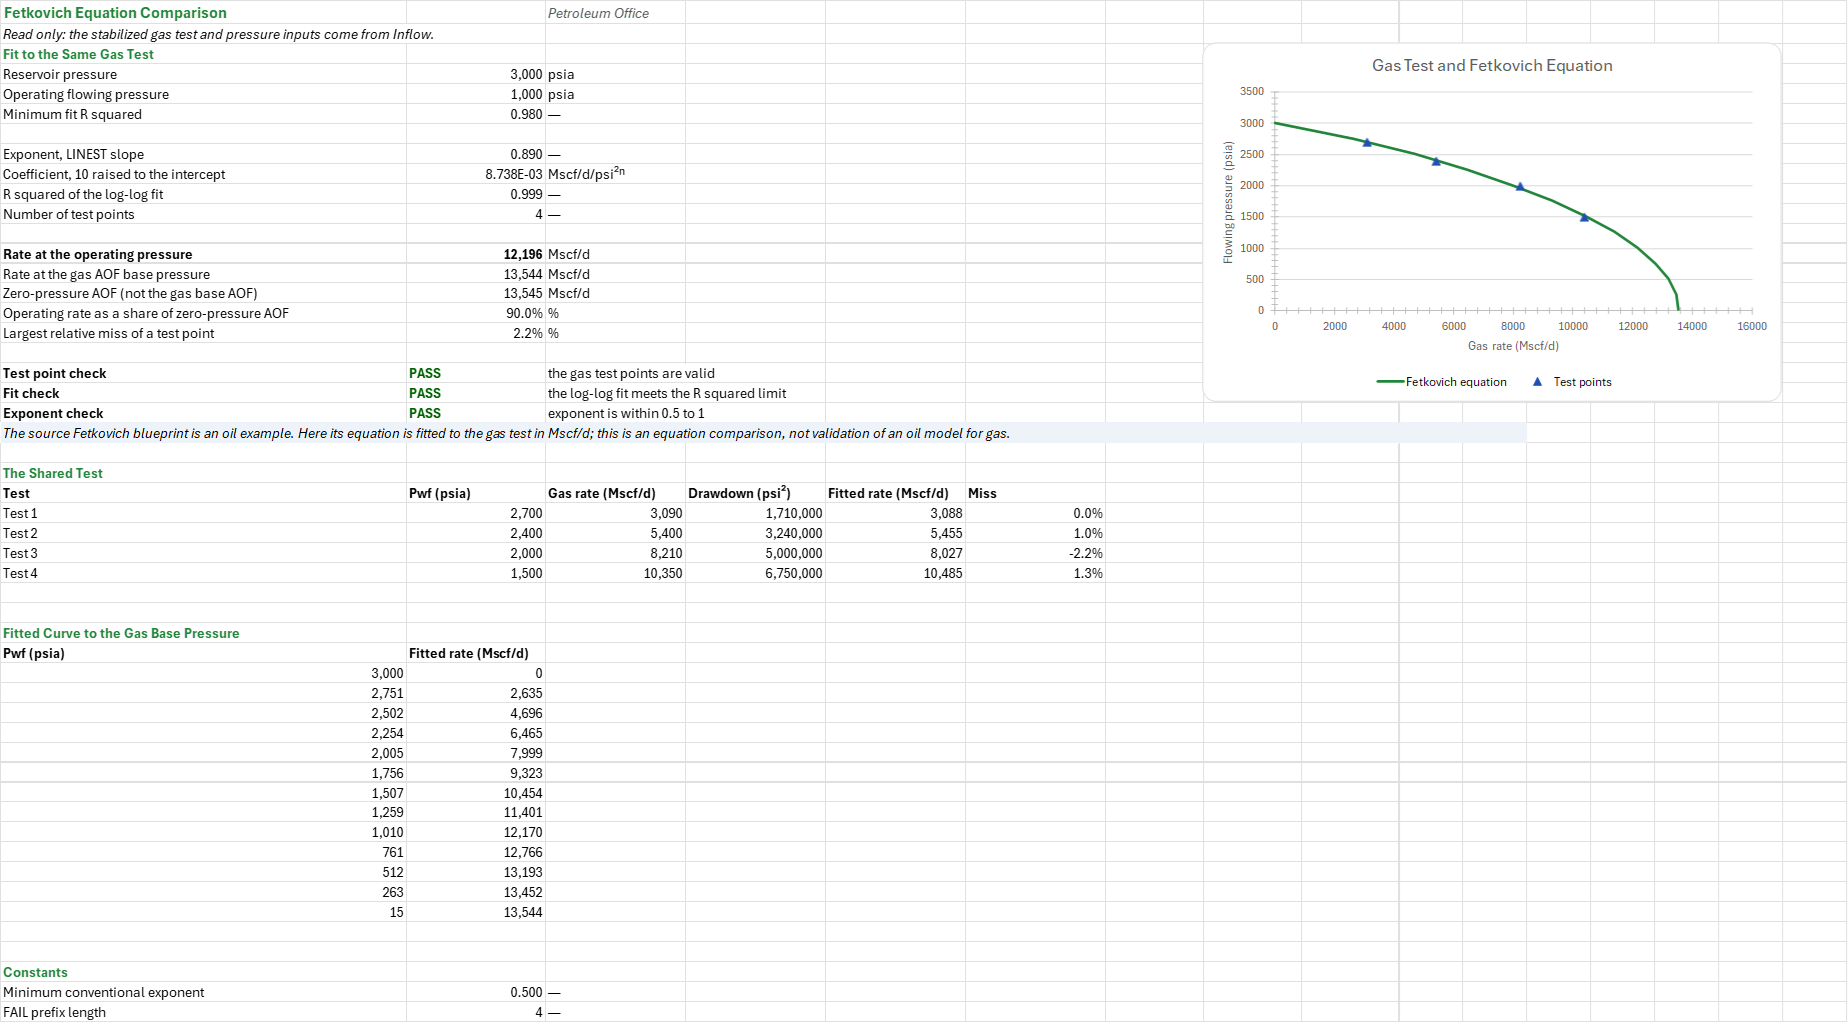
Method: Fit the four stabilized test points using pressure-squared backpressure and laminar-inertial-turbulent equations, and compare the Fetkovich equation at the same pressures. Calculate a two-pass single-phase gas tubing pressure and compare it with multiphase correlations at the gauge rate, then compare Turner, Coleman and Li critical rates along the tubing against a synthetic Arps decline.
Example: The gas reference well is at 3000 psia and 160 F, with gas gravity 0.7, 8 mD, 40 ft pay and skin 2. Its synthetic stabilized test is (2700, 3090), (2400, 5400), (2000, 8210), (1500, 10350) in psia and Mscf/d. The tubing is 7500 ft TVD, 2.441 in ID and 1200 psia at the wellhead.
Validity
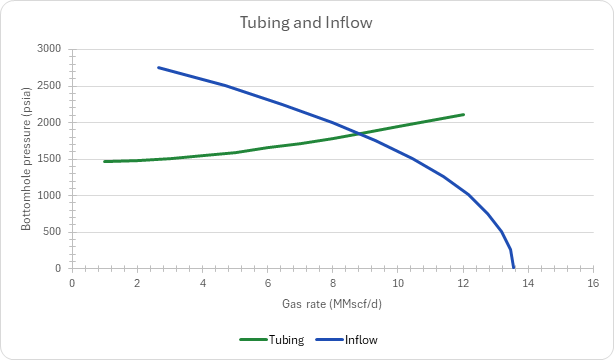
This is a stabilized flow-after-flow test, not an isochronal analysis. An isochronal test needs transient coefficients and an extended stabilized point. The Fetkovich equation normally describes oil: its reservoir and test data are overridden with the gas well's points and Mscf/d rates here, and its oil equations are numerical checks, not validation of a gas physical model. Its zero-pressure AOF is not the gas AOF at the 14.7 psia base; compare the rates at the same flowing pressure. The tubing chart is a comparison, not an operating-point solve. The loading decline is synthetic, holds wellhead pressure fixed and must be replaced by a history fit. Turner, Coleman and Li are empirical estimates, not proof of unloading.
References
- Fetkovich, M.J. (1973), The Isochronal Testing of Oil Wells, SPE 4529.
- Turner, R.G., Hubbard, M.G. and Dukler, A.E. (1969), Analysis and Prediction of Minimum Flow Rate for the Continuous Removal of Liquids from Gas Wells, JPT.
- Coleman, S.B. et al. (1991), A New Look at Predicting Gas-Well Load-Up, JPT.
Inputs
| Input | Unit | Default | Name |
|---|---|---|---|
| Reservoir pressure | psia | 3000 | GDI_Pr |
| Reservoir temperature | F | 160 | GDI_T |
| Gas specific gravity | — | 0.7 | GDI_SG |
| Permeability | mD | 8 | GDI_k |
| Net pay | ft | 40 | GDI_h |
| Perforated interval | ft | 20 | GDI_hp |
| Drainage radius | ft | 2980 | GDI_re |
| Wellbore radius | ft | 0.354 | GDI_rw |
| Skin | — | 2 | GDI_s |
| AOF base pressure | psia | 14.7 | GDI_Pbase |
| Operating flowing pressure | psia | 1000 | GDI_PwfOp |
| Minimum log-log fit R squared | — | 0.98 | GDI_R2Min |
| AOF comparison tolerance | fraction | 0.1 | GDI_AofTol |
| Four stabilized points: Pwf and rate | psia, Mscf/d | see the example | GDI_Pwf, GDI_Q |
| Tubing depth | ft | 7500 | GDT_TVD |
| Tubing inner diameter | in | 2.441 | GDT_ID |
| Relative roughness | — | 0.0006 | GDT_Rough |
| Wellhead pressure | psia | 1200 | GDT_Pwh |
| Wellhead temperature | F | 100 | GDT_Twh |
| Water-gas ratio | bbl/MMscf | 5 | GDT_WGR |
| Water density | lb/ft3 | 67 | GDT_RhoL |
| Water viscosity | cp | 0.5 | GDT_UL |
| Water surface tension | dyne/cm | 60 | GDT_IFT |
| Current gas rate | MMscf/d | 8.21 | GDT_Qg |
| Gauge test gas rate | MMscf/d | 8.21 | GDT_Qtest |
| Gauge pressure at the test rate | psia | 2000 | GDT_Pmeas |
| Turner adjustment | — | 1.2 | GDT_TurnerF |
| Gauge match tolerance | fraction | 0.05 | GDT_MatchTol |
| Synthetic nominal decline per year | 1/yr | 0.35 | GDL_Di |
| Synthetic Arps exponent | — | 0.5 | GDL_b |
| Lift lead time | years | 2 | GDL_Lead |
Sheets
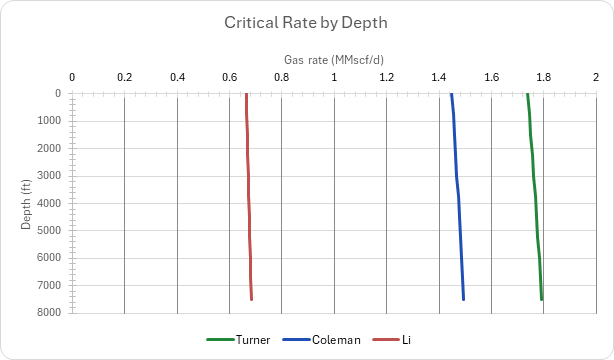
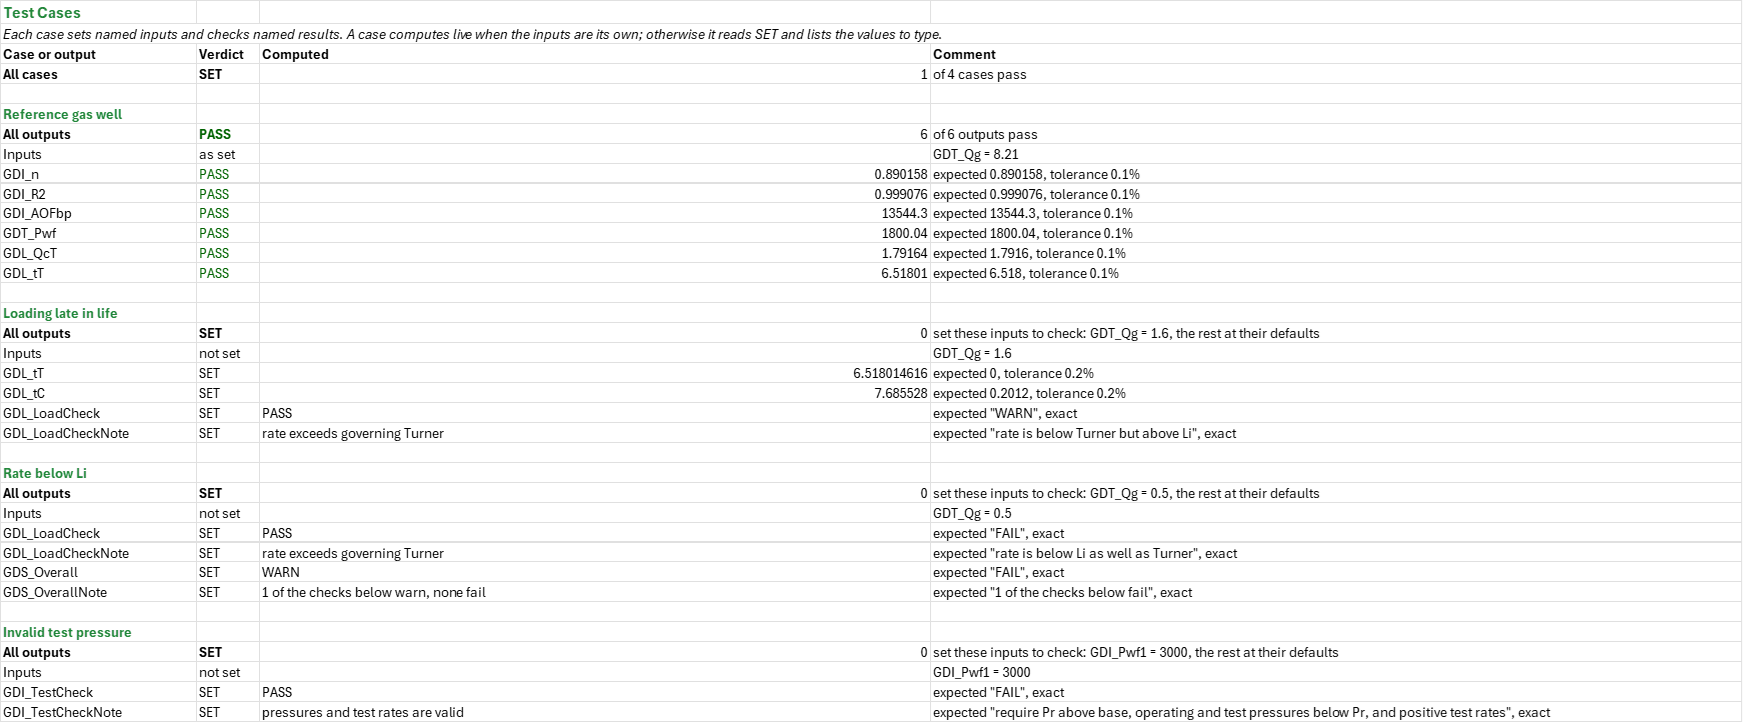
Guide— how to use the workbook, the test and its units, why the Fetkovich comparison is there, and the limitations.Inflow— the reservoir and completion, the four stabilized points, input validation and the calculation pressure, and the gas, rock and test fits by the backpressure and laminar-inertial-turbulent equations.Fetkovich— the Fetkovich equation fitted to the same gas test, read only from Inflow, with its fitted curve to the gas base pressure, charted against the test.Tubing— single-phase gas in two passes, the independent gauge test, a correlation comparison at the gauge rate, and the inflow and tubing curves charted together without an operating-point solve.Loading— the gas at the wellhead and the Turner, Coleman and Li critical rates, the profile at the wellhead Turner rate by depth, and the synthetic decline against the critical rates, charted.Summary— the inflow and matched equation, the tubing and loading results, and every check under one verdict.Test Cases— the worked example and other cases, with expected and computed results.
Four charts: the gas test and Fetkovich equation; tubing and inflow; critical rate by depth; decline against critical rates.
Functions used
Names (219)
| Name | Refers to | Comment |
|---|---|---|
PO.IPR.GW.Backpressure.FitLAMBDA |
=LAMBDA(d, q, d_at, output, IF((MIN(d)<=0)+(MIN(q)<=0)+(COUNT(q)<2)+(COUNT(d)<>COUNT(q)), NA(), LET(lx, LOG10(d), ly, LOG10(q), expn, SLOPE(ly, lx), coef, 10^INTERCEPT(ly, lx), IF(output="n", expn, IF(output="C", coef, IF(output="R2", RSQ(ly, lx), IF(output="q", IF(d_at<0, NA(), coef*d_at^expn), NA()))))))) |
Gas backpressure q = C*d^n fitted by least squares on log q vs log d, d = Pr^2 - Pwf^2 (psi2) or delta m(p). output "n", "C", "R2", or "q" the rate (Mscf/d) at the drawdown d_at. d and q: test columns, values > 0. |
PO.IPR.GW.LIT.FitLAMBDA |
=LAMBDA(d, q, d_at, output, IF((MIN(d)<=0)+(MIN(q)<=0)+(COUNT(q)<2)+(COUNT(d)<>COUNT(q)), NA(), LET(ratio, d/q, lam, INTERCEPT(ratio, q), turb, SLOPE(ratio, q), IF(output="a", lam, IF(output="b", turb, IF(output="R2", RSQ(ratio, q), IF(output="q", IF((d_at<0)+(turb<0)+(lam<=0), NA(), IF(turb=0, d_at/lam, (SQRT((lam/2)^2+turb*d_at)-lam/2)/turb)), NA()))))))) |
Gas LIT (Houpeurt) d = a*q + b*q^2 fitted by least squares on d/q vs q, d = Pr^2 - Pwf^2 (psi2) or delta m(p). output "a", "b", "R2", or "q" the rate (Mscf/d) at the drawdown d_at. d and q: test columns, values > 0. |
PO.PE.Loading.LiRateLAMBDA |
=LAMBDA(p_psia, t_degF, sg_gas, tubingID_in, sigma_dyncm, rhoL_lbft3, IF(OR(p_psia<=0, t_degF<=-459.67, sg_gas<=0, tubingID_in<=0, sigma_dyncm<=0, rhoL_lbft3<=0), NA(), LET(tr, t_degF+459.67, z, PO.PVT.Z.ByDAK(p_psia/PO.PVT.Ppc.BySutton(sg_gas), tr/PO.PVT.Tpc.BySutton(sg_gas)), rho_g, PO.PVT.Rho.Gas.ByDefinition(p_psia, tr, sg_gas, z)*62.428, IF(rhoL_lbft3<=rho_g, NA(), 3.06*p_psia*0.72907*sigma_dyncm^0.25*(rhoL_lbft3-rho_g)^0.25/rho_g^0.5*PI()*tubingID_in^2/576/(tr*z))))) |
Li critical gas rate to unload liquid (flat-droplet model), MMscf/d: p_psia and t_degF where it is read, gas gravity sg_gas, tubingID_in, the liquid's sigma_dyncm and rhoL_lbft3. Same order as PO.PE.Loading.TurnerRate. |
PO.PE.Loading.TurnerRateLAMBDA |
=LAMBDA(p, t, sg_g, tubing_id, sigma, rho_l, factor, IF(OR(p<=0, t<=-459.67, sg_g<=0, tubing_id<=0, sigma<=0, rho_l<=0, factor<=0), NA(), LET(tr, t+459.67, z, PO.PVT.Z.ByDAK(p/PO.PVT.Ppc.BySutton(sg_g), tr/PO.PVT.Tpc.BySutton(sg_g)), rho_g, PO.PVT.Rho.Gas.ByDefinition(p, tr, sg_g, z)*62.428, IF(rho_l<=rho_g, NA(), 3.06*p*factor*1.593*sigma^0.25*(rho_l-rho_g)^0.25/rho_g^0.5*PI()*tubing_id^2/576/(tr*z))))) |
Turner critical gas rate to unload liquid, MMscf/d: p (psia) and t (°F) where it is read, usually the wellhead, gas gravity sg_g, tubing_id (in), the liquid's sigma (dyne/cm) and rho_l (lb/ft³), and factor (1.2 Turner, 1 Coleman). |
PO.PVT.PseudoPLAMBDA |
=LAMBDA(p, t_r, sg_g, p_base, steps, IF((p<p_base)+(t_r<=0)+(sg_g<=0)+(steps<1)+(p_base/PO.PVT.Ppc.BySutton(sg_g)<0.01), NA(), LET(ppc, PO.PVT.Ppc.BySutton(sg_g), tpr, t_r/PO.PVT.Tpc.BySutton(sg_g), n, INT(steps), dp, (p-p_base)/n, f, MAP(p_base+dp*SEQUENCE(n+1, 1, 0), LAMBDA(x, LET(z, PO.PVT.Z.ByDAK(x/ppc, tpr), x/(PO.PVT.Ug.ByLGE(z, sg_g, x, t_r)*z)))), 2*dp*(SUM(f)-(INDEX(f, 1)+INDEX(f, n+1))/2)))) |
Real-gas pseudo-pressure m(p) = 2*integral of p/(ug*Z) dp from p_base to p (psi2/cp), trapezoid rule in steps; Z by DAK and ug by LGE at Sutton pseudo-criticals. p, p_base psia (p_base >= 7), t_r degR, sg_g air = 1. |
PO.VFP.Corr.MatchLAMBDA |
=LAMBDA(predicted, measured, row, LET(n, ROWS(predicted), m, COLUMNS(predicted), i, INT(row), ones, SEQUENCE(m, 1, 1, 0), num, --ISNUMBER(predicted), err, IFERROR(ABS(predicted-measured)/measured, 0), full, IF(m=1, num, MMULT(num, ones))=m, aare, IF(m=1, err, MMULT(err, ones))/m, k, COUNT(measured), valid, AND(IFERROR(ROWS(measured), 1)=1, OR(k=1, k=m), IFERROR(COLUMNS(measured), 1)=k, MIN(measured)>0), IF(OR(NOT(valid), i<0, i>n, row<>i), NA(), IF(i=0, MATCH(1, full*(aare=MIN(FILTER(aare, full, NA()))), 0), IF(SUM((SEQUENCE(n)=i)*full)=1, SUM((SEQUENCE(n)=i)*aare), NA()))))) |
Scores flow correlations against measured pressures: predicted has one row per correlation, measured one value or a row of m survey values. row = i gives row i's average absolute relative error (AARE); row = 0 the row with the least. |
GDF_AOF |
Fetkovich!$B$15 |
Zero-pressure AOF (not the gas base AOF), Mscf/d |
GDF_C |
Fetkovich!$B$9 |
Coefficient, 10 raised to the intercept, Mscf/d/psi²ⁿ |
GDF_Curve |
Fetkovich!$A$34:$B$46 |
Gas-test Fetkovich equation from reservoir to gas base pressure |
GDF_DP2 |
Fetkovich!$D$26:$D$29 |
Test pressure-squared drawdowns |
GDF_FailPrefixLength |
Fetkovich!$B$51 |
FAIL prefix length |
GDF_FitCheck |
Fetkovich!$B$20 |
Fit check verdict |
GDF_FitCheckNote |
Fetkovich!$C$20 |
Fit check comment |
GDF_MissMax |
Fetkovich!$B$17 |
Largest relative miss of a test point, % |
GDF_NTests |
Fetkovich!$B$11 |
Number of test points |
GDF_OpShare |
Fetkovich!$B$16 |
Operating rate as a share of zero-pressure AOF, % |
GDF_Pr |
Fetkovich!$B$4 |
Reservoir pressure, psia |
GDF_PwfOp |
Fetkovich!$B$5 |
Operating flowing pressure, psia |
GDF_Q |
Fetkovich!$C$26:$C$29 |
Stabilized gas test rates in Mscf/d |
GDF_R2 |
Fetkovich!$B$10 |
R squared of the log-log fit |
GDF_R2Min |
Fetkovich!$B$6 |
Minimum fit R squared |
GDF_Results |
Fetkovich!$B$4:$B$21 |
Gas-test Fetkovich fit, matched pressure readings and checks |
GDF_TestCheck |
Fetkovich!$B$19 |
Test point check verdict |
GDF_TestCheckNote |
Fetkovich!$C$19 |
Test point check comment |
GDF_Tests |
Fetkovich!$A$26:$F$29 |
Shared gas test and fitted Fetkovich rates |
GDF_n |
Fetkovich!$B$8 |
Exponent, LINEST slope |
GDF_nCheck |
Fetkovich!$B$21 |
Exponent check verdict |
GDF_nCheckNote |
Fetkovich!$C$21 |
Exponent check comment |
GDF_nMin |
Fetkovich!$B$50 |
Minimum conventional exponent |
GDF_qBase |
Fetkovich!$B$14 |
Rate at the gas AOF base pressure, Mscf/d |
GDF_qOp |
Fetkovich!$B$13 |
Rate at the operating pressure, Mscf/d |
GDI_AOFbp |
Inflow!$B$43 |
Backpressure AOF at base, Mscf/d |
GDI_AOFd |
Inflow!$B$33 |
Darcy AOF, Mscf/d |
GDI_AOFlm |
Inflow!$B$49 |
LIT m(p) AOF, Mscf/d |
GDI_AOFlp |
Inflow!$B$46 |
LIT p squared AOF, Mscf/d |
GDI_AOFm |
Inflow!$B$39 |
Rock AOF in m(p), Mscf/d |
GDI_AOFnd |
Inflow!$B$34 |
Non-Darcy AOF, Mscf/d |
GDI_AofCheck |
Inflow!$B$56 |
AOF comparison verdict |
GDI_AofCheckNote |
Inflow!$C$56 |
AOF comparison comment |
GDI_AofTol |
Inflow!$B$16 |
AOF comparison tolerance, % |
GDI_C |
Inflow!$B$41 |
Backpressure coefficient, Mscf/d/psi²ⁿ |
GDI_CalcBase |
Inflow!$B$21 |
Base used for calculation, psia |
GDI_CalcOp |
Inflow!$B$22 |
Operating pressure used for calculation, psia |
GDI_CalcPr |
Inflow!$B$20 |
Pressure used for calculation, psia |
GDI_D |
Inflow!$B$30 |
Non-Darcy coefficient, d/Mscf |
GDI_DM |
Inflow!$H$62:$H$65 |
Calculation pseudo-pressure drawdowns |
GDI_DP2 |
Inflow!$F$62:$F$65 |
Calculation pressure-squared drawdowns |
GDI_FitCheck |
Inflow!$B$55 |
Fit check verdict |
GDI_FitCheckNote |
Inflow!$C$55 |
Fit check comment |
GDI_FitPwf1 |
Inflow!$D$62 |
Calculation test pressure |
GDI_FitPwf2 |
Inflow!$D$63 |
Calculation test pressure |
GDI_FitPwf3 |
Inflow!$D$64 |
Calculation test pressure |
GDI_FitPwf4 |
Inflow!$D$65 |
Calculation test pressure |
GDI_FitQ |
Inflow!$E$62:$E$65 |
Calculation gas rates |
GDI_Fitq1 |
Inflow!$E$62 |
Calculation test rate |
GDI_Fitq2 |
Inflow!$E$63 |
Calculation test rate |
GDI_Fitq3 |
Inflow!$E$64 |
Calculation test rate |
GDI_Fitq4 |
Inflow!$E$65 |
Calculation test rate |
GDI_Inputs |
Inflow!$B$4:$B$16 |
Reservoir, gas, completion and fit limits |
GDI_Pbase |
Inflow!$B$13 |
AOF base pressure, psia |
GDI_PerfCheck |
Inflow!$B$54 |
Perforation check verdict |
GDI_PerfCheckNote |
Inflow!$C$54 |
Perforation check comment |
GDI_Ppr |
Inflow!$B$26 |
Pseudo-reduced pressure |
GDI_Pr |
Inflow!$B$4 |
Reservoir pressure, psia |
GDI_Pwf |
Inflow!$B$62:$B$65 |
Entered flowing pressures |
GDI_Pwf1 |
Inflow!$B$62 |
Entered test pressure |
GDI_Pwf2 |
Inflow!$B$63 |
Entered test pressure |
GDI_Pwf3 |
Inflow!$B$64 |
Entered test pressure |
GDI_Pwf4 |
Inflow!$B$65 |
Entered test pressure |
GDI_PwfOp |
Inflow!$B$14 |
Operating flowing pressure, psia |
GDI_Q |
Inflow!$C$62:$C$65 |
Entered gas rates |
GDI_R0 |
Inflow!$B$68 |
Rankine at zero Fahrenheit, °R |
GDI_R2 |
Inflow!$B$42 |
Backpressure R squared |
GDI_R2Min |
Inflow!$B$15 |
Minimum log-log fit R squared |
GDI_SG |
Inflow!$B$6 |
Gas specific gravity, air = 1 |
GDI_Steps |
Inflow!$B$69 |
Pseudo-pressure trapezoids |
GDI_T |
Inflow!$B$5 |
Reservoir temperature, °F |
GDI_TR |
Inflow!$B$25 |
Absolute temperature, °R |
GDI_TestCheck |
Inflow!$B$53 |
Pressure and test check verdict |
GDI_TestCheckNote |
Inflow!$C$53 |
Pressure and test check comment |
GDI_Tests |
Inflow!$A$62:$H$65 |
Entered and calculation test points |
GDI_Tpr |
Inflow!$B$27 |
Pseudo-reduced temperature |
GDI_Ug |
Inflow!$B$29 |
Gas viscosity at reservoir pressure, cp |
GDI_Valid |
Inflow!$B$19 |
Valid pressure and test points (1 yes) |
GDI_Z |
Inflow!$B$28 |
Z at reservoir pressure |
GDI_a2 |
Inflow!$B$35 |
Rock laminar coefficient p squared, psi²/(Mscf/d) |
GDI_aM |
Inflow!$B$37 |
Rock laminar coefficient m(p), psi²/cp/(Mscf/d) |
GDI_b2 |
Inflow!$B$36 |
Rock turbulent coefficient p squared, psi²/(Mscf/d)² |
GDI_bM |
Inflow!$B$38 |
Rock turbulent coefficient m(p), psi²/cp/(Mscf/d)² |
GDI_h |
Inflow!$B$8 |
Net pay, ft |
GDI_hp |
Inflow!$B$9 |
Perforated interval, ft |
GDI_k |
Inflow!$B$7 |
Permeability, mD |
GDI_la |
Inflow!$B$44 |
LIT p squared laminar coefficient, psi²/(Mscf/d) |
GDI_lb |
Inflow!$B$45 |
LIT p squared turbulent coefficient, psi²/(Mscf/d)² |
GDI_mOp |
Inflow!$B$32 |
Pseudo-pressure at operating pressure, psi²/cp |
GDI_mPr |
Inflow!$B$31 |
Pseudo-pressure at reservoir, psi²/cp |
GDI_ma |
Inflow!$B$47 |
LIT m(p) laminar coefficient, psi²/cp/(Mscf/d) |
GDI_mb |
Inflow!$B$48 |
LIT m(p) turbulent coefficient, psi²/cp/(Mscf/d)² |
GDI_n |
Inflow!$B$40 |
Backpressure exponent |
GDI_q1 |
Inflow!$C$62 |
Entered test rate |
GDI_q2 |
Inflow!$C$63 |
Entered test rate |
GDI_q3 |
Inflow!$C$64 |
Entered test rate |
GDI_q4 |
Inflow!$C$65 |
Entered test rate |
GDI_qBP |
Inflow!$B$51 |
Backpressure operating rate, Mscf/d |
GDI_qOp |
Inflow!$B$50 |
LIT m(p) operating rate, Mscf/d |
GDI_re |
Inflow!$B$10 |
Drainage radius, ft |
GDI_rw |
Inflow!$B$11 |
Wellbore radius, ft |
GDI_s |
Inflow!$B$12 |
Skin |
GDL_DaysYr |
Loading!$B$96 |
Days in a year, d/yr |
GDL_Decline |
Loading!$A$71:$E$91 |
Twenty years of decline against critical rates |
GDL_Di |
Loading!$B$15 |
Synthetic nominal decline per year, 1/yr |
GDL_GpT |
Loading!$B$42 |
Gas produced before Turner, Bscf |
GDL_ID |
Loading!$B$6 |
Tubing inner diameter, in |
GDL_IFT |
Loading!$B$12 |
Water surface tension, dyne/cm |
GDL_Inputs |
Loading!$B$15:$B$17 |
Synthetic decline and lead time |
GDL_Lead |
Loading!$B$17 |
Lift lead time, years |
GDL_LeadCheck |
Loading!$B$45 |
Lead time verdict |
GDL_LeadCheckNote |
Loading!$C$45 |
Lead time comment |
GDL_LoadCheck |
Loading!$B$44 |
Loading verdict |
GDL_LoadCheckNote |
Loading!$C$44 |
Loading comment |
GDL_MMB |
Loading!$B$97 |
MMscf per Bscf, MMscf/Bscf |
GDL_PassCheck |
Loading!$B$46 |
Profile second pass verdict |
GDL_PassCheckNote |
Loading!$C$46 |
Profile second pass comment |
GDL_PassErr |
Loading!$B$35 |
Second pass difference, % |
GDL_PassTol |
Loading!$B$98 |
Second pass tolerance, % |
GDL_Pbh |
Loading!$B$27 |
Bottomhole pressure at wellhead Turner rate, psia |
GDL_PbhGov |
Loading!$B$33 |
Bottomhole pressure at governing Turner rate, psia |
GDL_Ppc |
Loading!$B$20 |
Pseudo-critical pressure, psia |
GDL_Profile |
Loading!$A$57:$G$67 |
Critical rates at eleven depths |
GDL_Pwh |
Loading!$B$8 |
Wellhead pressure, psia |
GDL_QRatio |
Loading!$B$38 |
Rate over governing Turner |
GDL_QcBh2 |
Loading!$B$34 |
Turner rate at that bottomhole pressure, MMscf/d |
GDL_QcC |
Loading!$B$31 |
Largest Coleman rate, MMscf/d |
GDL_QcLi |
Loading!$B$32 |
Largest Li rate, MMscf/d |
GDL_QcT |
Loading!$B$28 |
Largest Turner rate down tubing, MMscf/d |
GDL_QcWh |
Loading!$B$24 |
Turner at wellhead, MMscf/d |
GDL_QcWhC |
Loading!$B$25 |
Coleman at wellhead, MMscf/d |
GDL_QcWhLi |
Loading!$B$26 |
Li at wellhead, MMscf/d |
GDL_Qg |
Loading!$B$13 |
Current gas rate, MMscf/d |
GDL_R0 |
Loading!$B$94 |
Rankine at zero Fahrenheit, °R |
GDL_RhoL |
Loading!$B$11 |
Water density, lb/ft³ |
GDL_Rough |
Loading!$B$7 |
Relative roughness |
GDL_SGg |
Loading!$B$4 |
Gas gravity, air = 1 |
GDL_TVD |
Loading!$B$5 |
Tubing depth, ft |
GDL_Tbh |
Loading!$B$10 |
Bottomhole temperature, °F |
GDL_Tpc |
Loading!$B$21 |
Pseudo-critical temperature, °R |
GDL_TurnerF |
Loading!$B$14 |
Turner adjustment |
GDL_Twh |
Loading!$B$9 |
Wellhead temperature, °F |
GDL_Ugwh |
Loading!$B$23 |
Wellhead viscosity, cp |
GDL_Vert |
Loading!$B$95 |
Vertical inclination, ° |
GDL_Where |
Loading!$B$30 |
Governing location |
GDL_ZGov |
Loading!$B$29 |
Governing depth, ft |
GDL_Zwh |
Loading!$B$22 |
Wellhead Z |
GDL_b |
Loading!$B$16 |
Synthetic Arps exponent |
GDL_tC |
Loading!$B$40 |
Years to Coleman, years |
GDL_tLi |
Loading!$B$41 |
Years to Li, years |
GDL_tT |
Loading!$B$39 |
Years to Turner, years |
GDS_AOF |
Summary!$B$9 |
Backpressure AOF at the base, Mscf/d |
GDS_Best |
Summary!$B$16 |
Best gauge correlation |
GDS_Checks |
Summary!$B$24:$B$35 |
All checks |
GDS_FetBase |
Summary!$B$12 |
Fetkovich equation rate at gas base, Mscf/d |
GDS_FetOp |
Summary!$B$11 |
Fetkovich equation rate at operating pressure, Mscf/d |
GDS_Overall |
Summary!$B$4 |
Readiness verdict |
GDS_OverallNote |
Summary!$C$4 |
Readiness comment |
GDS_Pwf |
Summary!$B$15 |
Tubing bottomhole pressure at current rate, psia |
GDS_QcT |
Summary!$B$17 |
Governing Turner critical rate, MMscf/d |
GDS_R2 |
Summary!$B$8 |
Backpressure R squared |
GDS_Results |
Summary!$B$7:$B$20 |
Inflow, matched equation, tubing and loading headlines |
GDS_Verdict |
Summary!$B$4 |
Overall verdict |
GDS_VerdictNote |
Summary!$C$4 |
Overall comment |
GDS_n |
Summary!$B$7 |
Backpressure exponent |
GDS_qOp |
Summary!$B$10 |
LIT m(p) operating rate, Mscf/d |
GDS_tC |
Summary!$B$19 |
Years to Coleman loading, years |
GDS_tLi |
Summary!$B$20 |
Years to Li loading, years |
GDS_tT |
Summary!$B$18 |
Years to Turner loading, years |
GDT_Best |
Tubing!$B$40 |
Best correlation |
GDT_BestErr |
Tubing!$B$42 |
Best relative error, % |
GDT_BestPwf |
Tubing!$B$41 |
Best bottomhole pressure, psia |
GDT_BestRow |
Tubing!$B$39 |
Best correlation row |
GDT_Compare |
Tubing!$A$53:$B$56 |
Four correlations against the independent gauge test |
GDT_Curve |
Tubing!$A$61:$D$72 |
Tubing and backpressure inflow curves; no solved crossing |
GDT_ID |
Tubing!$B$6 |
Tubing inner diameter, in |
GDT_IFT |
Tubing!$B$14 |
Water surface tension, dyne/cm |
GDT_Inputs |
Tubing!$B$5:$B$19 |
Completion, liquid, current rate, independent gauge test and check limits |
GDT_MatchCheck |
Tubing!$B$45 |
Gauge match verdict |
GDT_MatchCheckNote |
Tubing!$C$45 |
Gauge match comment |
GDT_MatchTol |
Tubing!$B$19 |
Gauge match tolerance, % |
GDT_Pm |
Tubing!$B$28 |
First-pass mean pressure, psia |
GDT_Pmeas |
Tubing!$B$16 |
Gauge pressure at the test rate, psia |
GDT_Ppc |
Tubing!$B$23 |
Pseudo-critical pressure, psia |
GDT_Pwf |
Tubing!$B$31 |
Bottomhole pressure at current rate, psia |
GDT_Pwf1 |
Tubing!$B$27 |
First-pass bottomhole pressure, psia |
GDT_Pwh |
Tubing!$B$8 |
Wellhead pressure, psia |
GDT_PwhBack |
Tubing!$B$32 |
Pressure back to wellhead, psia |
GDT_QL |
Tubing!$B$38 |
Gauge test water rate, STB/d |
GDT_QRatio |
Tubing!$B$35 |
Rate over Turner critical rate |
GDT_Qc |
Tubing!$B$34 |
Turner wellhead critical rate, MMscf/d |
GDT_Qg |
Tubing!$B$15 |
Current gas rate, MMscf/d |
GDT_Qtest |
Tubing!$B$17 |
Gauge test gas rate, MMscf/d |
GDT_R0 |
Tubing!$B$75 |
Rankine at zero Fahrenheit, °R |
GDT_RateCheck |
Tubing!$B$44 |
Current rate verdict |
GDT_RateCheckNote |
Tubing!$C$44 |
Current rate comment |
GDT_Re |
Tubing!$B$33 |
Reynolds number |
GDT_RhoL |
Tubing!$B$12 |
Water density, lb/ft³ |
GDT_Rough |
Tubing!$B$7 |
Relative roughness |
GDT_SGg |
Tubing!$B$4 |
Gas gravity, air = 1 |
GDT_TVD |
Tubing!$B$5 |
Tubing depth, ft |
GDT_Tbh |
Tubing!$B$10 |
Bottomhole temperature, °F |
GDT_Tm |
Tubing!$B$22 |
Mean tubing temperature, °F |
GDT_Tpc |
Tubing!$B$24 |
Pseudo-critical temperature, °R |
GDT_TurnerF |
Tubing!$B$18 |
Turner adjustment |
GDT_Twh |
Tubing!$B$9 |
Wellhead temperature, °F |
GDT_UL |
Tubing!$B$13 |
Water viscosity, cp |
GDT_Ugm |
Tubing!$B$30 |
Mean gas viscosity, cp |
GDT_Ugwh |
Tubing!$B$26 |
Wellhead gas viscosity, cp |
GDT_Vert |
Tubing!$B$76 |
Vertical inclination, ° |
GDT_WGR |
Tubing!$B$11 |
Water-gas ratio, bbl/MMscf |
GDT_Zm |
Tubing!$B$29 |
Mean Z |
GDT_Zwh |
Tubing!$B$25 |
Wellhead Z |
Details
| Opens in | Needs the Petroleum Office add-in: its PO functions show #NAME? without it once Excel recalculates. Needs Microsoft 365 or Excel 2024: it uses functions Excel 2016 doesn't have, such as named LAMBDAs, which show #NAME? there. |
| File | GasWellDeliverability.xlsx, 64 KB |
| Category | Production |
| For agents and tools | Descriptor (.md) |