Pipeline Design and Route Integrity
Description
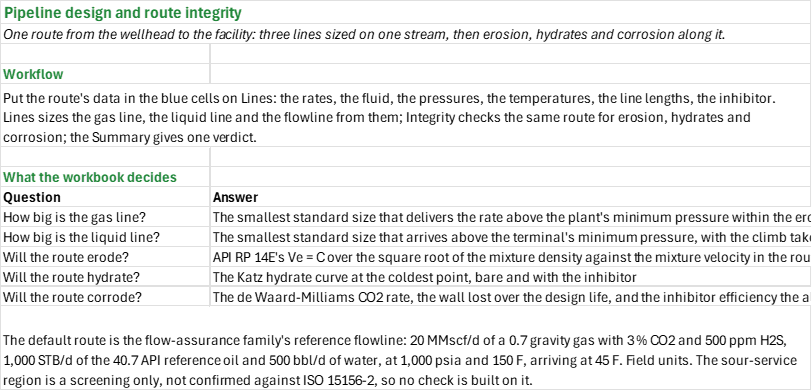
What size must the lines from the wellhead to the facility be, and will the route hold? You enter one stream's rates and fluid, the pressures and temperatures along the route, the line lengths and profile, the design basis and the inhibitor. You read off the gas line, liquid line and multiphase flowline sizes with their arrival pressures, and, for the chosen bore, the erosional velocity ratio (API RP 14E), the hydrate margin at the coldest point (Katz curve) and the CO2 corrosion against the allowance.
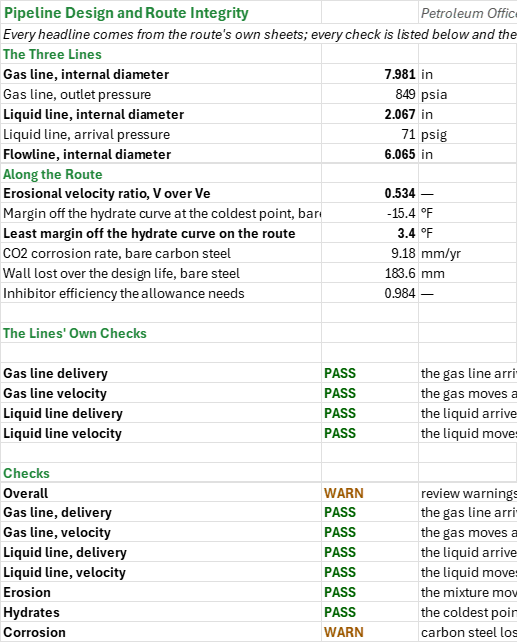
How to use it: Put the route's data in the blue cells on the Lines sheet: the metered rates, the gas and water analyses, the line's as-built lengths, ground and seabed temperatures, the inlet and delivery pressures, the inhibitor concentration and the design life. Lines sizes the three lines from them and chains the flowline's pressure along the route profile; edit the segment lengths and rises to match the route. Read erosion, hydrates and corrosion along the same route on the Integrity sheet, and every headline and check on the Summary.
Method: The gas line is the smallest standard-weight size whose outlet pressure, by the design equation (Weymouth by default, or Panhandle A or B), stays above the plant's minimum delivery pressure and whose outlet velocity stays under API RP 14E's erosional velocity; the line's Z is the DAK value at the average pressure, two thirds of the inlet and minimum, on Standing pseudo-criticals corrected by Wichert-Aziz. The liquid line is the smallest standard-weight size that arrives above the terminal's minimum pressure, with the climb taken off and the velocity inside its limits. The flowline carries the bore entered and its arrival pressure from Beggs and Brill chained segment by segment over the route profile. The route's erosion is API RP 14E's rule on the multiphase line: the no-slip mixture density, the C factor for the service, the erosional velocity C over the square root of the density, and the mixture velocity in the route's bore. The route's hydrates are the Katz curve fitted by Towler-Mokhatab: the hydrate temperature at the arrival pressure against the arrival temperature, the bare margin, and the margin with the methanol's depression (Hammerschmidt to 20 wt %, Nielsen-Bucklin above), taken as the least margin over the flowing and the shut-in cases. The route's corrosion is the de Waard-Milliams CO2 rate of bare carbon steel at the line's pressure, CO2 and water pH, the wall lost over the design life, and the inhibitor efficiency the allowance needs.
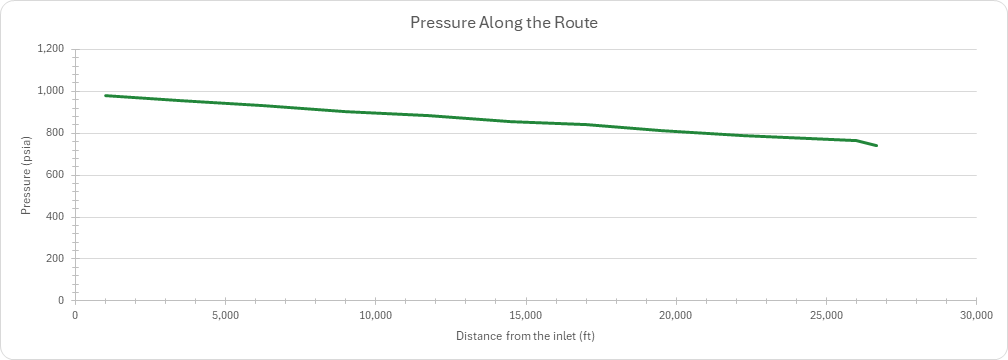
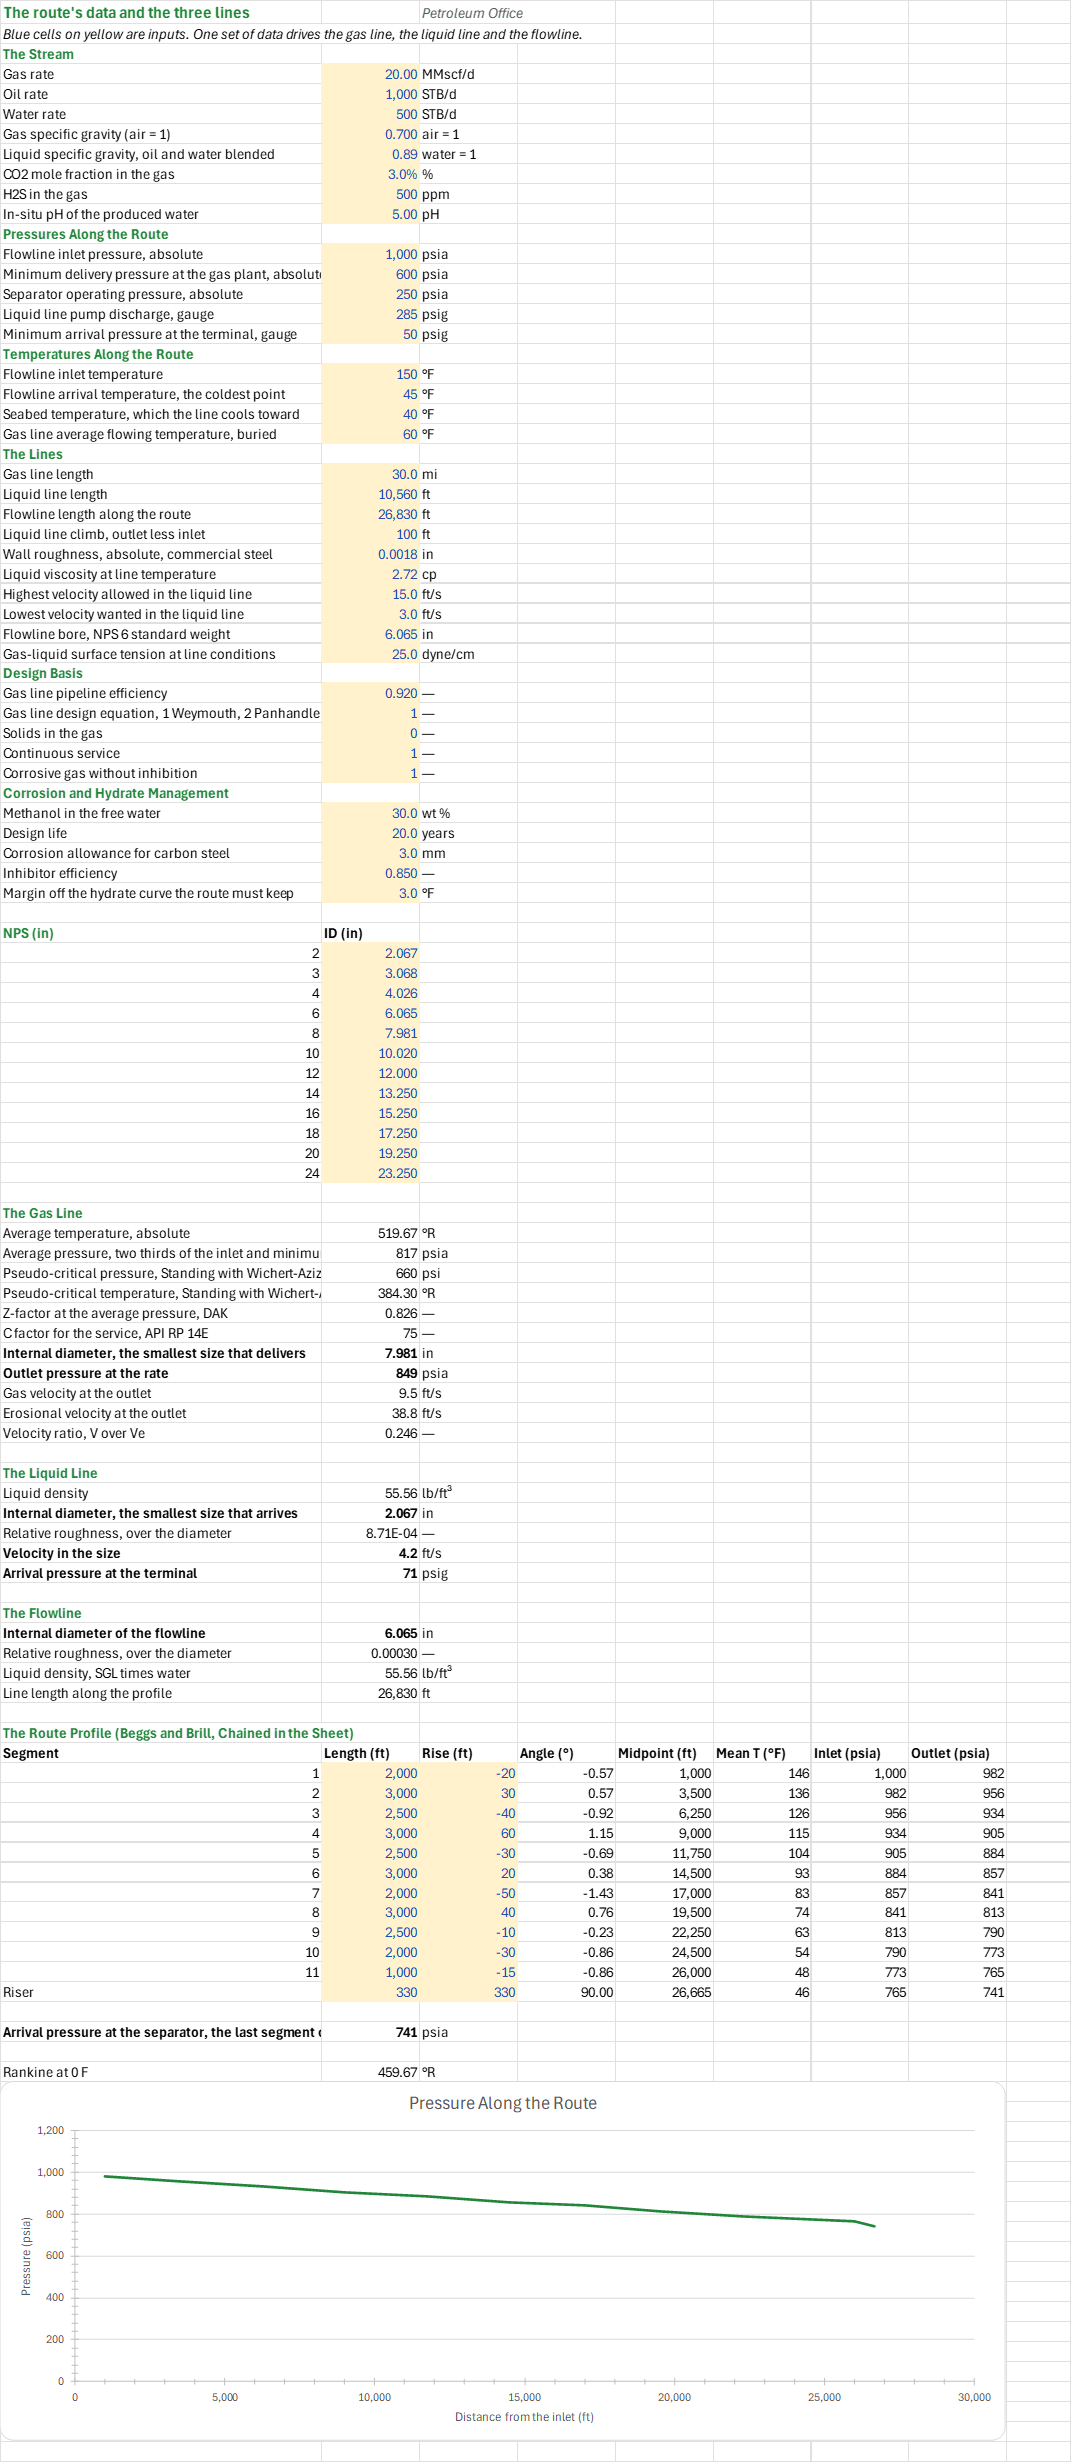
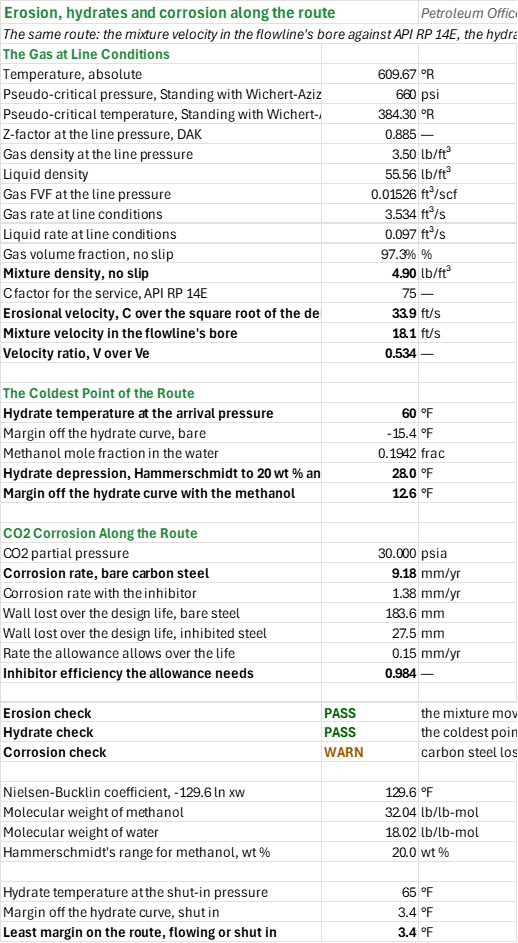
Example: The default stream is the flow-assurance family's reference flowline: 20 MMscf/d of a 0.7 gravity gas with 3 % CO2 and 500 ppm H2S, 1,000 STB/d of the 40.7 API reference oil and 500 bbl/d of water, at 1,000 psia and 150 F, arriving at 45 F. The gas line comes out at NPS 8, 7.981 in, delivering 849 psia against the 600 psia plant minimum, at 9.5 ft/s against an erosional 38.8 ft/s. The liquid line comes out at 2.067 in, arriving at 71 psig against the 50 psig minimum at 4.2 ft/s. The multiphase flowline is NPS 6, 6.065 in; Beggs and Brill over the route profile arrives at 740.7 psia. On the route the mixture moves at 0.53 of its erosional velocity, so erosion is not a problem. The coldest point is the 45 F arrival, where the hydrate temperature is 60.4 F: the bare line is 15.4 F inside the hydrate curve, and with 30 wt % methanol it keeps 3.4 F of margin, just over the 3 F wanted. Corrosion is the one warning: at 30 psia of CO2 the bare steel loses 9.18 mm a year, 183.6 mm over the 20 year life against the 3 mm allowance, so it needs inhibition at 98.4 % efficiency, above the 85 % set, or a corrosion-resistant alloy. The route holds on erosion and hydrates; the carbon steel does not fit the corrosion allowance.
Validity
The gas design equations are steady, isothermal and horizontal, with one Z for the line: elevation, the temperature profile and line pack are left out. The hydrates assume the Katz fit's range of gas gravity and that the line cools toward the seabed. The corrosion rate is the unprotected de Waard-Milliams rate, an upper bound above 140 F where iron carbonate scale can form, and the water pH is an in-situ measurement, not a surface one. The sour-service region is a screening only: the ISO 15156-2 boundary at pH 5.0 and 0.5 psia H2S is not yet verified, so the region is stated and no check is built on it. The line's own schedule of internal diameters, its detailed profile and its bathymetry are outside what this workbook models; a real route needs a hydraulic and a thermal simulator, not a sizing sheet.
References
- API RP 14E (1991). Recommended Practice for Design and Installation of Offshore Production Platform Piping Systems, section 2.5.
- Hammerschmidt, E.G. (1934). Formation of Gas Hydrates in Natural Gas Transmission Lines. Ind. Eng. Chem. 26(8), 851-855.
- Katz, D.L. (1940), the gas-gravity hydrate chart.
- Beggs, H.D. and Brill, J.P. (1973). A Study of Two-Phase Flow in Inclined Pipes. JPT 25(5), 607-617.
- de Waard, C. and Milliams, D.E. (1975). Carbonic Acid Corrosion of Steel. Corrosion 31(5), 177-181.
- Towler, G.J. and Mokhatab, S. (2001), the fit to the Katz hydrate curve.
- GPSA (2012). Engineering Data Book, 13th ed., section 17.
- ISO 15156-2, Petroleum and natural gas industries — Materials for use in H2S-containing environments in oil and gas production — Part 2.
Inputs
| Input | Unit | Default | Name |
|---|---|---|---|
| Gas rate | MMscf/d | 20 | PDS_Qg |
| Oil rate | STB/d | 1,000 | PDS_Qo |
| Water rate | bbl/d | 500 | PDS_Qw |
| Gas specific gravity (air = 1) | — | 0.7 | PDS_SG |
| Liquid specific gravity, oil and water blended | — | 0.89 | PDS_SGL |
| CO2 mole fraction in the gas | % | 3 | PDS_CO2 |
| H2S in the gas | ppm | 500 | PDS_H2S |
| In-situ pH of the produced water | — | 5.0 | PDS_Ph |
| Flowline inlet pressure, absolute | psia | 1,000 | PDS_Pin |
| Minimum delivery pressure at the gas plant, absolute | psia | 600 | PDS_Pmin |
| Separator operating pressure, absolute | psia | 250 | PDS_Psep |
| Liquid line pump discharge, gauge | psig | 285 | PDS_PLiq |
| Minimum arrival pressure at the terminal, gauge | psig | 50 | PDS_PLiqMin |
| Flowline inlet temperature | F | 150 | PDS_Tin |
| Flowline arrival temperature, the coldest point | F | 45 | PDS_Tout |
| Seabed temperature, which the line cools toward | F | 40 | PDS_Tsea |
| Gas line average flowing temperature, buried | F | 60 | PDS_Tgas |
| Gas line length | mi | 30 | PDS_Lgas |
| Liquid line length | ft | 10,560 | PDS_Lliq |
| Flowline length along the route | ft | 26,830 | PDS_Lflow |
| Liquid line climb, outlet less inlet | ft | 100 | PDS_dH |
| Wall roughness, absolute, commercial steel | ft | 0.0018 | PDS_Eps |
| Liquid viscosity at line temperature | cP | 2.72 | PDS_Mu |
| Highest velocity allowed in the liquid line | ft/s | 15 | PDS_Vmax |
| Lowest velocity wanted in the liquid line | ft/s | 3 | PDS_Vmin |
| Flowline bore, NPS 6 standard weight | in | 6.065 | PDS_MflBore |
| Gas-liquid surface tension at line conditions | dyne/cm | 25 | PDS_IFT |
| Gas line pipeline efficiency | — | 0.92 | PDS_E |
| Gas line design equation, 1 Weymouth, 2 Panhandle A, 3 Panhandle B | — | 1 | PDS_Eq |
| Solids in the gas | — | 0 | PDS_Sand |
| Continuous service | — | 1 | PDS_Cont |
| Corrosive gas without inhibition | — | 1 | PDS_Corr |
| Methanol in the free water | wt % | 30 | PDS_MeOH |
| Design life | y | 20 | PDS_Life |
| Corrosion allowance for carbon steel | mm | 3 | PDS_CAmax |
| Inhibitor efficiency | % | 85 | PDS_Eff |
| Margin off the hydrate curve the route must keep | F | 3 | PDS_Margin |
Sheets
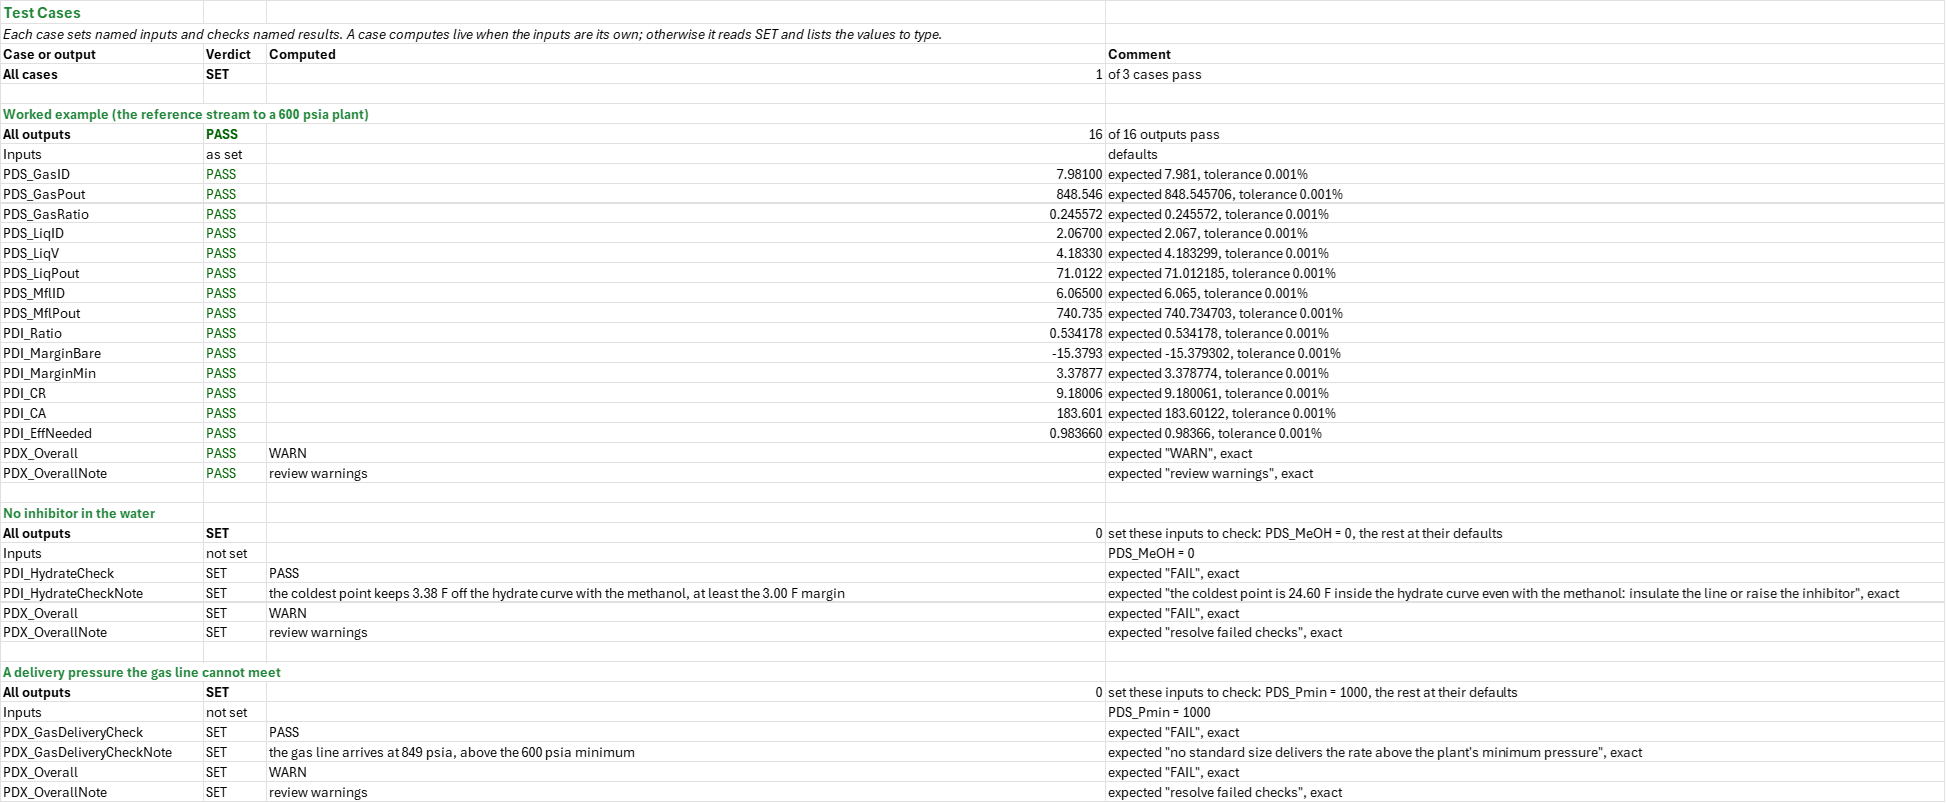
Guide— what the workbook decides, the order to work through it and the default route.Lines— the route's single block of inputs; the standard sizes swept from NPS 2 to 24; the gas line's average conditions, smallest delivering size, outlet pressure and velocities; the liquid line's smallest arriving size, velocity and arrival pressure; the flowline bore; and the route profile with Beggs and Brill chained segment by segment, with a chart of pressure along the route.Integrity— the gas at line conditions, the no-slip mixture density and the erosional velocity ratio; the hydrate temperature at the coldest point, the bare margin, the margin with methanol and the shut-in case; the CO2 partial pressure, bare and inhibited corrosion rates, wall lost over the life and the inhibitor efficiency the allowance needs.Summary— the three lines, the erosion, hydrate and corrosion headlines, and every check under one verdict.Test Cases— the worked example and other cases, with expected and computed results.
Functions used
Names (143)
| Name | Refers to | Comment |
|---|---|---|
PO.SF.PL.Gas.SizeLAMBDA |
=LAMBDA(qg, p_in, p_min, length, sg, t, z, eff, cf, method, ids, IF(OR(qg<=0, p_min<=0, p_in<=p_min, length<=0, sg<=0, z<=0, eff<=0, eff>1, cf<=0, AND(method<>1, method<>2, method<>3)), NA(), LET(ok, MAP(ids, LAMBDA(x, LET(pout, IFERROR(IF(method=1, PO.SF.PL.Gas.Weymouth.Pout(qg, p_in, x, length, sg, t, z, eff), IF(method=2, PO.SF.PL.Gas.PanhandleA.Pout(qg, p_in, x, length, sg, t, z, eff), PO.SF.PL.Gas.PanhandleB.Pout(qg, p_in, x, length, sg, t, z, eff))), 0), IF(pout<p_min, 0, IF(PO.SF.PL.Gas.Vel(qg, x, pout, t, z)<=PO.FA.Erosion.Ve(PO.SF.PL.Gas.Rho(pout, t, sg, z), cf), 1, 0))))), k, IFERROR(XMATCH(1, ok), 0), IF(k=0, NA(), INDEX(ids, k))))) |
Smallest pipe ID (in) from ids, ascending, whose outlet pressure by Weymouth (1), Panhandle A (2) or B (3) meets p_min (psia) and whose outlet velocity stays below API RP 14E's C/sqrt(rho); #N/A if none. |
PO.SF.PL.Liq.SizeLAMBDA |
=LAMBDA(ql, rho, mu, length, eps, dh, p_in, p_min, v_max, ids, IF(OR(ql<=0, rho<=0, mu<=0, length<=0, eps<0, p_in<=0, p_min<0, v_max<=0), NA(), LET(ok, MAP(ids, LAMBDA(x, IF(PO.SF.PL.Liq.Vel(ql, x)>v_max, 0, IF(IFERROR(PO.SF.PL.Liq.Pout(p_in, ql, rho, mu, x, length, eps/x, dh), p_min-1)>=p_min, 1, 0)))), k, IFERROR(XMATCH(1, ok), 0), IF(k=0, NA(), INDEX(ids, k))))) |
Smallest pipe ID (in) from ids, ascending, whose velocity is at most v_max (ft/s) and whose Darcy-Weisbach outlet pressure with the elevation change dh (ft) meets p_min (psi); eps is absolute roughness (in). #N/A if none. |
PDI_Bg |
Integrity!$B$10 |
Gas FVF at the line pressure, ft³/scf |
PDI_C |
Integrity!$B$15 |
C factor for the service, API RP 14E |
PDI_CA |
Integrity!$B$31 |
Wall lost over the design life, bare steel, mm |
PDI_CAInh |
Integrity!$B$32 |
Wall lost over the design life, inhibited steel, mm |
PDI_CR |
Integrity!$B$29 |
Corrosion rate, bare carbon steel, mm/yr |
PDI_CRAllowed |
Integrity!$B$33 |
Rate the allowance allows over the life, mm/yr |
PDI_CRInh |
Integrity!$B$30 |
Corrosion rate with the inhibitor, mm/yr |
PDI_Checks |
Integrity!$B$36:$B$38 |
The erosion check, the hydrate check and the corrosion check |
PDI_CorrosionCheck |
Integrity!$B$38 |
Corrosion check verdict |
PDI_CorrosionCheckNote |
Integrity!$C$38 |
Corrosion check comment |
PDI_EffNeeded |
Integrity!$B$34 |
Inhibitor efficiency the allowance needs |
PDI_ErosionCheck |
Integrity!$B$36 |
Erosion check verdict |
PDI_ErosionCheckNote |
Integrity!$C$36 |
Erosion check comment |
PDI_HamMax |
Integrity!$B$43 |
Hammerschmidt's range for methanol, wt %, wt % |
PDI_HydrateCheck |
Integrity!$B$37 |
Hydrate check verdict |
PDI_HydrateCheckNote |
Integrity!$C$37 |
Hydrate check comment |
PDI_Lambda |
Integrity!$B$13 |
Gas volume fraction, no slip, % |
PDI_MarginBare |
Integrity!$B$22 |
Margin off the hydrate curve, bare, °F |
PDI_MarginInh |
Integrity!$B$25 |
Margin off the hydrate curve with the methanol, °F |
PDI_MarginMin |
Integrity!$B$47 |
Least margin on the route, flowing or shut in, °F |
PDI_MarginShut |
Integrity!$B$46 |
Margin off the hydrate curve, shut in, °F |
PDI_MwMeOH |
Integrity!$B$41 |
Molecular weight of methanol, lb/lb-mol |
PDI_MwW |
Integrity!$B$42 |
Molecular weight of water, lb/lb-mol |
PDI_NB |
Integrity!$B$40 |
Nielsen-Bucklin coefficient, -129.6 ln xw, °F |
PDI_PpCO2 |
Integrity!$B$28 |
CO2 partial pressure, psia |
PDI_Ppc |
Integrity!$B$5 |
Pseudo-critical pressure, Standing with Wichert-Aziz, psi |
PDI_QLIs |
Integrity!$B$12 |
Liquid rate at line conditions, ft³/s |
PDI_QgIs |
Integrity!$B$11 |
Gas rate at line conditions, ft³/s |
PDI_Ratio |
Integrity!$B$18 |
Velocity ratio, V over Ve |
PDI_Results |
Integrity!$B$4:$B$18 |
The gas at line conditions, the in-situ rates, the mixture density and the erosional velocity |
PDI_Results2 |
Integrity!$B$21:$B$25 |
The hydrate temperature at the coldest point, the bare margin and the margin with the methanol |
PDI_Results3 |
Integrity!$B$28:$B$34 |
The CO2 partial pressure, the bare and inhibited rates, the wall lost and the efficiency the allowance needs |
PDI_Results4 |
Integrity!$B$45:$B$47 |
The shut-in hydrate point and the least margin on the route |
PDI_RhoG |
Integrity!$B$8 |
Gas density at the line pressure, lb/ft³ |
PDI_RhoL |
Integrity!$B$9 |
Liquid density, lb/ft³ |
PDI_RhoM |
Integrity!$B$14 |
Mixture density, no slip, lb/ft³ |
PDI_TR |
Integrity!$B$4 |
Temperature, absolute, °R |
PDI_Teq |
Integrity!$B$21 |
Hydrate temperature at the arrival pressure, °F |
PDI_TeqShut |
Integrity!$B$45 |
Hydrate temperature at the shut-in pressure, °F |
PDI_Tpc |
Integrity!$B$6 |
Pseudo-critical temperature, Standing with Wichert-Aziz, °R |
PDI_V |
Integrity!$B$17 |
Mixture velocity in the flowline's bore, ft/s |
PDI_Ve |
Integrity!$B$16 |
Erosional velocity, C over the square root of the density, ft/s |
PDI_Z |
Integrity!$B$7 |
Z-factor at the line pressure, DAK |
PDI_dT |
Integrity!$B$24 |
Hydrate depression, Hammerschmidt to 20 wt % and Nielsen-Bucklin above, °F |
PDI_xMeOH |
Integrity!$B$23 |
Methanol mole fraction in the water, frac |
PDS_CAmax |
Lines!$B$43 |
Corrosion allowance for carbon steel, mm |
PDS_CO2 |
Lines!$B$9 |
CO2 mole fraction in the gas, % |
PDS_Cont |
Lines!$B$38 |
Continuous service |
PDS_Corr |
Lines!$B$39 |
Corrosive gas without inhibition |
PDS_E |
Lines!$B$35 |
Gas line pipeline efficiency |
PDS_Eff |
Lines!$B$44 |
Inhibitor efficiency |
PDS_Eps |
Lines!$B$28 |
Wall roughness, absolute, commercial steel, in |
PDS_Eq |
Lines!$B$36 |
Gas line design equation, 1 Weymouth, 2 Panhandle A, 3 Panhandle B |
PDS_Ft3Bbl |
Lines!$B$108 |
Cubic feet in a barrel, ft3/bbl |
PDS_GasC |
Lines!$B$67 |
C factor for the service, API RP 14E |
PDS_GasID |
Lines!$B$68 |
Internal diameter, the smallest size that delivers, in |
PDS_GasP |
Lines!$B$63 |
Average pressure, two thirds of the inlet and minimum, psia |
PDS_GasPout |
Lines!$B$69 |
Outlet pressure at the rate, psia |
PDS_GasPpc |
Lines!$B$64 |
Pseudo-critical pressure, Standing with Wichert-Aziz, psi |
PDS_GasRatio |
Lines!$B$72 |
Velocity ratio, V over Ve |
PDS_GasTR |
Lines!$B$62 |
Average temperature, absolute, °R |
PDS_GasTpc |
Lines!$B$65 |
Pseudo-critical temperature, Standing with Wichert-Aziz, °R |
PDS_GasV |
Lines!$B$70 |
Gas velocity at the outlet, ft/s |
PDS_GasVe |
Lines!$B$71 |
Erosional velocity at the outlet, ft/s |
PDS_GasZ |
Lines!$B$66 |
Z-factor at the average pressure, DAK |
PDS_H2S |
Lines!$B$10 |
H2S in the gas, ppm |
PDS_IDs |
Lines!$B$48:$B$59 |
The internal diameter of each standard size, in |
PDS_IFT |
Lines!$B$33 |
Gas-liquid surface tension at line conditions, dyne/cm |
PDS_Inputs |
Lines!$B$4:$B$45 |
The route's stream, pressures, temperatures, lines, design basis and management data |
PDS_Lflow |
Lines!$B$26 |
Flowline length along the route, ft |
PDS_Lgas |
Lines!$B$24 |
Gas line length, mi |
PDS_Life |
Lines!$B$42 |
Design life, years |
PDS_LiqED |
Lines!$B$77 |
Relative roughness, over the diameter |
PDS_LiqID |
Lines!$B$76 |
Internal diameter, the smallest size that arrives, in |
PDS_LiqPout |
Lines!$B$79 |
Arrival pressure at the terminal, psig |
PDS_LiqRho |
Lines!$B$75 |
Liquid density, lb/ft³ |
PDS_LiqV |
Lines!$B$78 |
Velocity in the size, ft/s |
PDS_Lliq |
Lines!$B$25 |
Liquid line length, ft |
PDS_Margin |
Lines!$B$45 |
Margin off the hydrate curve the route must keep, °F |
PDS_MeOH |
Lines!$B$41 |
Methanol in the free water, wt % |
PDS_MflBore |
Lines!$B$32 |
Flowline bore, NPS 6 standard weight, in |
PDS_MflID |
Lines!$B$82 |
Internal diameter of the flowline, in |
PDS_MflLtot |
Lines!$B$85 |
Line length along the profile, ft |
PDS_MflPout |
Lines!$B$102 |
Arrival pressure at the separator, the last segment outlet, psia |
PDS_MflRhoL |
Lines!$B$84 |
Liquid density, SGL times water, lb/ft³ |
PDS_MflRough |
Lines!$B$83 |
Relative roughness, over the diameter |
PDS_Mu |
Lines!$B$29 |
Liquid viscosity at line temperature, cp |
PDS_PLiq |
Lines!$B$16 |
Liquid line pump discharge, gauge, psig |
PDS_PLiqMin |
Lines!$B$17 |
Minimum arrival pressure at the terminal, gauge, psig |
PDS_Ph |
Lines!$B$11 |
In-situ pH of the produced water, pH |
PDS_Pin |
Lines!$B$13 |
Flowline inlet pressure, absolute, psia |
PDS_Pmin |
Lines!$B$14 |
Minimum delivery pressure at the gas plant, absolute, psia |
PDS_Ppm |
Lines!$B$105 |
ppm in a mole fraction, ppm |
PDS_Profile |
Lines!$A$89:$H$100 |
Each segment length and rise, its angle, midpoint and mean temperature, and its inlet and outlet pressure from Beggs and Brill |
PDS_Psep |
Lines!$B$15 |
Separator operating pressure, absolute, psia |
PDS_Qg |
Lines!$B$4 |
Gas rate, MMscf/d |
PDS_Qo |
Lines!$B$5 |
Oil rate, STB/d |
PDS_Qw |
Lines!$B$6 |
Water rate, STB/d |
PDS_R0 |
Lines!$B$104 |
Rankine at 0 F, °R |
PDS_Results |
Lines!$B$62:$B$72 |
The gas line's average conditions, its smallest delivering size, its outlet pressure and its velocities |
PDS_Results2 |
Lines!$B$75:$B$79 |
The liquid line's density, its smallest arriving size, its velocity and its arrival pressure |
PDS_Results3 |
Lines!$B$82:$B$85 |
The flowline bore, its roughness, the liquid density and the length of the route |
PDS_Results4 |
Lines!$B$102:$B$102 |
The arrival pressure at the separator |
PDS_SG |
Lines!$B$7 |
Gas specific gravity (air = 1), air = 1 |
PDS_SGL |
Lines!$B$8 |
Liquid specific gravity, oil and water blended, water = 1 |
PDS_Sand |
Lines!$B$37 |
Solids in the gas |
PDS_Scf |
Lines!$B$106 |
scf in an MMscf, scf/MMscf |
PDS_Sec |
Lines!$B$107 |
Seconds in a day, s/d |
PDS_Sizes |
Lines!$A$48:$B$59 |
Each standard-weight size: its nominal size and its internal diameter |
PDS_Tgas |
Lines!$B$22 |
Gas line average flowing temperature, buried, °F |
PDS_Tin |
Lines!$B$19 |
Flowline inlet temperature, °F |
PDS_Tout |
Lines!$B$20 |
Flowline arrival temperature, the coldest point, °F |
PDS_Tsea |
Lines!$B$21 |
Seabed temperature, which the line cools toward, °F |
PDS_Vmax |
Lines!$B$30 |
Highest velocity allowed in the liquid line, ft/s |
PDS_Vmin |
Lines!$B$31 |
Lowest velocity wanted in the liquid line, ft/s |
PDS_Wt |
Lines!$B$109 |
Weight of the average pressure, two thirds |
PDS_dH |
Lines!$B$27 |
Liquid line climb, outlet less inlet, ft |
PDX_Checks |
Summary!$B$26:$B$32 |
Every check |
PDX_Corrosion |
Summary!$B$13 |
CO2 corrosion rate, bare carbon steel, mm/yr |
PDX_EffNeeded |
Summary!$B$15 |
Inhibitor efficiency the allowance needs |
PDX_Erosion |
Summary!$B$10 |
Erosional velocity ratio, V over Ve |
PDX_GasDeliveryCheck |
Summary!$B$19 |
Gas line delivery verdict |
PDX_GasDeliveryCheckNote |
Summary!$C$19 |
Gas line delivery comment |
PDX_GasID |
Summary!$B$4 |
Gas line, internal diameter, in |
PDX_GasPout |
Summary!$B$5 |
Gas line, outlet pressure, psia |
PDX_GasVelocityCheck |
Summary!$B$20 |
Gas line velocity verdict |
PDX_GasVelocityCheckNote |
Summary!$C$20 |
Gas line velocity comment |
PDX_LiqDeliveryCheck |
Summary!$B$21 |
Liquid line delivery verdict |
PDX_LiqDeliveryCheckNote |
Summary!$C$21 |
Liquid line delivery comment |
PDX_LiqID |
Summary!$B$6 |
Liquid line, internal diameter, in |
PDX_LiqPout |
Summary!$B$7 |
Liquid line, arrival pressure, psig |
PDX_LiqVelocityCheck |
Summary!$B$22 |
Liquid line velocity verdict |
PDX_LiqVelocityCheckNote |
Summary!$C$22 |
Liquid line velocity comment |
PDX_Margin |
Summary!$B$12 |
Least margin off the hydrate curve on the route, °F |
PDX_MarginBare |
Summary!$B$11 |
Margin off the hydrate curve at the coldest point, bare, °F |
PDX_MflID |
Summary!$B$8 |
Flowline, internal diameter, in |
PDX_Overall |
Summary!$B$25 |
Overall verdict |
PDX_OverallNote |
Summary!$C$25 |
Overall comment |
PDX_Results |
Summary!$B$4:$B$15 |
The three lines and the route's headline results |
PDX_Verdict |
Summary!$B$25:$B$25 |
The overall verdict |
PDX_Wall |
Summary!$B$14 |
Wall lost over the design life, bare steel, mm |
Details
| Opens in | Needs the Petroleum Office add-in: its PO functions show #NAME? without it once Excel recalculates. Needs Microsoft 365 or Excel 2024: it uses functions Excel 2016 doesn't have, such as named LAMBDAs, which show #NAME? there. |
| File | PipelineDesign.xlsx, 39 KB |
| Category | Production |
| For agents and tools | Descriptor (.md) |