Flow Assurance Screening
Description
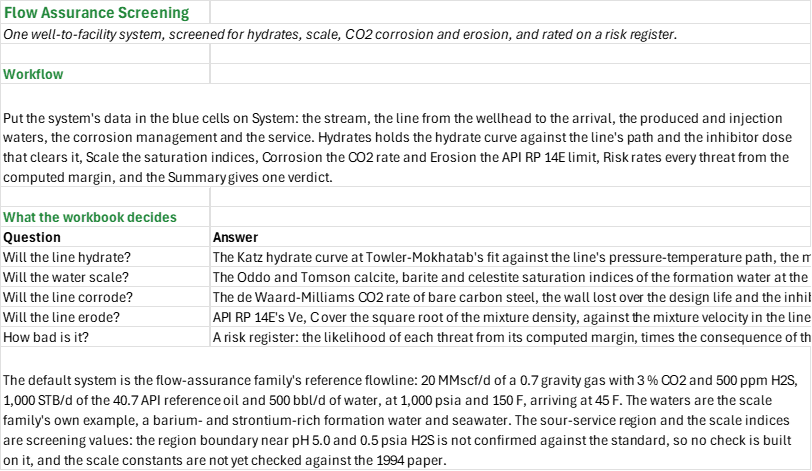
Will a well-to-facility system hydrate, scale, corrode or erode, and how bad is each threat? You enter one system: the stream, the line from the wellhead to the arrival, the formation and injection waters, the inhibitors, the design life and what each threat costs if it happens. You read off the hydrate margin and the methanol dose that clears it, the worst scale saturation index, the CO2 corrosion rate and wall loss, the erosional velocity ratio, and a risk register that rates each threat and gives the system one verdict.
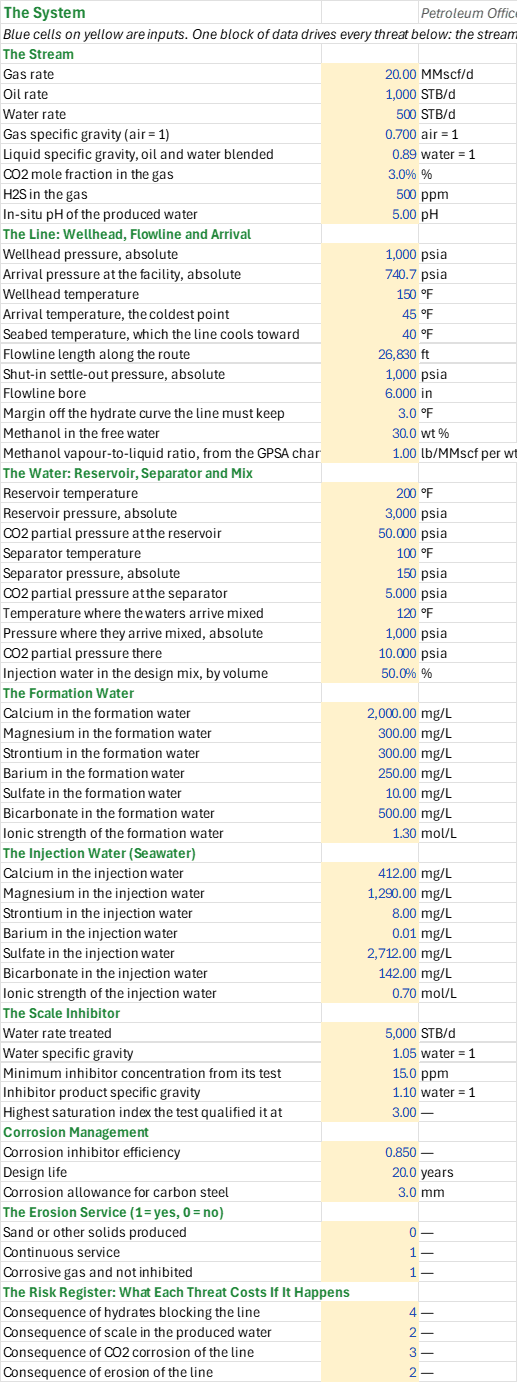
How to use it: Put the system on the System sheet: the metered rates, the gas and water analyses, the line's own as-built length and bore, the pressure and temperature profile from a flowline model, the seabed temperature, the inhibitor concentration and the design life, and the consequence of each threat. Check the line's path against the hydrate curve on Hydrates and the saturation indices over the mixing table on Scale. Read each threat's rating on Risk and the verdict on the Summary.
Method: Each threat is screened on the system's own data, not taken from the threat sheets one at a time.
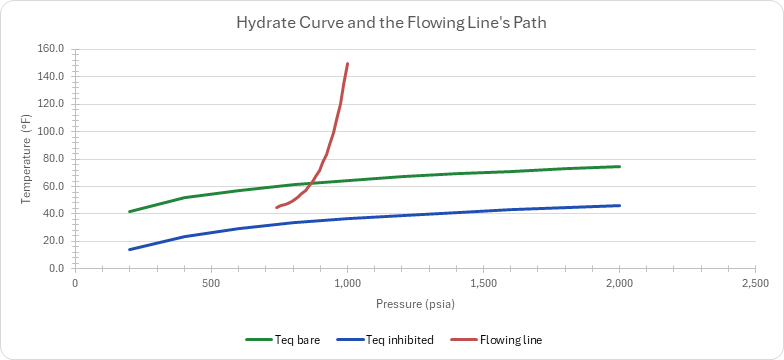
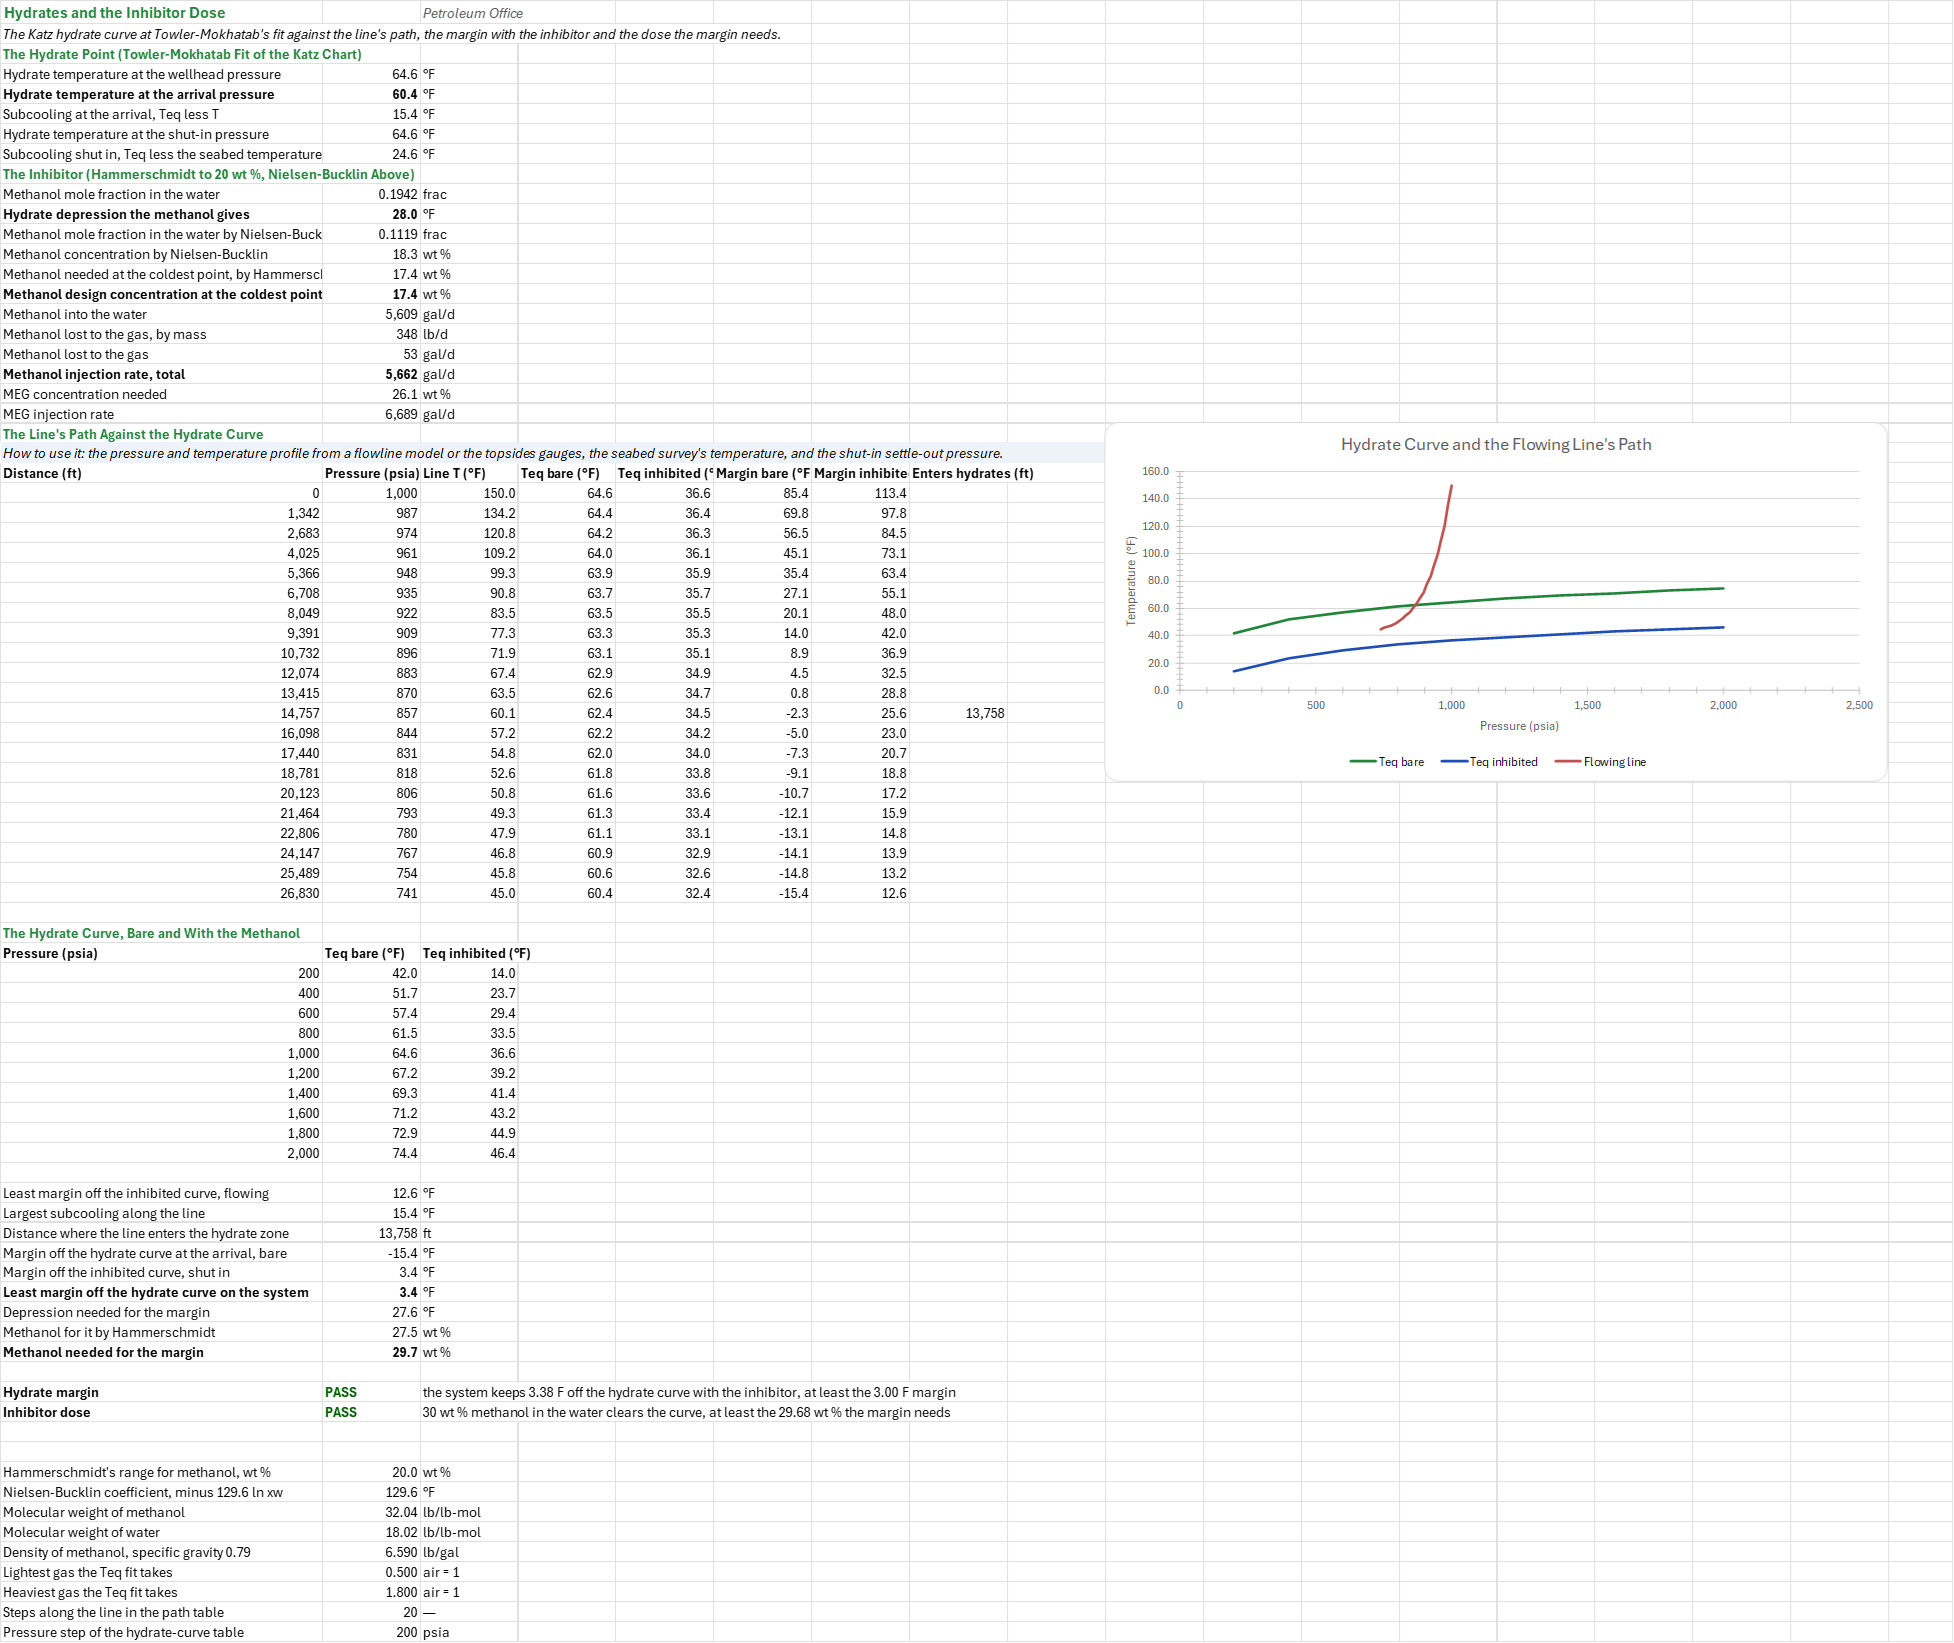
Hydrates. The hydrate point is the Katz gas-gravity curve at Towler and Mokhatab's fit, at the wellhead pressure, at the arrival pressure and at the shut-in settle-out pressure. The line's pressure-temperature path is a straight pressure line with exponential cooling toward the seabed over 21 stations, and the hydrate curve is drawn against it. The methanol's depression is Hammerschmidt inside its 20 wt % range and Nielsen-Bucklin above it, and the least margin on the system is the smaller of the flowing margin and the shut-in margin. The dose is the methanol the margin needs, by Hammerschmidt or Nielsen-Bucklin, the concentration at the coldest point, the rate into the water, the rate the gas carries off and the total, with the MEG equivalent.
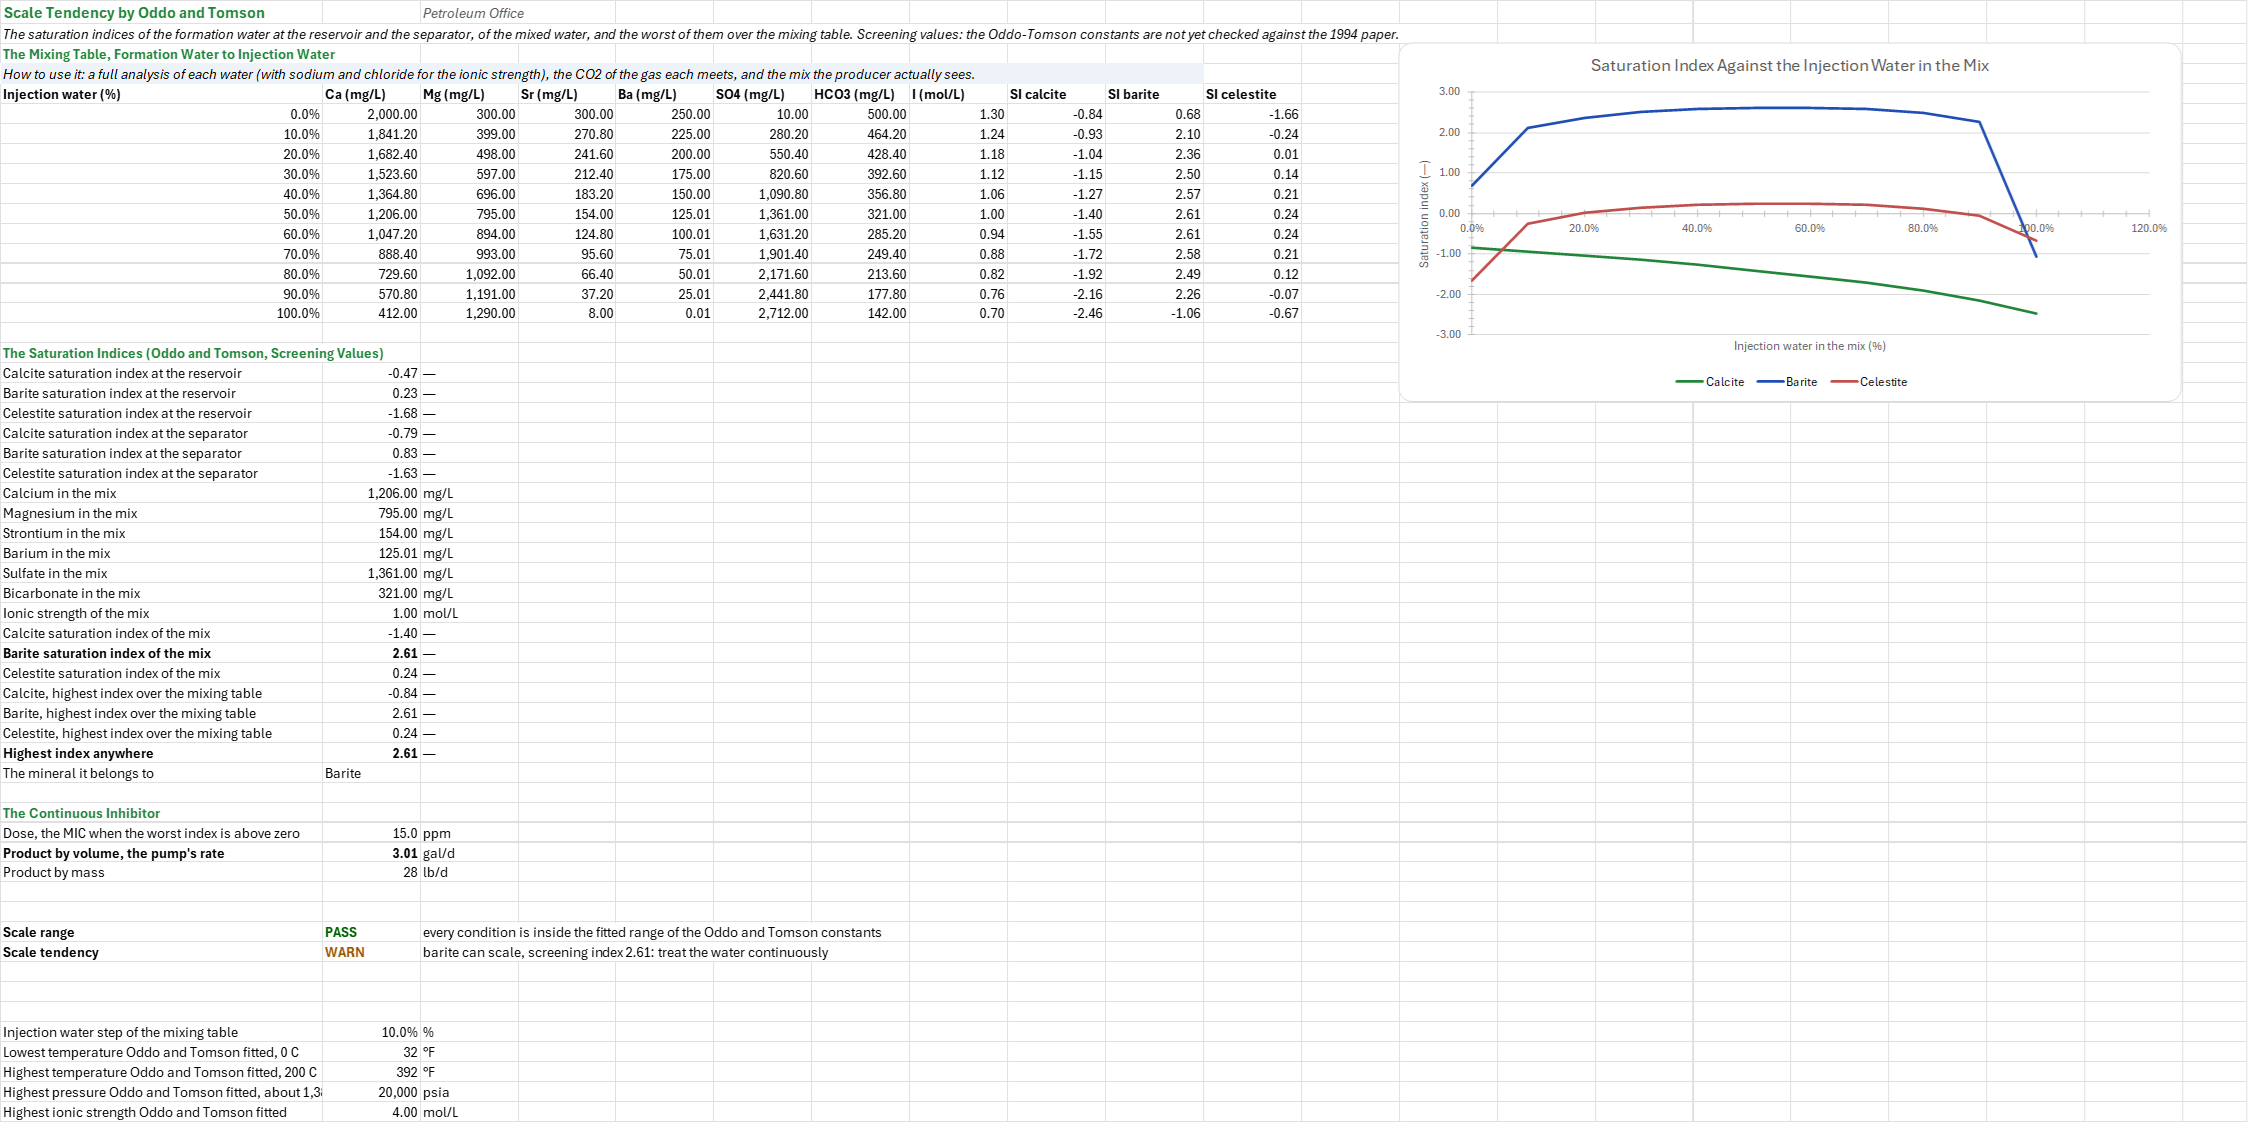
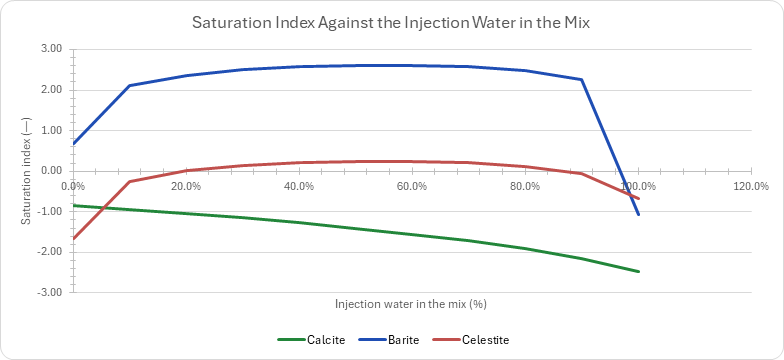
Scale. The saturation indices are Oddo and Tomson's for calcite, barite and celestite, of the formation water at the reservoir and at the separator, and of the water mixed with the injection water at the design fraction. The mixing table sweeps the injection water's share from none to all in ten steps, and the worst index over that table is the screen. The continuous inhibitor's dose comes from the test's minimum concentration at the water rate.
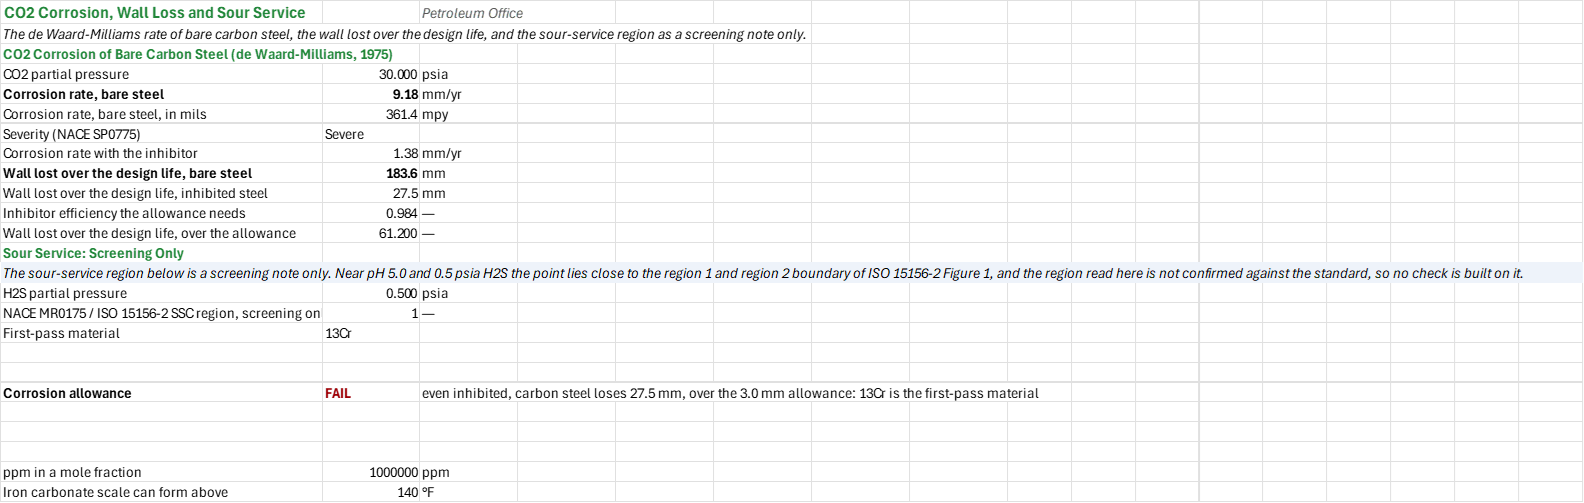
Corrosion. The rate is de Waard-Milliams' unprotected rate of bare carbon steel at the CO2 partial pressure, its NACE SP0775 severity, the inhibited rate at the inhibitor's efficiency, the wall lost over the design life both ways, and the efficiency the allowance needs.
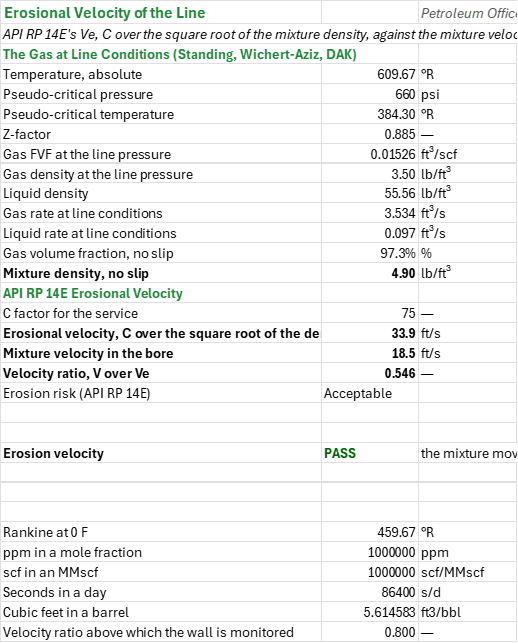
Erosion. The limit is API RP 14E's erosional velocity, C over the square root of the no-slip mixture density, against the mixture velocity in the line's bore; the ratio carries the risk class.
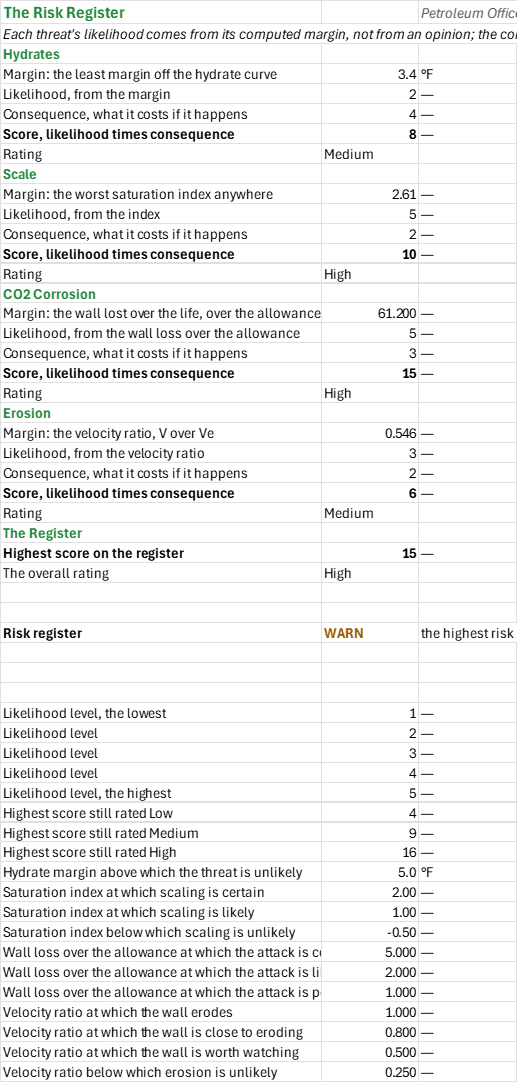
The risk register. Each threat's likelihood comes from its own computed margin: the least hydrate margin, the worst saturation index, the wall lost over the allowance, and the velocity ratio. The consequence is what that threat costs if it happens, a number the reader sets on System. The two multiply into a score, and the score is rated Low, Medium, High or Critical. The register's highest score is the system's risk.
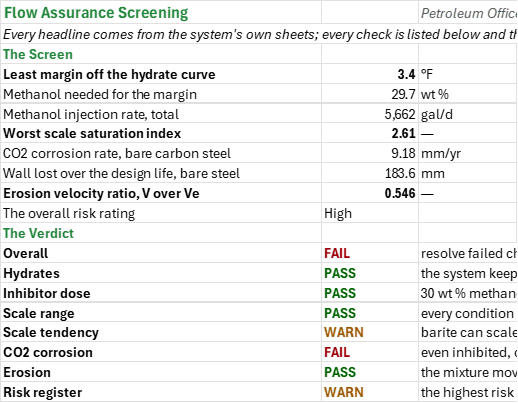
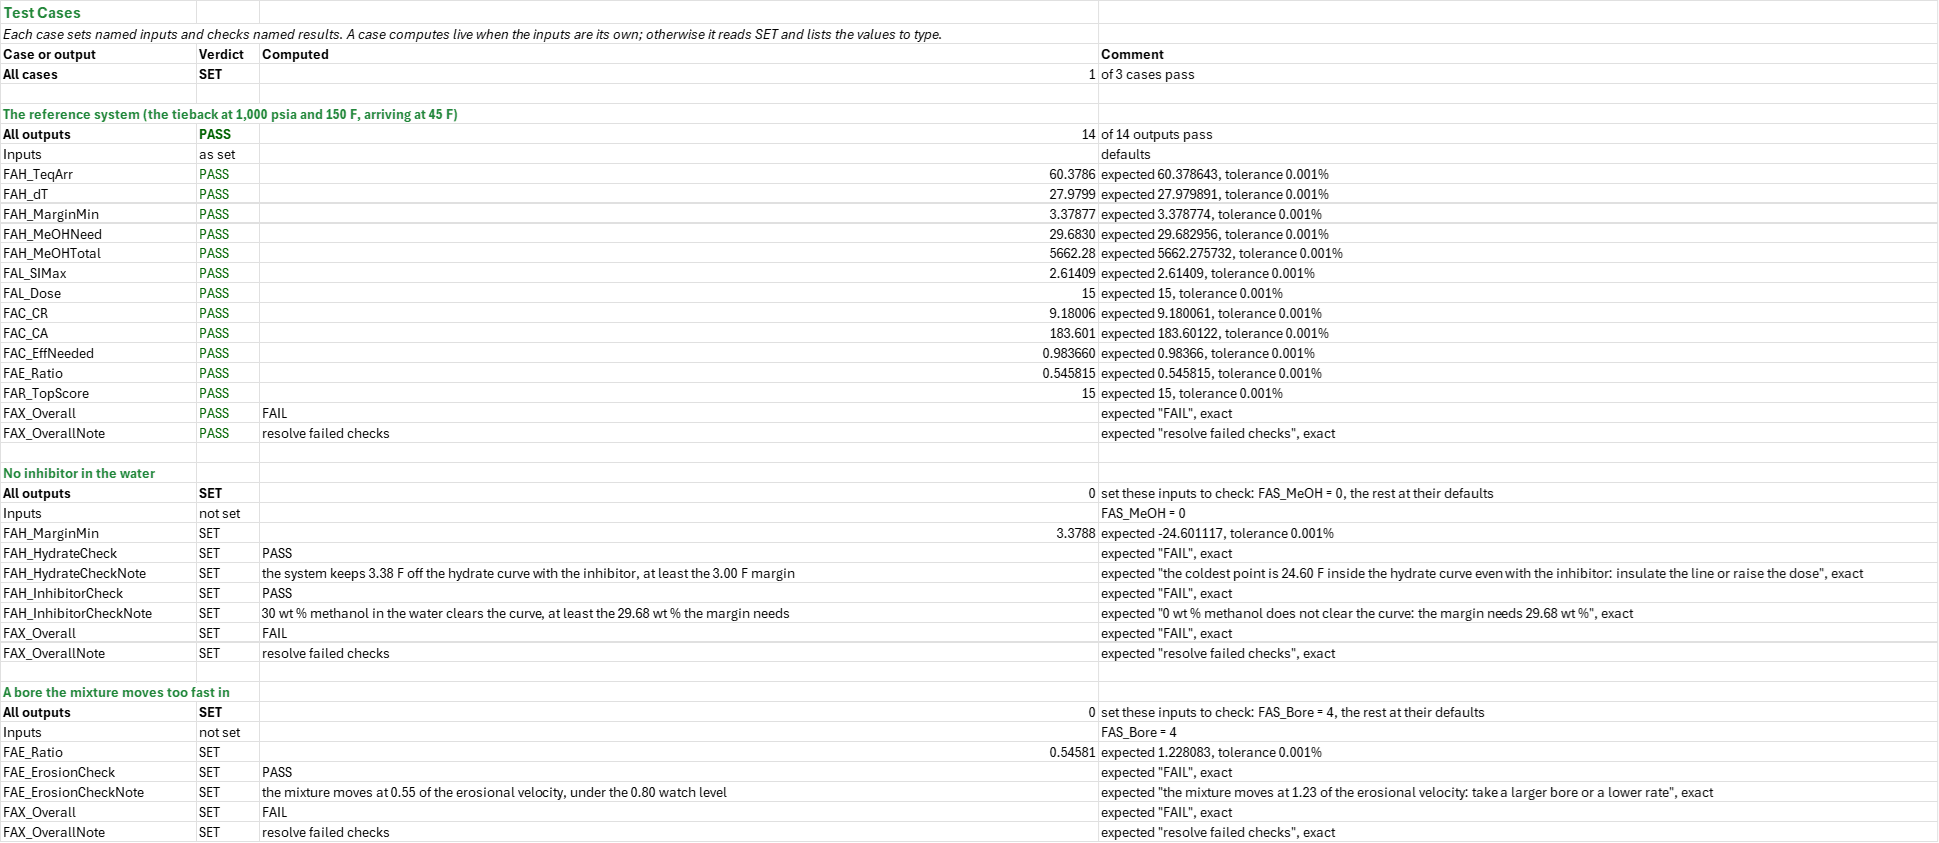
Example: The default system is a 6-in subsea tieback: a wellhead at 1,000 psia and 150 F, a flowline that arrives at the facility at 45 F, and the produced water that comes with it. The hydrate temperature at the arrival is 60.38 F against the 45 F arrival, so the bare line is 15.38 F inside the hydrate curve. At 30 wt % methanol the depression is 27.98 F and the least margin on the system is 3.38 F, shut in, above the 3 F wanted; the margin needs 29.68 wt % methanol, so 30 wt % clears it.
The scale screen reads a worst index of 2.61 for barite, so the water can scale and wants the continuous inhibitor at its test's 15 ppm. The corrosion screen is the one that fails: at 30 psia of CO2 the bare steel loses 9.18 mm a year, 183.60 mm over the 20 year life, and even at 85 % inhibition 27.54 mm, over the 3 mm allowance, so duplex is the first-pass material (the line is in sour region 2, where 13Cr is not allowed) and the allowance would want 98.4 % inhibitor efficiency. The erosion screen passes at 0.55 of the erosional velocity. The register's highest score is 15, High, on the corrosion.
The system holds on hydrates and erosion, warns on scale and fails the corrosion allowance: the line needs a corrosion-resistant alloy, not carbon steel.
Validity
A screen, as each threat's own sheet states in full. The hydrate fit is for a sweet natural gas with free water, gravity 0.5 to 1.8, and it carries no correction for N2, CO2, H2S or salt; the path is a model, not a measurement, so a flowline model's stations should replace it. The scale indices are screening values: the Oddo and Tomson constants were transcribed from a 2024 reprint and have not yet been checked against the 1994 paper, SPE-21710-PA, so the index is labelled as a screening value on the sheet and the register rates scale on it. The corrosion rate is the unprotected de Waard-Milliams rate, an upper bound above 140 F where iron carbonate scale can form. API RP 14E's limit is conservative and does not model sand. The likelihood bands and the consequence weights are this workbook's own choices and sit in the Calculation Constants.
The sour-service region is read from the lines of ISO 15156-2 Figure 1. At the default 0.5 psia of H2S and pH 5.0 the point is region 2, 0.04 pH units below the region 1 line, so it is marginal: a better in-situ pH can move it to region 1, and the material to 13Cr. The region steers the material, but no check is built on it.
The add-in has no functions for the wax appearance temperature, so wax is not screened; for a hydrate curve from van der Waals-Platteeuw with brine and inhibitor, so the Katz-gravity curve stands; or for the NORSOK M-506 corrosion rate that models the scale, the pH and the wall shear stress, so the de Waard-Milliams rate stands.
Named alternatives: a Pitzer-based aqueous model (PHREEQC, ScaleSoftPitzer, OLI) for the scale indices; a flowline thermal model (OLGA, PIPESIM) for the path; a sand erosion rate (DNV RP O501) for a line carrying solids; and a squeeze design on the inhibitor's adsorption isotherm instead of continuous injection.
References
- Katz, D.L. (1945). Prediction of Conditions for Hydrate Formation in Natural Gases. Trans. AIME 160, 140-149.
- Towler, B.F. and Mokhatab, S. (2005). Quickly Estimate Hydrate Formation Conditions in Natural Gases. Hydrocarbon Processing 84(4), 61-62.
- Hammerschmidt, E.G. (1934). Formation of Gas Hydrates in Natural Gas Transmission Lines. Ind. Eng. Chem. 26(8), 851-855.
- Nielsen, R.B. and Bucklin, R.W. (1983). Why Not Use Methanol for Hydrate Control? Hydrocarbon Processing 62(4), 71-78.
- Oddo, J.E. and Tomson, M.B. (1994). Why Scale Forms in the Oil Field and Methods To Predict It. SPE Production & Facilities 9(1), 47-54. SPE-21710-PA.
- de Waard, C. and Milliams, D.E. (1975). Carbonic Acid Corrosion of Steel. Corrosion 31(5), 177-181.
- de Waard, C., Lotz, U. and Milliams, D.E. (1991). Predictive Model for CO2 Corrosion Engineering in Wet Natural Gas Pipelines. Corrosion 47(12), 976-985 (CORROSION/91).
- NACE SP0775. Preparation, Installation, Analysis, and Interpretation of Corrosion Coupons in Oilfield Operations. NACE International.
- API RP 14E (1991), Design and Installation of Offshore Production Platform Piping Systems, 5th ed., section 2.5.
- GPSA (2012), Engineering Data Book, 13th ed., section 17.
Inputs
| Input | Unit | Default | Name |
|---|---|---|---|
| Gas rate | MMscf/d | 20 | FAS_Qg |
| Oil rate | STB/d | 1,000 | FAS_Qo |
| Water rate | bbl/d | 500 | FAS_Qw |
| Gas specific gravity (air = 1) | — | 0.7 | FAS_SG |
| Liquid specific gravity, oil and water blended | — | 0.89 | FAS_SGL |
| CO2 mole fraction in the gas | % | 3 | FAS_CO2 |
| H2S in the gas | ppm | 500 | FAS_H2S |
| In-situ pH of the produced water | pH | 5.0 | FAS_Ph |
| Wellhead pressure, absolute | psia | 1,000 | FAS_P |
| Arrival pressure at the facility, absolute | psia | 740.7 | FAS_Parr |
| Wellhead temperature | F | 150 | FAS_Tin |
| Arrival temperature, the coldest point | F | 45 | FAS_Tarr |
| Seabed temperature, which the line cools toward | F | 40 | FAS_Tsea |
| Flowline length along the route | ft | 26,830 | FAS_L |
| Shut-in settle-out pressure, absolute | psia | 1,000 | FAS_Pshut |
| Flowline bore | in | 6 | FAS_Bore |
| Margin off the hydrate curve the line must keep | F | 3 | FAS_Margin |
| Methanol in the free water | wt % | 30 | FAS_MeOH |
| Methanol vapour-to-liquid ratio, from the GPSA chart | lb/MMscf per wt % | 1 | FAS_Ratio |
| Reservoir temperature | F | 200 | FAS_TRes |
| Reservoir pressure, absolute | psia | 3,000 | FAS_PRes |
| CO2 partial pressure at the reservoir | psia | 50 | FAS_CO2Res |
| Separator temperature | F | 100 | FAS_TSurf |
| Separator pressure, absolute | psia | 150 | FAS_PSurf |
| CO2 partial pressure at the separator | psia | 5 | FAS_CO2Surf |
| Temperature where the waters arrive mixed | F | 120 | FAS_TMix |
| Pressure where they arrive mixed, absolute | psia | 1,000 | FAS_PMix |
| CO2 partial pressure there | psia | 10 | FAS_CO2Mix |
| Injection water in the design mix, by volume | % | 50 | FAS_Frac |
| Calcium, magnesium, strontium, barium, sulfate and bicarbonate in the formation water | mg/L | 2,000, 300, 300, 250, 10, 500 | FAS_CaF, FAS_MgF, FAS_SrF, FAS_BaF, FAS_SO4F, FAS_HCO3F |
| Ionic strength of the formation water | mol/L | 1.3 | FAS_IonF |
| Calcium, magnesium, strontium, barium, sulfate and bicarbonate in the injection water | mg/L | 412, 1,290, 8, 0.01, 2,712, 142 | FAS_CaI, FAS_MgI, FAS_SrI, FAS_BaI, FAS_SO4I, FAS_HCO3I |
| Ionic strength of the injection water | mol/L | 0.7 | FAS_IonI |
| Water rate treated | bbl/d | 5,000 | FAS_QwS |
| Water specific gravity | — | 1.05 | FAS_SGw |
| Minimum inhibitor concentration from its test | ppm | 15 | FAS_MIC |
| Inhibitor product specific gravity | — | 1.1 | FAS_SGi |
| Highest saturation index the test qualified it at | — | 3 | FAS_SIQual |
| Corrosion inhibitor efficiency | % | 85 | FAS_Eff |
| Design life | y | 20 | FAS_Life |
| Corrosion allowance for carbon steel | mm | 3 | FAS_CAmax |
| Sand or other solids produced (1 = yes, 0 = no) | — | 0 | FAS_Sand |
| Continuous service (1 = yes, 0 = no) | — | 1 | FAS_Cont |
| Corrosive gas and not inhibited (1 = yes, 0 = no) | — | 1 | FAS_Corr |
| Consequence of hydrates blocking the line, of scale in the produced water, of CO2 corrosion of the line and of erosion of the line | — | 4, 2, 3, 2 | FAS_CHyd, FAS_CScale, FAS_CCorr, FAS_CEro |
Sheets
Guide— what the workbook decides, as five questions and how each is answered, the workflow and the default system.System— the one block of inputs every threat reads: the stream, the line from the wellhead to the arrival, the waters at the reservoir, the separator and the mix, the formation and injection water analyses, the scale inhibitor, the corrosion management, the erosion service and each threat's consequence.Hydrates— the hydrate point at the wellhead, arrival and shut-in pressures, the inhibitor's depression and dose, the line's path over 21 stations, and a chart of the hydrate curve, bare and with the methanol, against the flowing line.Scale— the mixing table from formation water to injection water, the calcite, barite and celestite saturation indices (screening values) with a chart against the injection water's share, and the continuous inhibitor's dose.Corrosion— the de Waard-Milliams CO2 rate of bare carbon steel, the inhibited rate, the wall lost over the design life against the allowance, the sour-service region and the first-pass material.Erosion— the gas at line conditions, the API RP 14E erosional velocity against the mixture velocity in the line's bore, and their ratio.Risk— each threat's likelihood from its computed margin, its consequence, and the register that rates each score Low to Critical.Summary— every headline from the system's sheets, every check and the system's one verdict.Test Cases— the worked example and other cases, with expected and computed results.
Functions used
Names (254)
| Name | Refers to | Comment |
|---|---|---|
PO.CO.Mat.CO2MaterialLAMBDA |
=LAMBDA(cr, cr_inh, t, region, life, ca_max, IF(OR(cr<0, cr_inh<0, cr_inh>cr, life<=0, ca_max<0, region<0, region>3), NA(), IF(cr*life<=ca_max, "Carbon steel", IF(cr_inh*life<=ca_max, "Carbon steel + inhibitor", IF(AND(t<=302, region<=1), "13Cr", IF(AND(t<=450, region<=2), "Duplex", "Nickel alloy")))))) |
First-pass CO2-service material: "Carbon steel", "Carbon steel + inhibitor", "13Cr", "Duplex" or "Nickel alloy", from the bare and inhibited rates (mm/yr), T (degF), the ISO 15156-2 region, the life (years) and the allowance (mm). |
PO.FA.Corrosion.H2S.RegionLAMBDA |
=LAMBDA(p_h2s, ph, IF(OR(p_h2s<0, ph<0, ph>14), NA(), IF(p_h2s<0.05, 0, LET(kpa, p_h2s*6.894757, lg, LOG10(kpa), severe, IF(kpa<1, 3.5, IF(kpa<=100, 3.5+lg, 5.5)), mild, IF(kpa<=100, 4.5+lg, 6.5), IF(ph<severe, 3, IF(ph<mild, 2, 1)))))) |
NACE MR0175 / ISO 15156-2 Figure 1 SSC severity region of carbon and low-alloy steel, 0 to 3, from the H2S partial pressure (psia) and the in-situ pH. |
PO.FA.Scale.InhibitorDoseLAMBDA |
=LAMBDA(si, mic, qw, sg_w, sg_i, output, IF(OR(mic<0, qw<0, sg_w<=0, sg_i<=0), NA(), LET(dose, (si>0)*mic, mass, qw*350.51*sg_w*dose/1000000, IF(output="Dose", dose, IF(output="Mass", mass, IF(output="Volume", mass/(8.3454*sg_i), NA())))))) |
Continuous scale-inhibitor dose: "Dose" ppm (the qualified MIC when si > 0, else 0), "Mass" lb/d or "Volume" gal/d of product, for qw bbl/d of water of gravity sg_w and a product of gravity sg_i. |
PO.FA.Scale.MixRatioLAMBDA |
=LAMBDA(formation, injection, fraction, IF(OR(fraction<0, fraction>1), NA(), formation*(1-fraction)+injection*fraction)) |
Ion concentrations of a formation and injection water mixture: formation*(1 − fraction) + injection*fraction, fraction the injection water's volume fraction (0 to 1). A row of ions and a column of fractions give the mixing table. |
PO.FA.Scale.SI.OddoTomsonLAMBDA |
=LAMBDA(mineral, t, p, ionic, ca, mg, sr, ba, sulfate, bicarb, p_co2, LET(ok, IF(mineral="Calcite", AND(ca>0, bicarb>0, p_co2>0), IF(mineral="Barite", AND(ba>0, sulfate>0), IF(mineral="Celestite", AND(sr>0, sulfate>0), FALSE))), IF(OR(NOT(ok), p<0, ionic<0, ca<0, mg<0, sr<0, ba<0, sulfate<0, bicarb<0, p_co2<0), NA(), LET(mca, ca/40078, mmg, mg/24305, msr, sr/87620, mba, ba/137327, mso, sulfate/96060, mhc, bicarb/61017, ri, SQRT(ionic), kst, 10^(1.86+0.0045*t-0.0000012*t^2+0.000107*p-2.38*ri+0.58*ionic-0.0013*ri*t), bq, 1+kst*(mca+mmg+msr+mba-mso), fso, (SQRT(bq^2+4*kst*mso)-bq)/(2*kst), den, 1+kst*fso, IF(mineral="Calcite", LOG10((mca+(mca<=0))*(mhc+(mhc<=0))^2)-LOG10(p_co2+(p_co2<=0))+5.85+0.01519*t-0.00000164*t^2-0.0000527*p-3.334*ri+1.431*ionic, IF(mineral="Barite", LOG10((mba+(mba<=0))*(fso+(fso<=0))/den)+10.03-0.0048*t+0.0000114*t^2-0.000048*p-2.62*ri+0.891*ionic-0.002*ri*t, LOG10((msr+(msr<=0))*(fso+(fso<=0))/den)+6.11+0.002*t+0.0000064*t^2-0.000046*p-1.89*ri+0.67*ionic-0.0019*ri*t)))))) |
Oddo-Tomson saturation index of "Calcite", "Barite" or "Celestite" at t (°F), p (psia) and ionic strength (mol/L), from Ca, Mg, Sr, Ba, sulfate and bicarbonate in mg/L and the CO2 partial pressure p_co2 (psia). SI > 0 is supersaturated. |
PO.HSE.Sour.PartialPressureLAMBDA |
=LAMBDA(y_h2s, p, IF(OR(y_h2s<0, y_h2s>1, p<0), NA(), y_h2s*p)) |
H2S partial pressure in a gas, pH2S = y·P (ISO 15156-2 Annex C), in the unit of the total absolute pressure given: psia in, psia out. |
FAC_CA |
Corrosion!$B$9 |
Wall lost over the design life, bare steel, mm |
FAC_CAInh |
Corrosion!$B$10 |
Wall lost over the design life, inhibited steel, mm |
FAC_CR |
Corrosion!$B$5 |
Corrosion rate, bare steel, mm/yr |
FAC_CRInh |
Corrosion!$B$8 |
Corrosion rate with the inhibitor, mm/yr |
FAC_CRmpy |
Corrosion!$B$6 |
Corrosion rate, bare steel, in mils, mpy |
FAC_Checks |
Corrosion!$B$20 |
The corrosion allowance check |
FAC_ChecksNote |
Corrosion!$C$20 |
The corrosion allowance check comment |
FAC_CorrRatio |
Corrosion!$B$12 |
Wall lost over the design life, over the allowance |
FAC_CorrosionCheck |
Corrosion!$B$20 |
Corrosion allowance verdict |
FAC_CorrosionCheckNote |
Corrosion!$C$20 |
Corrosion allowance comment |
FAC_EffNeeded |
Corrosion!$B$11 |
Inhibitor efficiency the allowance needs |
FAC_Material |
Corrosion!$B$17 |
First-pass material |
FAC_PpCO2 |
Corrosion!$B$4 |
CO2 partial pressure, psia |
FAC_PpH2S |
Corrosion!$B$15 |
H2S partial pressure, psia |
FAC_Ppm |
Corrosion!$B$24 |
ppm in a mole fraction, ppm |
FAC_Region |
Corrosion!$B$16 |
NACE MR0175 / ISO 15156-2 SSC region |
FAC_Results |
Corrosion!$B$4:$B$12 |
The CO2 partial pressure, the bare and inhibited rates, the wall lost and the efficiency the allowance needs |
FAC_Results2 |
Corrosion!$B$15:$B$17 |
The H2S partial pressure, the SSC region and the first-pass material |
FAC_Severity |
Corrosion!$B$7 |
Severity (NACE SP0775) |
FAC_TScale |
Corrosion!$B$25 |
Iron carbonate scale can form above, °F |
FAE_Bg |
Erosion!$B$8 |
Gas FVF at the line pressure, ft³/scf |
FAE_C |
Erosion!$B$16 |
C factor for the service |
FAE_Checks |
Erosion!$B$23 |
The erosion velocity check |
FAE_ChecksNote |
Erosion!$C$23 |
The erosion velocity check comment |
FAE_ErosionCheck |
Erosion!$B$23 |
Erosion velocity verdict |
FAE_ErosionCheckNote |
Erosion!$C$23 |
Erosion velocity comment |
FAE_Ft3Bbl |
Erosion!$B$31 |
Cubic feet in a barrel, ft3/bbl |
FAE_Lambda |
Erosion!$B$13 |
Gas volume fraction, no slip, % |
FAE_Ppc |
Erosion!$B$5 |
Pseudo-critical pressure, psi |
FAE_Ppm |
Erosion!$B$28 |
ppm in a mole fraction, ppm |
FAE_QLIs |
Erosion!$B$12 |
Liquid rate at line conditions, ft³/s |
FAE_QgIs |
Erosion!$B$11 |
Gas rate at line conditions, ft³/s |
FAE_R0 |
Erosion!$B$27 |
Rankine at 0 F, °R |
FAE_Ratio |
Erosion!$B$19 |
Velocity ratio, V over Ve |
FAE_Results |
Erosion!$B$4:$B$14 |
The gas at line conditions, the in-situ rates and the mixture density |
FAE_Results2 |
Erosion!$B$16:$B$20 |
The C factor, the erosional and mixture velocities, their ratio and the risk class |
FAE_RhoG |
Erosion!$B$9 |
Gas density at the line pressure, lb/ft³ |
FAE_RhoL |
Erosion!$B$10 |
Liquid density, lb/ft³ |
FAE_RhoM |
Erosion!$B$14 |
Mixture density, no slip, lb/ft³ |
FAE_Risk |
Erosion!$B$20 |
Erosion risk (API RP 14E) |
FAE_Scf |
Erosion!$B$29 |
scf in an MMscf, scf/MMscf |
FAE_Sec |
Erosion!$B$30 |
Seconds in a day, s/d |
FAE_TR |
Erosion!$B$4 |
Temperature, absolute, °R |
FAE_Tpc |
Erosion!$B$6 |
Pseudo-critical temperature, °R |
FAE_V |
Erosion!$B$18 |
Mixture velocity in the bore, ft/s |
FAE_Ve |
Erosion!$B$17 |
Erosional velocity, C over the square root of the density, ft/s |
FAE_Watch |
Erosion!$B$32 |
Velocity ratio above which the wall is monitored |
FAE_Z |
Erosion!$B$7 |
Z-factor |
FAH_Checks |
Hydrates!$B$70:$B$71 |
The hydrate margin check and the inhibitor dose check |
FAH_Curve |
Hydrates!$A$49:$C$58 |
The hydrate temperature against pressure in steps, bare and with the methanol |
FAH_HamMax |
Hydrates!$B$74 |
Hammerschmidt's range for methanol, wt %, wt % |
FAH_HydrateCheck |
Hydrates!$B$70 |
Hydrate margin verdict |
FAH_HydrateCheckNote |
Hydrates!$C$70 |
Hydrate margin comment |
FAH_InhibitorCheck |
Hydrates!$B$71 |
Inhibitor dose verdict |
FAH_InhibitorCheckNote |
Hydrates!$C$71 |
Inhibitor dose comment |
FAH_MEG |
Hydrates!$B$20 |
MEG concentration needed, wt % |
FAH_MEGRate |
Hydrates!$B$21 |
MEG injection rate, gal/d |
FAH_MarginBare |
Hydrates!$B$63 |
Margin off the hydrate curve at the arrival, bare, °F |
FAH_MarginFlow |
Hydrates!$B$60 |
Least margin off the inhibited curve, flowing, °F |
FAH_MarginMin |
Hydrates!$B$65 |
Least margin off the hydrate curve on the system, °F |
FAH_MarginShut |
Hydrates!$B$64 |
Margin off the inhibited curve, shut in, °F |
FAH_MeOHConc |
Hydrates!$B$14 |
Methanol needed at the coldest point, by Hammerschmidt, wt % |
FAH_MeOHDesign |
Hydrates!$B$15 |
Methanol design concentration at the coldest point, wt % |
FAH_MeOHHam |
Hydrates!$B$67 |
Methanol for it by Hammerschmidt, wt % |
FAH_MeOHNB |
Hydrates!$B$13 |
Methanol concentration by Nielsen-Bucklin, wt % |
FAH_MeOHNeed |
Hydrates!$B$68 |
Methanol needed for the margin, wt % |
FAH_MeOHRate |
Hydrates!$B$16 |
Methanol into the water, gal/d |
FAH_MeOHTotal |
Hydrates!$B$19 |
Methanol injection rate, total, gal/d |
FAH_MeOHVap |
Hydrates!$B$18 |
Methanol lost to the gas, gal/d |
FAH_MeOHVapMass |
Hydrates!$B$17 |
Methanol lost to the gas, by mass, lb/d |
FAH_MwMeOH |
Hydrates!$B$76 |
Molecular weight of methanol, lb/lb-mol |
FAH_MwW |
Hydrates!$B$77 |
Molecular weight of water, lb/lb-mol |
FAH_NB |
Hydrates!$B$75 |
Nielsen-Bucklin coefficient, minus 129.6 ln xw, °F |
FAH_Onset |
Hydrates!$B$62 |
Distance where the line enters the hydrate zone, ft |
FAH_Profile |
Hydrates!$A$25:$H$45 |
Distance along the line, the pressure and the temperature, the hydrate temperature bare and with the methanol, the margins off each and where the line crosses into the hydrate zone |
FAH_Pstep |
Hydrates!$B$82 |
Pressure step of the hydrate-curve table, psia |
FAH_Results |
Hydrates!$B$4:$B$21 |
The hydrate point, the subcooling, the methanol's depression and the dose it needs |
FAH_Results2 |
Hydrates!$B$60:$B$68 |
The margins, the subcooling, the onset and the dose the margin needs |
FAH_RhoMeOH |
Hydrates!$B$78 |
Density of methanol, specific gravity 0.79, lb/gal |
FAH_SGMax |
Hydrates!$B$80 |
Heaviest gas the Teq fit takes, air = 1 |
FAH_SGMin |
Hydrates!$B$79 |
Lightest gas the Teq fit takes, air = 1 |
FAH_Steps |
Hydrates!$B$81 |
Steps along the line in the path table |
FAH_SubArr |
Hydrates!$B$6 |
Subcooling at the arrival, Teq less T, °F |
FAH_SubMax |
Hydrates!$B$61 |
Largest subcooling along the line, °F |
FAH_SubShut |
Hydrates!$B$8 |
Subcooling shut in, Teq less the seabed temperature, °F |
FAH_TeqArr |
Hydrates!$B$5 |
Hydrate temperature at the arrival pressure, °F |
FAH_TeqIn |
Hydrates!$B$4 |
Hydrate temperature at the wellhead pressure, °F |
FAH_TeqShut |
Hydrates!$B$7 |
Hydrate temperature at the shut-in pressure, °F |
FAH_dT |
Hydrates!$B$11 |
Hydrate depression the methanol gives, °F |
FAH_dTNeed |
Hydrates!$B$66 |
Depression needed for the margin, °F |
FAH_xMeOH |
Hydrates!$B$10 |
Methanol mole fraction in the water, frac |
FAH_xMeOHNB |
Hydrates!$B$12 |
Methanol mole fraction in the water by Nielsen-Bucklin, frac |
FAL_BaM |
Scale!$B$28 |
Barium in the mix, mg/L |
FAL_BarMax |
Scale!$B$36 |
Barite, highest index over the mixing table |
FAL_BarMix |
Scale!$B$33 |
Barite saturation index of the mix |
FAL_BarRes |
Scale!$B$20 |
Barite saturation index at the reservoir |
FAL_BarSurf |
Scale!$B$23 |
Barite saturation index at the separator |
FAL_CaM |
Scale!$B$25 |
Calcium in the mix, mg/L |
FAL_CalMax |
Scale!$B$35 |
Calcite, highest index over the mixing table |
FAL_CalMix |
Scale!$B$32 |
Calcite saturation index of the mix |
FAL_CalRes |
Scale!$B$19 |
Calcite saturation index at the reservoir |
FAL_CalSurf |
Scale!$B$22 |
Calcite saturation index at the separator |
FAL_CelMax |
Scale!$B$37 |
Celestite, highest index over the mixing table |
FAL_CelMix |
Scale!$B$34 |
Celestite saturation index of the mix |
FAL_CelRes |
Scale!$B$21 |
Celestite saturation index at the reservoir |
FAL_CelSurf |
Scale!$B$24 |
Celestite saturation index at the separator |
FAL_Checks |
Scale!$B$47:$B$48 |
The scale range check and the scale tendency check |
FAL_Dose |
Scale!$B$42 |
Dose, the MIC when the worst index is above zero, ppm |
FAL_HCO3M |
Scale!$B$30 |
Bicarbonate in the mix, mg/L |
FAL_IMax |
Scale!$B$56 |
Highest ionic strength Oddo and Tomson fitted, mol/L |
FAL_IonM |
Scale!$B$31 |
Ionic strength of the mix, mol/L |
FAL_Mass |
Scale!$B$44 |
Product by mass, lb/d |
FAL_MgM |
Scale!$B$26 |
Magnesium in the mix, mg/L |
FAL_Mineral |
Scale!$B$39 |
The mineral it belongs to |
FAL_Mix |
Scale!$A$6:$K$16 |
The injection water's share of the mix in steps, the mixed ions and ionic strength, and the calcite, barite and celestite indices at the mixing conditions |
FAL_PMax |
Scale!$B$55 |
Highest pressure Oddo and Tomson fitted, about 1,380 bar, psia |
FAL_Results |
Scale!$B$19:$B$39 |
The saturation indices, the mixed ions and the worst index anywhere |
FAL_Results2 |
Scale!$B$42:$B$44 |
The continuous inhibitor's dose and product rates |
FAL_SIMax |
Scale!$B$38 |
Highest index anywhere |
FAL_SO4M |
Scale!$B$29 |
Sulfate in the mix, mg/L |
FAL_ScaleRangeCheck |
Scale!$B$47 |
Scale range verdict |
FAL_ScaleRangeCheckNote |
Scale!$C$47 |
Scale range comment |
FAL_ScaleTendencyCheck |
Scale!$B$48 |
Scale tendency verdict |
FAL_ScaleTendencyCheckNote |
Scale!$C$48 |
Scale tendency comment |
FAL_SrM |
Scale!$B$27 |
Strontium in the mix, mg/L |
FAL_Step |
Scale!$B$52 |
Injection water step of the mixing table, % |
FAL_TMax |
Scale!$B$54 |
Highest temperature Oddo and Tomson fitted, 200 C, °F |
FAL_TMin |
Scale!$B$53 |
Lowest temperature Oddo and Tomson fitted, 0 C, °F |
FAL_Volume |
Scale!$B$43 |
Product by volume, the pump's rate, gal/d |
FAR_Checks |
Risk!$B$32 |
The risk register check |
FAR_ChecksNote |
Risk!$C$32 |
The risk register check comment |
FAR_CorrCons |
Risk!$B$18 |
Consequence, what it costs if it happens |
FAR_CorrHigh |
Risk!$B$49 |
Wall loss over the allowance at which the attack is likely |
FAR_CorrLike |
Risk!$B$17 |
Likelihood, from the wall loss over the allowance |
FAR_CorrMargin |
Risk!$B$16 |
Margin: the wall lost over the life, over the allowance |
FAR_CorrMed |
Risk!$B$50 |
Wall loss over the allowance at which the attack is possible |
FAR_CorrRating |
Risk!$B$20 |
Rating |
FAR_CorrScore |
Risk!$B$19 |
Score, likelihood times consequence |
FAR_CorrSevere |
Risk!$B$48 |
Wall loss over the allowance at which the attack is certain |
FAR_EroCons |
Risk!$B$24 |
Consequence, what it costs if it happens |
FAR_EroHigh |
Risk!$B$52 |
Velocity ratio at which the wall is close to eroding |
FAR_EroLike |
Risk!$B$23 |
Likelihood, from the velocity ratio |
FAR_EroLow |
Risk!$B$54 |
Velocity ratio below which erosion is unlikely |
FAR_EroMargin |
Risk!$B$22 |
Margin: the velocity ratio, V over Ve |
FAR_EroMed |
Risk!$B$53 |
Velocity ratio at which the wall is worth watching |
FAR_EroRating |
Risk!$B$26 |
Rating |
FAR_EroScore |
Risk!$B$25 |
Score, likelihood times consequence |
FAR_EroSevere |
Risk!$B$51 |
Velocity ratio at which the wall erodes |
FAR_HighMax |
Risk!$B$43 |
Highest score still rated High |
FAR_HydCons |
Risk!$B$6 |
Consequence, what it costs if it happens |
FAR_HydGood |
Risk!$B$44 |
Hydrate margin above which the threat is unlikely, °F |
FAR_HydLike |
Risk!$B$5 |
Likelihood, from the margin |
FAR_HydMargin |
Risk!$B$4 |
Margin: the least margin off the hydrate curve, °F |
FAR_HydRating |
Risk!$B$8 |
Rating |
FAR_HydScore |
Risk!$B$7 |
Score, likelihood times consequence |
FAR_LowMax |
Risk!$B$41 |
Highest score still rated Low |
FAR_Lv1 |
Risk!$B$36 |
Likelihood level, the lowest |
FAR_Lv2 |
Risk!$B$37 |
Likelihood level |
FAR_Lv3 |
Risk!$B$38 |
Likelihood level |
FAR_Lv4 |
Risk!$B$39 |
Likelihood level |
FAR_Lv5 |
Risk!$B$40 |
Likelihood level, the highest |
FAR_MedMax |
Risk!$B$42 |
Highest score still rated Medium |
FAR_Results |
Risk!$B$4:$B$26 |
Each threat's margin, likelihood, consequence, score and rating |
FAR_Results2 |
Risk!$B$28:$B$29 |
The highest score on the register and the overall rating |
FAR_RiskCheck |
Risk!$B$32 |
Risk register verdict |
FAR_RiskCheckNote |
Risk!$C$32 |
Risk register comment |
FAR_ScaleCons |
Risk!$B$12 |
Consequence, what it costs if it happens |
FAR_ScaleHigh |
Risk!$B$46 |
Saturation index at which scaling is likely |
FAR_ScaleLike |
Risk!$B$11 |
Likelihood, from the index |
FAR_ScaleLow |
Risk!$B$47 |
Saturation index below which scaling is unlikely |
FAR_ScaleMargin |
Risk!$B$10 |
Margin: the worst saturation index anywhere |
FAR_ScaleRating |
Risk!$B$14 |
Rating |
FAR_ScaleScore |
Risk!$B$13 |
Score, likelihood times consequence |
FAR_ScaleSevere |
Risk!$B$45 |
Saturation index at which scaling is certain |
FAR_TopRating |
Risk!$B$29 |
The overall rating |
FAR_TopScore |
Risk!$B$28 |
Highest score on the register |
FAS_BaF |
System!$B$39 |
Barium in the formation water, mg/L |
FAS_BaI |
System!$B$47 |
Barium in the injection water, mg/L |
FAS_Bore |
System!$B$20 |
Flowline bore, in |
FAS_CAmax |
System!$B$60 |
Corrosion allowance for carbon steel, mm |
FAS_CCorr |
System!$B$68 |
Consequence of CO2 corrosion of the line |
FAS_CEro |
System!$B$69 |
Consequence of erosion of the line |
FAS_CHyd |
System!$B$66 |
Consequence of hydrates blocking the line |
FAS_CO2 |
System!$B$9 |
CO2 mole fraction in the gas, % |
FAS_CO2Mix |
System!$B$33 |
CO2 partial pressure there, psia |
FAS_CO2Res |
System!$B$27 |
CO2 partial pressure at the reservoir, psia |
FAS_CO2Surf |
System!$B$30 |
CO2 partial pressure at the separator, psia |
FAS_CScale |
System!$B$67 |
Consequence of scale in the produced water |
FAS_CaF |
System!$B$36 |
Calcium in the formation water, mg/L |
FAS_CaI |
System!$B$44 |
Calcium in the injection water, mg/L |
FAS_Cont |
System!$B$63 |
Continuous service |
FAS_Corr |
System!$B$64 |
Corrosive gas and not inhibited |
FAS_Eff |
System!$B$58 |
Corrosion inhibitor efficiency |
FAS_Frac |
System!$B$34 |
Injection water in the design mix, by volume, % |
FAS_H2S |
System!$B$10 |
H2S in the gas, ppm |
FAS_HCO3F |
System!$B$41 |
Bicarbonate in the formation water, mg/L |
FAS_HCO3I |
System!$B$49 |
Bicarbonate in the injection water, mg/L |
FAS_Inputs |
System!$B$4:$B$69 |
The system: the stream, the line, the waters, the management, the service and the consequences |
FAS_IonF |
System!$B$42 |
Ionic strength of the formation water, mol/L |
FAS_IonI |
System!$B$50 |
Ionic strength of the injection water, mol/L |
FAS_L |
System!$B$18 |
Flowline length along the route, ft |
FAS_Life |
System!$B$59 |
Design life, years |
FAS_MIC |
System!$B$54 |
Minimum inhibitor concentration from its test, ppm |
FAS_Margin |
System!$B$21 |
Margin off the hydrate curve the line must keep, °F |
FAS_MeOH |
System!$B$22 |
Methanol in the free water, wt % |
FAS_MgF |
System!$B$37 |
Magnesium in the formation water, mg/L |
FAS_MgI |
System!$B$45 |
Magnesium in the injection water, mg/L |
FAS_P |
System!$B$13 |
Wellhead pressure, absolute, psia |
FAS_PMix |
System!$B$32 |
Pressure where they arrive mixed, absolute, psia |
FAS_PRes |
System!$B$26 |
Reservoir pressure, absolute, psia |
FAS_PSurf |
System!$B$29 |
Separator pressure, absolute, psia |
FAS_Parr |
System!$B$14 |
Arrival pressure at the facility, absolute, psia |
FAS_Ph |
System!$B$11 |
In-situ pH of the produced water, pH |
FAS_Pshut |
System!$B$19 |
Shut-in settle-out pressure, absolute, psia |
FAS_Qg |
System!$B$4 |
Gas rate, MMscf/d |
FAS_Qo |
System!$B$5 |
Oil rate, STB/d |
FAS_Qw |
System!$B$6 |
Water rate, STB/d |
FAS_QwS |
System!$B$52 |
Water rate treated, STB/d |
FAS_Ratio |
System!$B$23 |
Methanol vapour-to-liquid ratio, from the GPSA chart, lb/MMscf per wt % |
FAS_SG |
System!$B$7 |
Gas specific gravity (air = 1), air = 1 |
FAS_SGL |
System!$B$8 |
Liquid specific gravity, oil and water blended, water = 1 |
FAS_SGi |
System!$B$55 |
Inhibitor product specific gravity, water = 1 |
FAS_SGw |
System!$B$53 |
Water specific gravity, water = 1 |
FAS_SIQual |
System!$B$56 |
Highest saturation index the test qualified it at |
FAS_SO4F |
System!$B$40 |
Sulfate in the formation water, mg/L |
FAS_SO4I |
System!$B$48 |
Sulfate in the injection water, mg/L |
FAS_Sand |
System!$B$62 |
Sand or other solids produced |
FAS_SrF |
System!$B$38 |
Strontium in the formation water, mg/L |
FAS_SrI |
System!$B$46 |
Strontium in the injection water, mg/L |
FAS_TMix |
System!$B$31 |
Temperature where the waters arrive mixed, °F |
FAS_TRes |
System!$B$25 |
Reservoir temperature, °F |
FAS_TSurf |
System!$B$28 |
Separator temperature, °F |
FAS_Tarr |
System!$B$16 |
Arrival temperature, the coldest point, °F |
FAS_Tin |
System!$B$15 |
Wellhead temperature, °F |
FAS_Tsea |
System!$B$17 |
Seabed temperature, which the line cools toward, °F |
FAX_Checks |
Summary!$B$14:$B$20 |
Every check |
FAX_Corrosion |
Summary!$B$8 |
CO2 corrosion rate, bare carbon steel, mm/yr |
FAX_Erosion |
Summary!$B$10 |
Erosion velocity ratio, V over Ve |
FAX_HydMargin |
Summary!$B$4 |
Least margin off the hydrate curve, °F |
FAX_MeOHNeed |
Summary!$B$5 |
Methanol needed for the margin, wt % |
FAX_MeOHTotal |
Summary!$B$6 |
Methanol injection rate, total, gal/d |
FAX_Overall |
Summary!$B$13 |
Overall verdict |
FAX_OverallNote |
Summary!$C$13 |
Overall comment |
FAX_Results |
Summary!$B$4:$B$11 |
The screen's headline results and the overall risk rating |
FAX_Risk |
Summary!$B$11 |
The overall risk rating |
FAX_Scale |
Summary!$B$7 |
Worst scale saturation index |
FAX_Verdict |
Summary!$B$13:$B$13 |
The overall verdict |
FAX_Wall |
Summary!$B$9 |
Wall lost over the design life, bare steel, mm |
Details
| Opens in | Needs the Petroleum Office add-in: its PO functions show #NAME? without it once Excel recalculates. Needs Microsoft 365 or Excel 2024: it uses functions Excel 2016 doesn't have, such as named LAMBDAs, which show #NAME? there. |
| File | FlowAssuranceScreening.xlsx, 64 KB |
| Category | Production |
| For agents and tools | Descriptor (.md) |