CO2 Storage Screening

Description
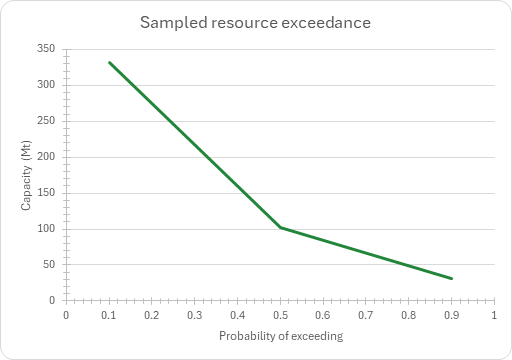
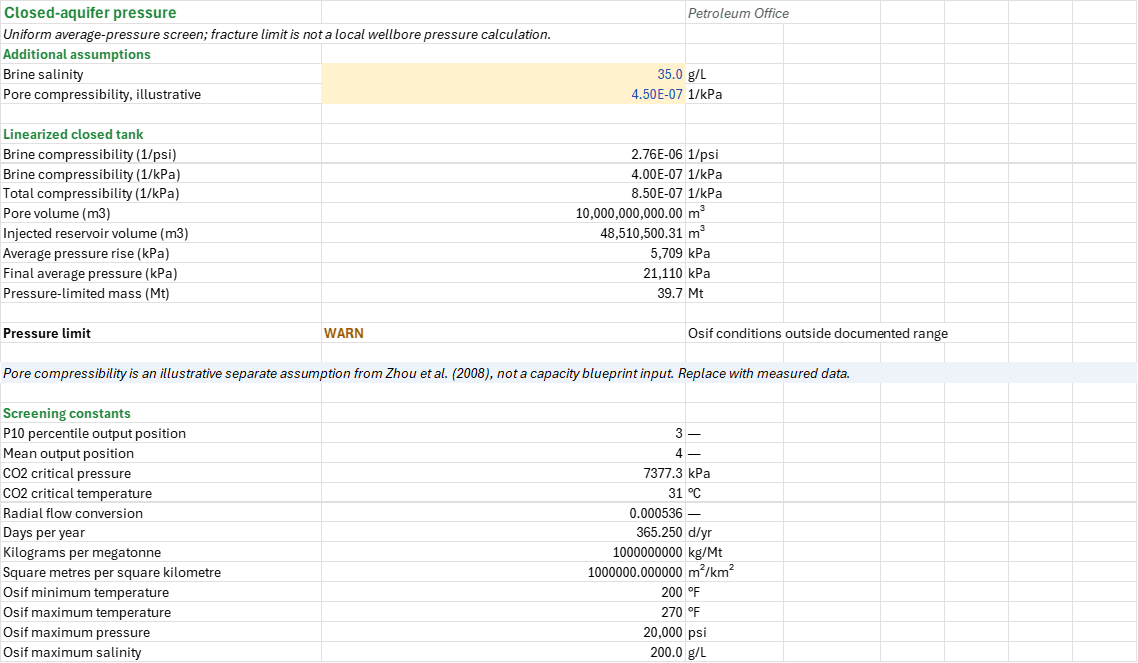
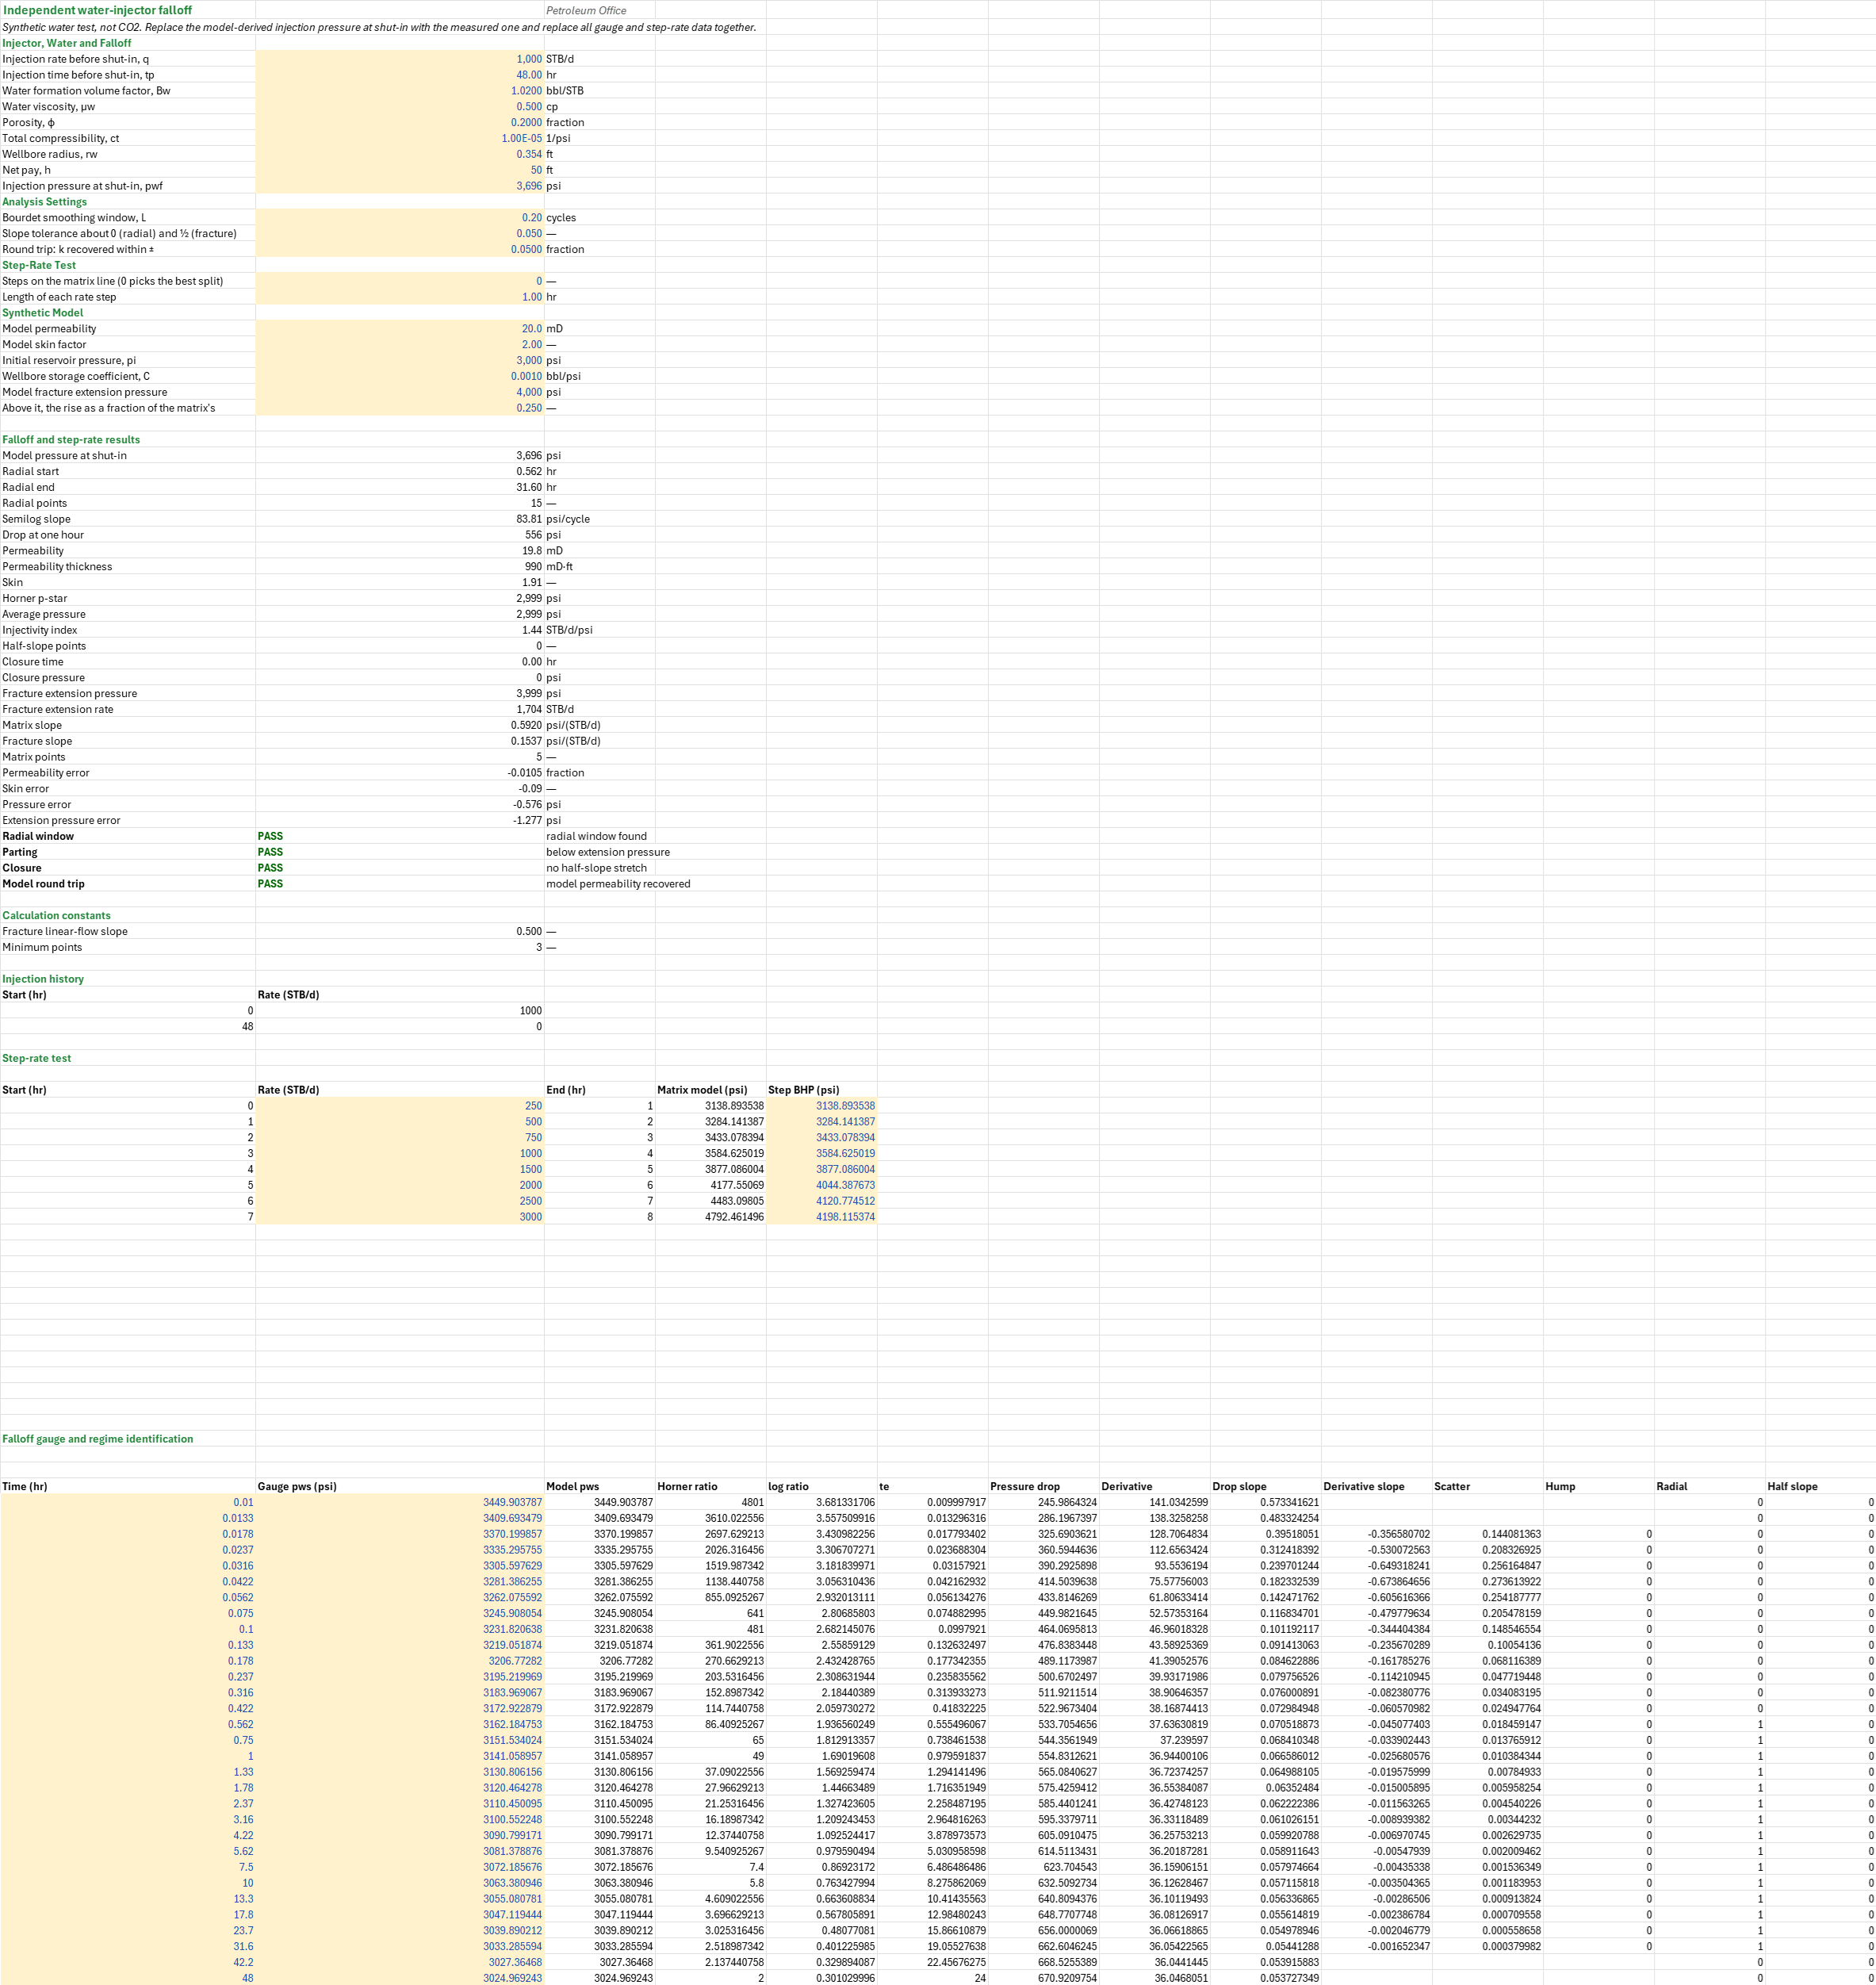
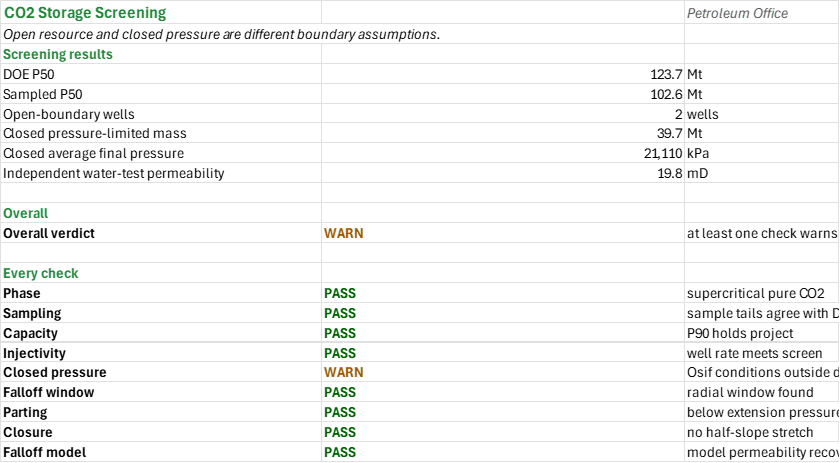
How much CO2 can a saline formation hold, how many wells does a project need to inject it, and does the average pressure stay below the fracture limit if the formation is closed? You enter the formation, its gradients, the storage efficiency percentiles and the injection plan. You read off the DOE and sampled P90, P50 and P10 resource, the wells needed, the closed-aquifer pressure rise and pressure-limited mass, and, from a separate water-injector test, permeability, skin and fracture extension pressure. Metric units; the falloff test is in field units.
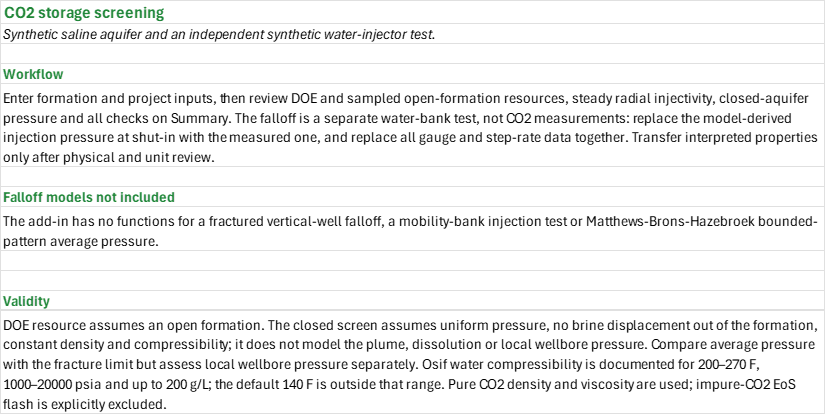
How to use it: Enter the formation and project on the Formation and trials sheet; the pure-CO2 density and viscosity are worked out at the formation pressure and temperature. Read the DOE efficiency percentiles and the sampled exceedance percentiles on the Capacity sheet, then the steady radial screen on the Injectivity sheet. Enter the brine salinity and the site pore compressibility on the Closed pressure sheet and compare the final average pressure with the fracture-pressure limit. On the Falloff sheet, replace the model-derived injection pressure at shut-in with the measured one, and replace the synthetic water-injector gauge and step-rate data together; carry an interpreted permeability or skin across only after a unit and physical review. The Summary lists every check under one verdict. All inputs are illustrative and must be replaced for a real project.
Method: The formation pressure is 101.325 kPa plus the pore-pressure gradient times depth, and the temperature the surface temperature plus the geothermal gradient times depth. The DOE prospective resource of an open formation is G = A h φ ρCO2 E, with ρCO2 the pure-CO2 density (Span-Wagner) and E the storage efficiency. The efficiency is lognormal through the entered 10th and 90th percentiles, ln-mean (ln E10 + ln E90)/2 and ln-standard deviation (ln E90 − ln E10)/(2 z0.9), and deterministic stratified trials of it give the sampled exceedance percentiles. The injectivity screen is steady radial flow, q = 0.000535768 k krCO2 hinj Δp/(μ ln(re/rw)) in reservoir m3/d, with Δp the margin from the formation pressure to the allowed fraction of the fracture pressure and μ the CO2 viscosity (Fenghour); the mass rate per well is q ρCO2 × 365.25 days a year, and the wells are the project rate over it, rounded up. The closed-aquifer screen divides the injected reservoir volume by the pore volume times the total compressibility, the brine compressibility (Osif) plus the pore compressibility, to give a uniform average pressure rise; the pressure-limited mass is the margin to the limit times the pore volume, the total compressibility and the density. The independent water-injector example picks the radial window where the Bourdet derivative is flat, fits an MDH line to it for permeability and skin, takes Horner p* as the average pressure, flags a half-slope stretch as possible closure, and fits matrix and fracture lines to the step-rate test for the fracture extension pressure and rate.
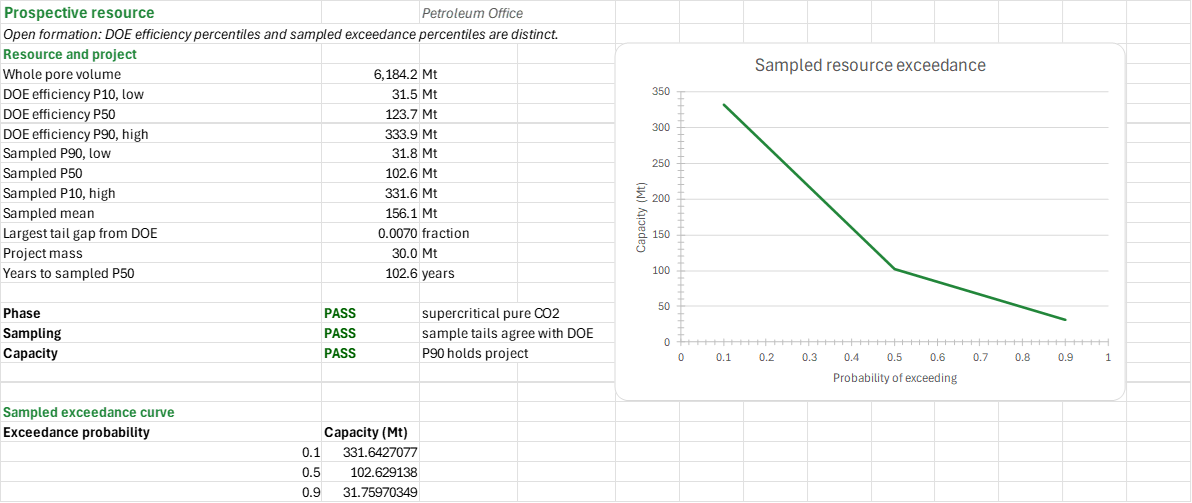
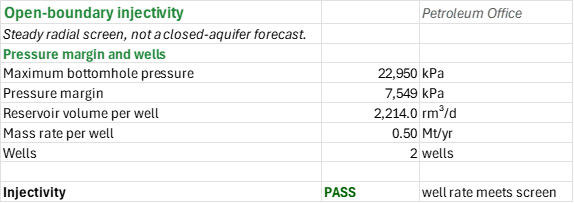
Example: For the synthetic 500 km² formation at 1,500 m, the pure-CO2 density is approximately 618.42 kg/m³, the DOE median resource is 123.68 Mt, and the sampled P50 is 102.63 Mt. The open-boundary injectivity screen needs two wells for the 1 Mt/yr project. The closed screen gives a 5,709 kPa average rise, 21,110 kPa final average pressure and 39.7 Mt pressure-limited mass; it warns that the default temperature is outside Osif's documented range. These numbers are illustrative, not a site assessment.
Validity
DOE resource is an open-formation prospective-resource estimate, not a closed pressure-limited capacity. The injectivity calculation assumes steady radial open-boundary flow and is not a closed pressure forecast. The closed screen assumes uniform pressure, no brine escape or displacement out of the formation, and constant density and compressibility; locally, injected CO2 displaces and compresses brine. Compare the average pressure with the fracture limit, but assess local wellbore pressure, geomechanics, plume migration, dissolution and brine migration separately. Osif's correlation is documented for 200–270°F, 1,000–20,000 psia and up to 200 g/L; the illustrative 140°F default is outside that temperature range and the pressure check warns. Near-critical pure-CO2 properties can be sensitive. Impure-CO2 equation-of-state flash is excluded. The water falloff and step-rate test is independent and is not a CO2 injection test. The add-in has no functions for a fractured vertical-well falloff model, a mobility-bank injection test, or Matthews–Brons–Hazebroek bounded-pattern average pressure.
References
- DOE/NETL (2017). Carbon Dioxide Storage Resource Assessment Methodology. https://netl.doe.gov/sites/default/files/2018-10/CO2-SRU-Methodology-2017.pdf
- Zhou, Q., Birkholzer, J.T., Tsang, C.-F. and Rutqvist, J. (2008). A method for quick assessment of CO2 storage capacity in closed and semi-closed saline formations. International Journal of Greenhouse Gas Control, https://doi.org/10.1016/j.ijggc.2008.02.004 . The illustrative pore compressibility of 4.5e-10 Pa⁻¹ (4.5e-7 kPa⁻¹) is a separate literature assumption; replace it with site data.
- Osif, T.L. (1988). The Effects of Salt, Gas, Temperature, and Pressure on the Compressibility of Water. SPE Reservoir Engineering, SPE 16639.
- Earlougher, R.C. Jr. (1977). Advances in Well Test Analysis. SPE Monograph 5.
Inputs
| Input | Unit | Default | Name |
|---|---|---|---|
| Formation area assessed | km² | 500 | CCC_Area |
| Gross thickness | m | 100 | CCC_H |
| Total porosity | fraction | 0.2 | CCC_Phi |
| Depth to the middle of the formation | m | 1,500 | CCC_Z |
| Pore-pressure gradient (hydrostatic brine) | kPa/m | 10.2 | CCC_PGrad |
| Mean surface (or seabed) temperature | °C | 15 | CCC_TSurf |
| Geothermal gradient | °C/km | 30 | CCC_TGrad |
| Storage efficiency, 10th, 50th and 90th percentile | fraction | 0.0051, 0.02, 0.054 | CCC_E10, CCC_E50, CCC_E90 |
| Permeability | mD | 20 | CCC_K |
| CO2 relative permeability at the residual brine | fraction | 0.4 | CCC_Kr |
| Net thickness open to injection | m | 30 | CCC_HInj |
| Fracture-pressure gradient | kPa/m | 17 | CCC_FGrad |
| Fraction of the fracture pressure the well may reach | — | 0.9 | CCC_SF |
| Radius the pressure is held at the reservoir pressure | m | 1,000 | CCC_Re |
| Wellbore radius | m | 0.1 | CCC_Rw |
| Project injection rate | Mt/yr | 1 | CCC_Rate |
| Project injection period | years | 30 | CCC_Years |
| Number of trials, 10 to 1,000 | — | 300 | CCC_n |
| Permutation multiplier, no factor in common with the trials | — | 7 | CCC_Mult |
| Fewest trials for stable percentiles | — | 100 | CCC_NMin |
| Largest gap between the sampled and the DOE P90 and P10 | fraction | 0.02 | CCC_Tol |
| Lowest injection rate per well worth drilling for | Mt/yr | 0.25 | CCC_MinRate |
| Brine salinity | g/L | 35 | CCP_Salinity |
| Pore compressibility, illustrative | 1/kPa | 0.00000045 | CCP_Cf |
| Injection rate before shut-in | STB/d | 1,000 | CCT_q |
| Injection time before shut-in | h | 48 | CCT_tp |
| Water formation volume factor | bbl/STB | 1.02 | CCT_Bw |
| Water viscosity | cP | 0.5 | CCT_mu |
| Porosity | fraction | 0.2 | CCT_phi |
| Total compressibility | 1/psi | 1e-5 | CCT_ct |
| Wellbore radius | ft | 0.354 | CCT_rw |
| Net pay | ft | 50 | CCT_h |
| Injection pressure at shut-in | psi | model pressure at shut-in | CCT_Pwf |
| Bourdet smoothing window | log cycles | 0.2 | CCT_L |
| Slope tolerance about 0 (radial) and ½ (fracture) | — | 0.05 | CCT_Tol |
| Round trip: k recovered within ± | fraction | 0.05 | CCT_KTol |
| Steps on the matrix line (0 picks the best split) | — | 0 | CCT_nlow |
| Length of each rate step | h | 1 | CCT_StepHr |
| Model permeability | mD | 20 | CCT_ModelK |
| Model skin factor | — | 2 | CCT_ModelS |
| Initial reservoir pressure | psi | 3,000 | CCT_Pi |
| Wellbore storage coefficient | bbl/psi | 0.001 | CCT_C |
| Model fracture extension pressure | psi | 4,000 | CCT_ModelPfe |
| Above it, the rise as a fraction of the matrix's | — | 0.25 | CCT_Frac |
The Falloff sheet also holds the editable step rates (250 to 3,000 STB/d in eight steps) and the falloff gauge pressures.
Sheets
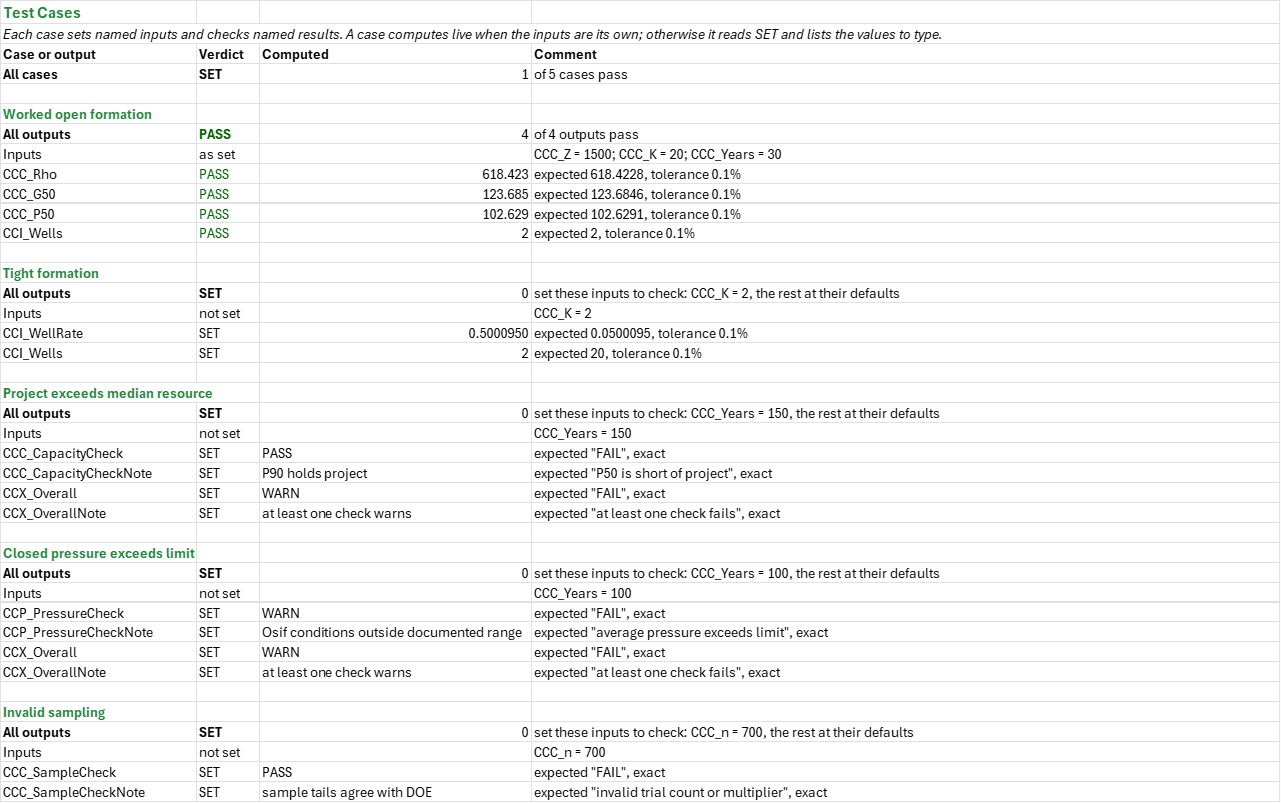
Guide— the workflow, the falloff models not included and the limits of the screen.Formation and trials— the formation, project and sampling inputs; the formation pressure and temperature, the pure-CO2 density and viscosity, the lognormal efficiency; and the deterministic stratified trials.Capacity— the whole-pore-volume mass, the DOE P10, P50 and P90 resource, the sampled P90, P50, P10 and mean, the years to fill the sampled P50, the phase, sampling and capacity checks, and the sampled exceedance curve.Injectivity— the pressure margin to the allowed fracture pressure, the reservoir volume and mass rate per well, and the wells needed.Closed pressure— brine and total compressibility, pore volume, injected reservoir volume, the average pressure rise, the final average pressure and the pressure-limited mass against the fracture limit.Falloff— an independent synthetic water-injector falloff and step-rate test: the radial window, semilog slope, permeability, skin, Horner p*, injectivity index, possible closure, and the fracture extension pressure and rate.Summary— the screening results and every check under one verdict.Test Cases— the worked example and other cases, with expected and computed results.
Functions used
Names (167)
| Name | Refers to | Comment |
|---|---|---|
PO.CCS.Capacity.DOELAMBDA |
=LAMBDA(Area, H, Phi, Rho, E, Area*H*Phi*Rho*E/1000) |
CO2 storage capacity of a saline formation, Mt, by the DOE/NETL volumetric method: area (km2) x gross thickness (m) x total porosity x CO2 density (kg/m3) x storage efficiency E. |
PO.PTA.MDH.FitLAMBDA |
=LAMBDA(t, dp, q, B, mu, h, phi, ct, rw, output, LET(x, LOG10(t), m, SLOPE(dp, x), dp_1h, INTERCEPT(dp, x), perm, 162.6*q*B*mu/(m*h), skin, 1.151*(dp_1h/m-LOG10(perm/(phi*mu*ct*rw^2))+3.23), IF(m<=0, NA(), IF(output="k", perm, IF(output="S", skin, IF(output="m", m, IF(output="dp1h", dp_1h, NA()))))))) |
MDH semilog straight-line fit of a drawdown: least squares of Δp against log10(t) over the points given; output "k" [mD], "S" [dimensionless], "m" [psi/cycle] or "dp1h" [psi], the line's Δp at 1 h. |
PO.PTA.StepRate.FitLAMBDA |
=LAMBDA(q, p, nlow, output, LET(cnt, ROWS(q), qa, AVERAGE(q), pa, AVERAGE(p), qc, q-qa, pc, p-pa, ix, SEQUENCE(cnt), kk, SEQUENCE(cnt-3, 1, 2), msk, --(TRANSPOSE(ix)<=kk), nlo, kk, nhi, cnt-kk, sxlo, MMULT(msk, qc), sylo, MMULT(msk, pc), sxxlo, MMULT(msk, qc^2), sxylo, MMULT(msk, qc*pc), syylo, MMULT(msk, pc^2), sxhi, SUM(qc)-sxlo, syhi, SUM(pc)-sylo, sxxhi, SUM(qc^2)-sxxlo, sxyhi, SUM(qc*pc)-sxylo, syyhi, SUM(pc^2)-syylo, cxxlo, sxxlo-sxlo^2/nlo, cxylo, sxylo-sxlo*sylo/nlo, cxxhi, sxxhi-sxhi^2/nhi, cxyhi, sxyhi-sxhi*syhi/nhi, sse, syylo-sylo^2/nlo-cxylo^2/cxxlo+syyhi-syhi^2/nhi-cxyhi^2/cxxhi, pick, IF(nlow>0, nlow, MIN(IF(sse=MIN(sse), kk, cnt))), sel, --(kk=pick), slo, SUM(sel*cxylo/cxxlo), shi, SUM(sel*cxyhi/cxxhi), ilo, SUM(sel*(sylo-slo*sxlo)/nlo), ihi, SUM(sel*(syhi-shi*sxhi)/nhi), qx, IF(slo>shi, (ihi-ilo)/(slo-shi), 0), IF(OR(cnt<5, nlow<0, nlow=1, nlow>cnt-2, slo<=shi), NA(), IF(output="p", pa+ilo+slo*qx, IF(output="q", qa+qx, IF(output="mlo", slo, IF(output="mhi", shi, IF(output="n", pick, NA())))))))) |
Two-line step-rate test fit: least squares of the matrix and the fracture lines, split at nlow points (0 picks the split of least total squared error); output "p" extension pressure, "q" extension rate, "mlo", "mhi" slopes or "n" split. |
PO.RES.MC.PercentilesLAMBDA |
=LAMBDA(X, HSTACK(PERCENTILE.INC(X, 0.1), PERCENTILE.INC(X, 0.5), PERCENTILE.INC(X, 0.9), AVERAGE(X))) |
P90, P50, P10 (petroleum convention: P90 the low case, exceeded 90% of the time) and the mean of a column of outcomes; linear interpolation as PERCENTILE.INC. |
PO.RES.MC.SampleLAMBDA |
=LAMBDA(Dist, Dist_A, Dist_B, Dist_C, n, Mult, Shift, IF(GCD(Mult, n)<>1, NA(), LET(u, (MOD(Mult*(SEQUENCE(n)-1)+Shift, n)+0.5)/n, IF(Dist=1, NORM.INV(u, Dist_A, Dist_B), IF(Dist=2, LOGNORM.INV(u, Dist_A, Dist_B), IF(Dist=3, IF(u<(Dist_B-Dist_A)/(Dist_C-Dist_A), Dist_A+SQRT(u*(Dist_C-Dist_A)*(Dist_B-Dist_A)), Dist_C-SQRT((1-u)*(Dist_C-Dist_A)*(Dist_C-Dist_B))), IF(Dist=4, Dist_A+u*(Dist_B-Dist_A), NA()))))))) |
Deterministic stratified (Latin-hypercube) sample of n values: Dist 1 normal, 2 lognormal, 3 triangular, 4 uniform; strata shuffled by MOD(Mult*(i-1)+Shift, n). Inputs independent. |
CCC_Area |
'Formation and trials'!$B$4 |
Formation area assessed, km² |
CCC_CapacityCheck |
Capacity!$B$18 |
Capacity verdict |
CCC_CapacityCheckNote |
Capacity!$C$18 |
Capacity comment |
CCC_Curve |
Capacity!$A$23:$B$25 |
Sampled exceedance percentiles |
CCC_Dev |
Capacity!$B$12 |
Largest tail gap from DOE, % |
CCC_E10 |
'Formation and trials'!$B$11 |
Storage efficiency, 10th percentile (the DOE's P10, low), % |
CCC_E50 |
'Formation and trials'!$B$12 |
Storage efficiency, 50th percentile, % |
CCC_E90 |
'Formation and trials'!$B$13 |
Storage efficiency, 90th percentile (the DOE's P90, high), % |
CCC_EMedian |
'Formation and trials'!$B$45 |
Lognormal median efficiency, % |
CCC_F0 |
'Formation and trials'!$B$32 |
Fahrenheit at zero Celsius, F |
CCC_FGrad |
'Formation and trials'!$B$17 |
Fracture-pressure gradient, kPa/m |
CCC_FPerC |
'Formation and trials'!$B$31 |
Fahrenheit degrees per Celsius degree, F/C |
CCC_Fill |
Capacity!$B$4 |
Whole pore volume, Mt |
CCC_FillYears |
Capacity!$B$14 |
Years to sampled P50, years |
CCC_G10 |
Capacity!$B$5 |
DOE efficiency P10, low, Mt |
CCC_G50 |
Capacity!$B$6 |
DOE efficiency P50, Mt |
CCC_G90 |
Capacity!$B$7 |
DOE efficiency P90, high, Mt |
CCC_H |
'Formation and trials'!$B$5 |
Gross thickness, m |
CCC_HInj |
'Formation and trials'!$B$16 |
Net thickness open to injection, m |
CCC_Inputs |
'Formation and trials'!$B$4:$B$27 |
The formation's area, thickness, porosity and depth, its pressure and temperature gradients, the efficiency's percentiles, the injectivity inputs, the project's rate and period, the trials and the check limits |
CCC_K |
'Formation and trials'!$B$14 |
Permeability, mD |
CCC_KPaPsi |
'Formation and trials'!$B$30 |
Kilopascals per psi, kPa/psi |
CCC_Kr |
'Formation and trials'!$B$15 |
CO2 relative permeability at the residual brine, frac |
CCC_LnMu |
'Formation and trials'!$B$43 |
Mean of ln efficiency |
CCC_LnSigma |
'Formation and trials'!$B$44 |
Standard deviation of ln efficiency |
CCC_Mean |
Capacity!$B$11 |
Sampled mean, Mt |
CCC_MinRate |
'Formation and trials'!$B$27 |
Lowest injection rate per well worth drilling for, Mt/yr |
CCC_Mu |
'Formation and trials'!$B$42 |
Pure CO2 viscosity, Fenghour, mPa·s |
CCC_Mult |
'Formation and trials'!$B$24 |
Permutation multiplier a, no factor in common with n |
CCC_NMin |
'Formation and trials'!$B$25 |
Fewest trials for stable percentiles |
CCC_Need |
Capacity!$B$13 |
Project mass, Mt |
CCC_P |
'Formation and trials'!$B$37 |
Absolute pressure, kPa |
CCC_P10 |
Capacity!$B$10 |
Sampled P10, high, Mt |
CCC_P50 |
Capacity!$B$9 |
Sampled P50, Mt |
CCC_P90 |
Capacity!$B$8 |
Sampled P90, low, Mt |
CCC_PGrad |
'Formation and trials'!$B$8 |
Pore-pressure gradient (hydrostatic brine), kPa/m |
CCC_Patm |
'Formation and trials'!$B$29 |
Atmospheric pressure, kPa |
CCC_PhaseCheck |
Capacity!$B$16 |
Phase verdict |
CCC_PhaseCheckNote |
Capacity!$C$16 |
Phase comment |
CCC_Phi |
'Formation and trials'!$B$6 |
Total porosity, % |
CCC_Ppsi |
'Formation and trials'!$B$39 |
Pressure for CO2 UDFs, psia |
CCC_Properties |
'Formation and trials'!$B$37:$B$45 |
Formation conditions and pure CO2 properties |
CCC_Q90 |
'Formation and trials'!$B$34 |
90th percentile probability |
CCC_Rate |
'Formation and trials'!$B$21 |
Project injection rate, Mt/yr |
CCC_Re |
'Formation and trials'!$B$19 |
Radius the pressure is held at the reservoir pressure, m |
CCC_Results |
Capacity!$B$4:$B$18 |
DOE, sampled capacity and checks |
CCC_Rho |
'Formation and trials'!$B$41 |
Pure CO2 density, Span-Wagner, kg/m³ |
CCC_RhoConv |
'Formation and trials'!$B$33 |
Density conversion, kg/m3 per lb/ft3 |
CCC_Rw |
'Formation and trials'!$B$20 |
Wellbore radius, m |
CCC_SF |
'Formation and trials'!$B$18 |
Fraction of the fracture pressure the well may reach |
CCC_SampleCheck |
Capacity!$B$17 |
Sampling verdict |
CCC_SampleCheckNote |
Capacity!$C$17 |
Sampling comment |
CCC_T |
'Formation and trials'!$B$38 |
Temperature, °C |
CCC_TF |
'Formation and trials'!$B$40 |
Temperature for CO2 UDFs, °F |
CCC_TGrad |
'Formation and trials'!$B$10 |
Geothermal gradient, °C/km |
CCC_TSurf |
'Formation and trials'!$B$9 |
Mean surface (or seabed) temperature, °C |
CCC_Tol |
'Formation and trials'!$B$26 |
Largest gap between the sampled and the DOE P90 and P10, % |
CCC_Years |
'Formation and trials'!$B$22 |
Project injection period, years |
CCC_Z |
'Formation and trials'!$B$7 |
Depth to the middle of the formation, m |
CCC_n |
'Formation and trials'!$B$23 |
Number of trials, 10 to 1,000 |
CCI_DP |
Injectivity!$B$5 |
Pressure margin, kPa |
CCI_InjectivityCheck |
Injectivity!$B$10 |
Injectivity verdict |
CCI_InjectivityCheckNote |
Injectivity!$C$10 |
Injectivity comment |
CCI_Pmax |
Injectivity!$B$4 |
Maximum bottomhole pressure, kPa |
CCI_Q |
Injectivity!$B$6 |
Reservoir volume per well, rm³/d |
CCI_Results |
Injectivity!$B$4:$B$10 |
Open-boundary injectivity and check |
CCI_WellRate |
Injectivity!$B$7 |
Mass rate per well, Mt/yr |
CCI_Wells |
Injectivity!$B$8 |
Wells, wells |
CCP_Cf |
'Closed pressure'!$B$5 |
Pore compressibility, illustrative, 1/kPa |
CCP_Ct |
'Closed pressure'!$B$10 |
Total compressibility (1/kPa), 1/kPa |
CCP_Cw |
'Closed pressure'!$B$9 |
Brine compressibility (1/kPa), 1/kPa |
CCP_CwPsi |
'Closed pressure'!$B$8 |
Brine compressibility (1/psi), 1/psi |
CCP_DP |
'Closed pressure'!$B$13 |
Average pressure rise (kPa), kPa |
CCP_Darcy |
'Closed pressure'!$B$26 |
Radial flow conversion |
CCP_DaysYr |
'Closed pressure'!$B$27 |
Days per year, d/yr |
CCP_FinalP |
'Closed pressure'!$B$14 |
Final average pressure (kPa), kPa |
CCP_KgMt |
'Closed pressure'!$B$28 |
Kilograms per megatonne, kg/Mt |
CCP_M2Km2 |
'Closed pressure'!$B$29 |
Square metres per square kilometre, m²/km² |
CCP_MaxMass |
'Closed pressure'!$B$15 |
Pressure-limited mass (Mt), Mt |
CCP_MeanPos |
'Closed pressure'!$B$23 |
Mean output position |
CCP_OsifPMax |
'Closed pressure'!$B$32 |
Osif maximum pressure, psi |
CCP_OsifSalMax |
'Closed pressure'!$B$33 |
Osif maximum salinity, g/L |
CCP_OsifTMax |
'Closed pressure'!$B$31 |
Osif maximum temperature, °F |
CCP_OsifTMin |
'Closed pressure'!$B$30 |
Osif minimum temperature, °F |
CCP_P10Pos |
'Closed pressure'!$B$22 |
P10 percentile output position |
CCP_PV |
'Closed pressure'!$B$11 |
Pore volume (m3), m³ |
CCP_Pc |
'Closed pressure'!$B$24 |
CO2 critical pressure, kPa |
CCP_PressureCheck |
'Closed pressure'!$B$17 |
Pressure limit verdict |
CCP_PressureCheckNote |
'Closed pressure'!$C$17 |
Pressure limit comment |
CCP_Results |
'Closed pressure'!$B$8:$B$17 |
Closed tank compressibility, pressure and limit |
CCP_Salinity |
'Closed pressure'!$B$4 |
Brine salinity, g/L |
CCP_Tc |
'Closed pressure'!$B$25 |
CO2 critical temperature, °C |
CCP_Volume |
'Closed pressure'!$B$12 |
Injected reservoir volume (m3), m³ |
CCT_Bw |
Falloff!$B$6 |
Water formation volume factor, Bw, bbl/STB |
CCT_C |
Falloff!$B$24 |
Wellbore storage coefficient, C, bbl/psi |
CCT_ClosureCheck |
Falloff!$B$55 |
Closure verdict |
CCT_ClosureCheckNote |
Falloff!$C$55 |
Closure comment |
CCT_Data |
Falloff!$A$95:$B$125 |
Falloff time and pressure |
CCT_Dp1h |
Falloff!$B$34 |
Drop at one hour, psi |
CCT_Frac |
Falloff!$B$26 |
Above it, the rise as a fraction of the matrix's |
CCT_Half |
Falloff!$B$59 |
Fracture linear-flow slope |
CCT_II |
Falloff!$B$40 |
Injectivity index, STB/d/psi |
CCT_Inputs |
Falloff!$B$4:$B$26 |
Rate, injection time, water and rock, the pressure at shut-in, the window settings, the step-rate split and step length, and the synthetic model |
CCT_K |
Falloff!$B$35 |
Permeability, mD |
CCT_KErr |
Falloff!$B$49 |
Permeability error, % |
CCT_KTol |
Falloff!$B$16 |
Round trip: k recovered within ±, % |
CCT_Kh |
Falloff!$B$36 |
Permeability thickness, mD·ft |
CCT_L |
Falloff!$B$14 |
Bourdet smoothing window, L, cycles |
CCT_M |
Falloff!$B$33 |
Semilog slope, psi/cycle |
CCT_MHi |
Falloff!$B$47 |
Fracture slope, psi/(STB/d) |
CCT_MLo |
Falloff!$B$46 |
Matrix slope, psi/(STB/d) |
CCT_MinN |
Falloff!$B$60 |
Minimum points |
CCT_ModelK |
Falloff!$B$21 |
Model permeability, mD |
CCT_ModelPfe |
Falloff!$B$25 |
Model fracture extension pressure, psi |
CCT_ModelS |
Falloff!$B$22 |
Model skin factor |
CCT_NHalf |
Falloff!$B$41 |
Half-slope points |
CCT_NLo |
Falloff!$B$48 |
Matrix points |
CCT_NRad |
Falloff!$B$32 |
Radial points |
CCT_PClose |
Falloff!$B$43 |
Closure pressure, psi |
CCT_PErr |
Falloff!$B$51 |
Pressure error, psi |
CCT_PartingCheck |
Falloff!$B$54 |
Parting verdict |
CCT_PartingCheckNote |
Falloff!$C$54 |
Parting comment |
CCT_Pavg |
Falloff!$B$39 |
Average pressure, psi |
CCT_Pfe |
Falloff!$B$44 |
Fracture extension pressure, psi |
CCT_PfeErr |
Falloff!$B$52 |
Extension pressure error, psi |
CCT_Pi |
Falloff!$B$23 |
Initial reservoir pressure, pi, psi |
CCT_Pstar |
Falloff!$B$38 |
Horner p-star, psi |
CCT_Pwf |
Falloff!$B$12 |
Injection pressure at shut-in, pwf, psi |
CCT_PwfModel |
Falloff!$B$29 |
Model pressure at shut-in, psi |
CCT_Qfe |
Falloff!$B$45 |
Fracture extension rate, STB/d |
CCT_RadEnd |
Falloff!$B$31 |
Radial end, hr |
CCT_RadStart |
Falloff!$B$30 |
Radial start, hr |
CCT_Rates |
Falloff!$A$64:$B$65 |
Injection then shut-in |
CCT_Results |
Falloff!$B$29:$B$56 |
Falloff and step-rate results and checks |
CCT_S |
Falloff!$B$37 |
Skin |
CCT_SErr |
Falloff!$B$50 |
Skin error |
CCT_StepHr |
Falloff!$B$19 |
Length of each rate step, hr |
CCT_Steps |
Falloff!$A$70:$B$77 |
Step starts and rates |
CCT_TClose |
Falloff!$B$42 |
Closure time, hr |
CCT_Tol |
Falloff!$B$15 |
Slope tolerance about 0 (radial) and ½ (fracture) |
CCT_TripCheck |
Falloff!$B$56 |
Model round trip verdict |
CCT_TripCheckNote |
Falloff!$C$56 |
Model round trip comment |
CCT_WindowCheck |
Falloff!$B$53 |
Radial window verdict |
CCT_WindowCheckNote |
Falloff!$C$53 |
Radial window comment |
CCT_ct |
Falloff!$B$9 |
Total compressibility, ct, 1/psi |
CCT_h |
Falloff!$B$11 |
Net pay, h, ft |
CCT_mu |
Falloff!$B$7 |
Water viscosity, μw, cp |
CCT_nlow |
Falloff!$B$18 |
Steps on the matrix line (0 picks the best split) |
CCT_phi |
Falloff!$B$8 |
Porosity, φ, % |
CCT_q |
Falloff!$B$4 |
Injection rate before shut-in, q, STB/d |
CCT_rw |
Falloff!$B$10 |
Wellbore radius, rw, ft |
CCT_tp |
Falloff!$B$5 |
Injection time before shut-in, tp, hr |
CCX_Checks |
Summary!$B$15:$B$23 |
Every named analysis check |
CCX_DOE |
Summary!$B$4 |
DOE P50, Mt |
CCX_FinalP |
Summary!$B$8 |
Closed average final pressure, kPa |
CCX_MaxMass |
Summary!$B$7 |
Closed pressure-limited mass, Mt |
CCX_Overall |
Summary!$B$12 |
Overall verdict verdict |
CCX_OverallNote |
Summary!$C$12 |
Overall verdict comment |
CCX_P50 |
Summary!$B$5 |
Sampled P50, Mt |
CCX_Results |
Summary!$B$4:$B$12 |
Headline results and overall verdict |
CCX_TestK |
Summary!$B$9 |
Independent water-test permeability, mD |
CCX_Wells |
Summary!$B$6 |
Open-boundary wells, wells |
Details
| Opens in | Needs the Petroleum Office add-in: its PO functions show #NAME? without it once Excel recalculates. Needs Microsoft 365 or Excel 2024: it uses functions Excel 2016 doesn't have, such as named LAMBDAs, which show #NAME? there. |
| File | Co2Storage.xlsx, 70 KB |
| Category | Reservoir |
| For agents and tools | Descriptor (.md) |