Reserves Screening Report
Description
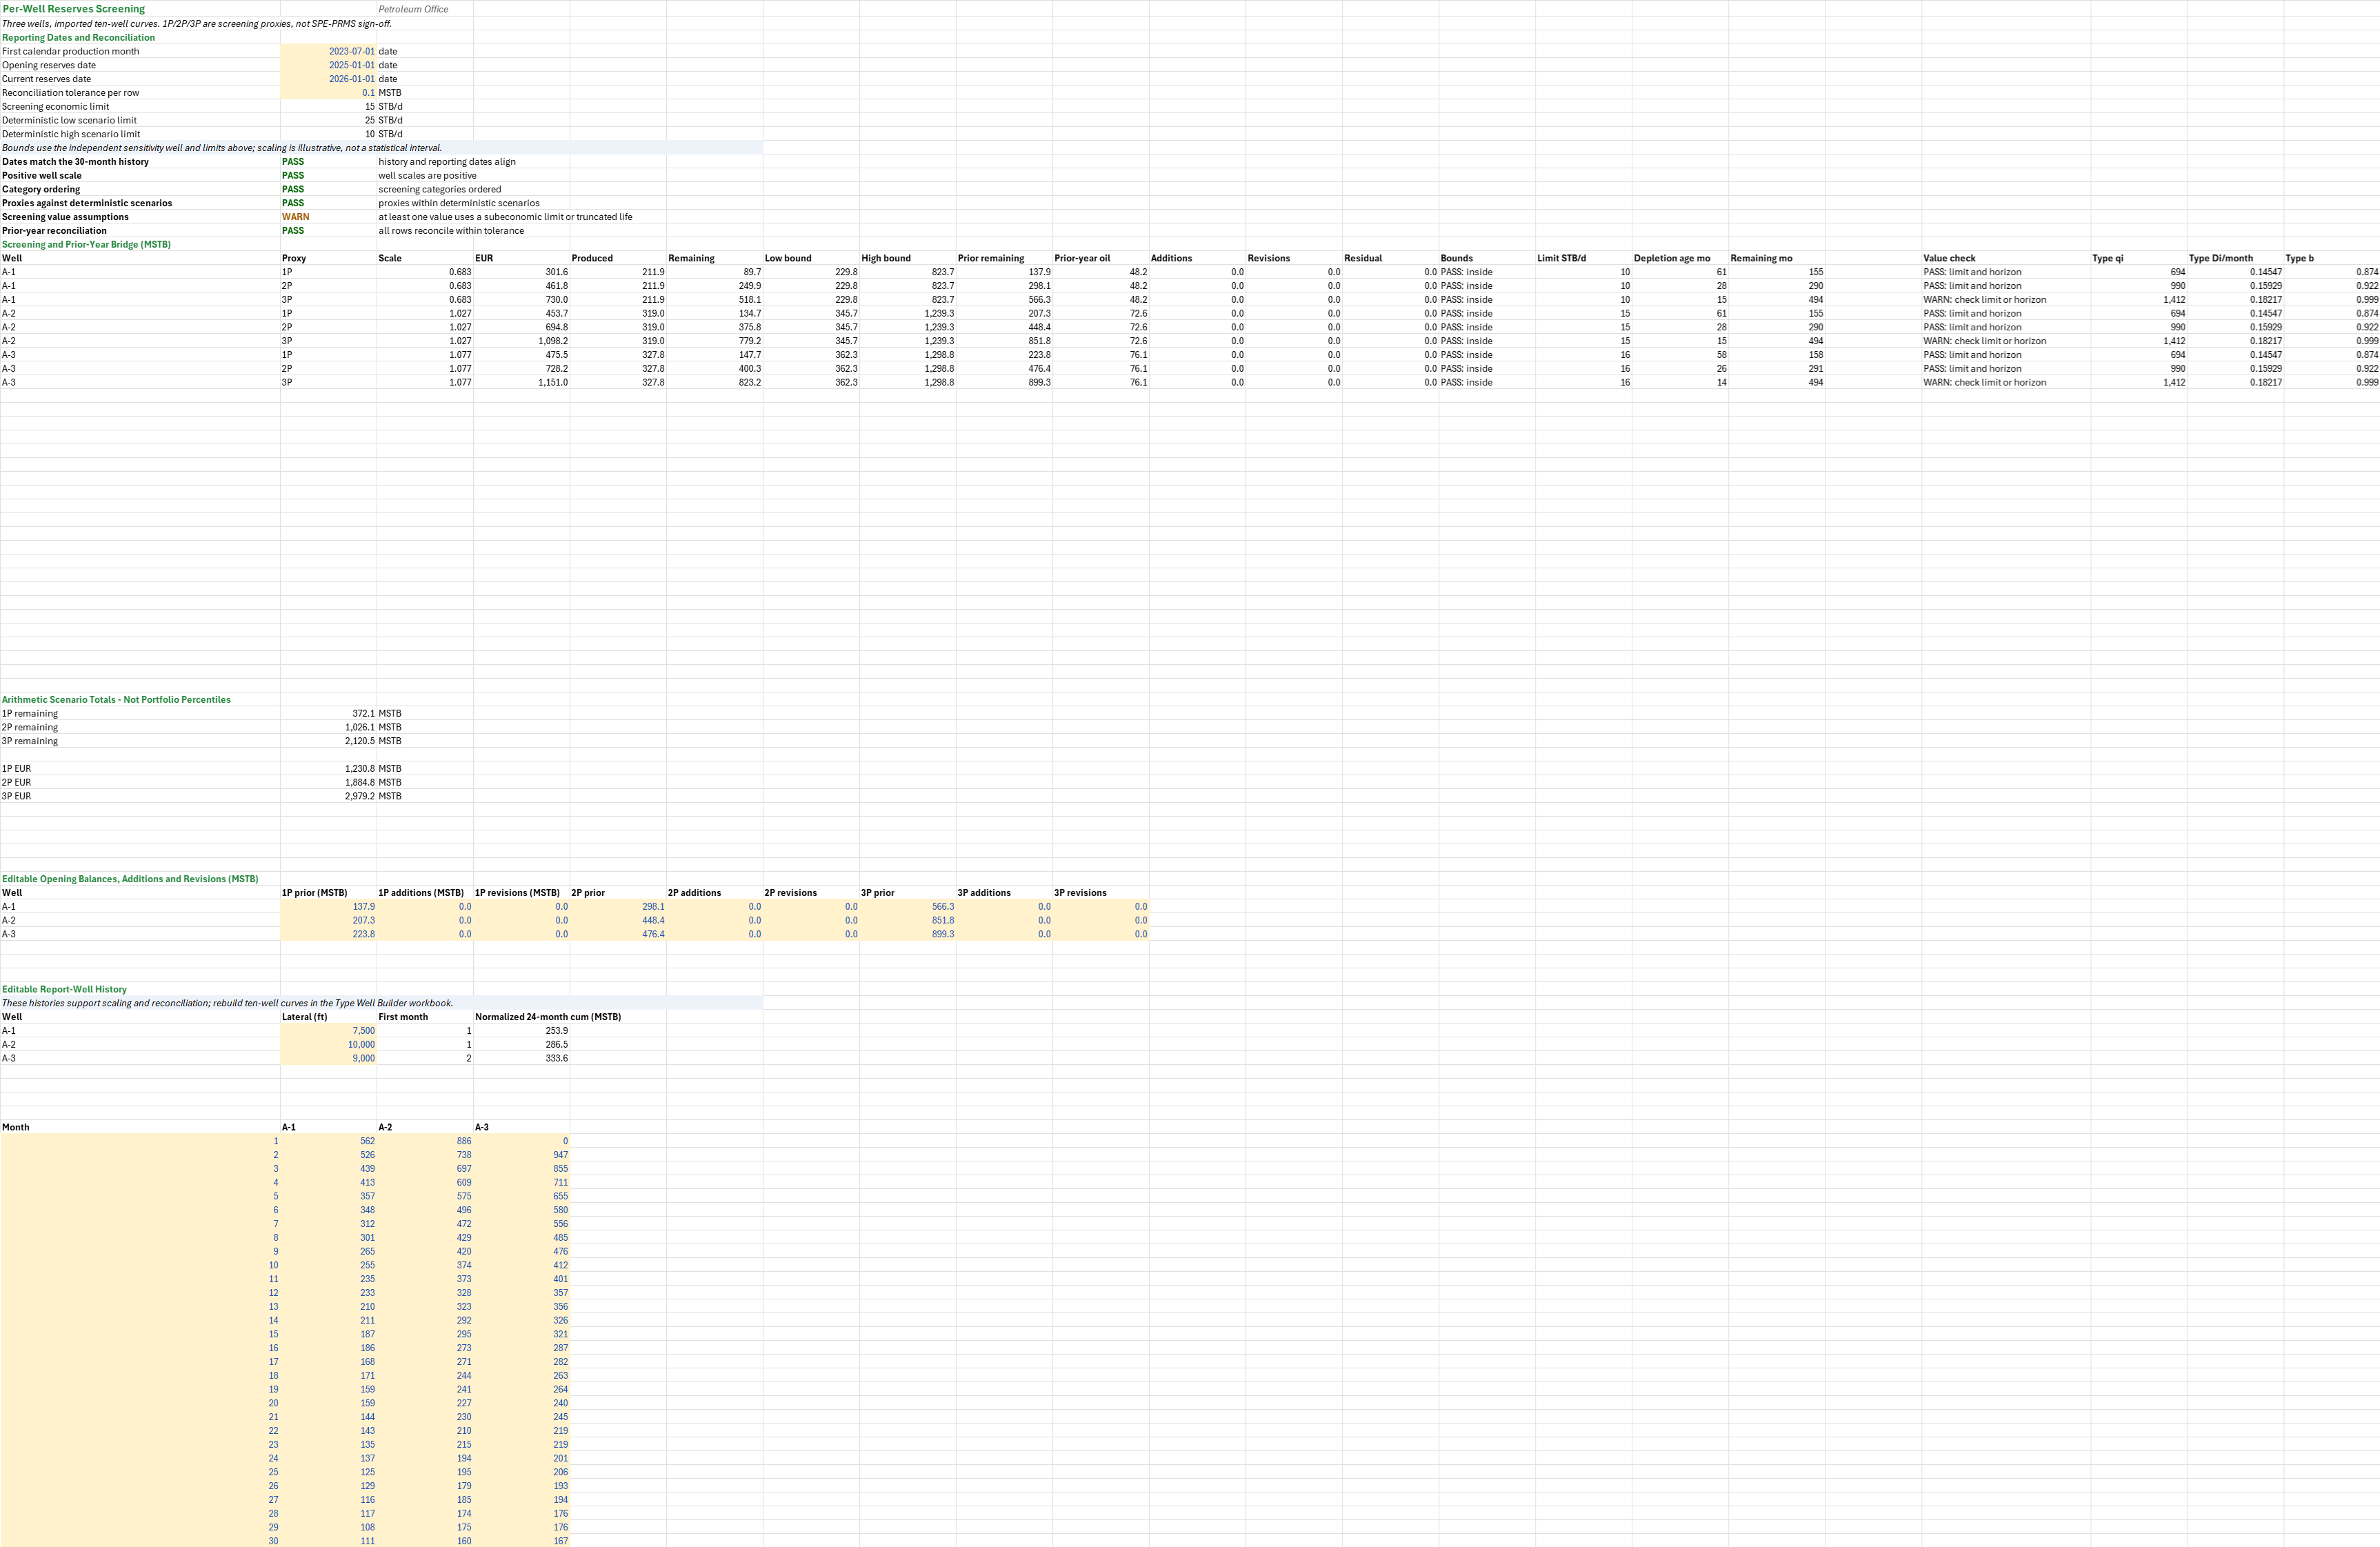
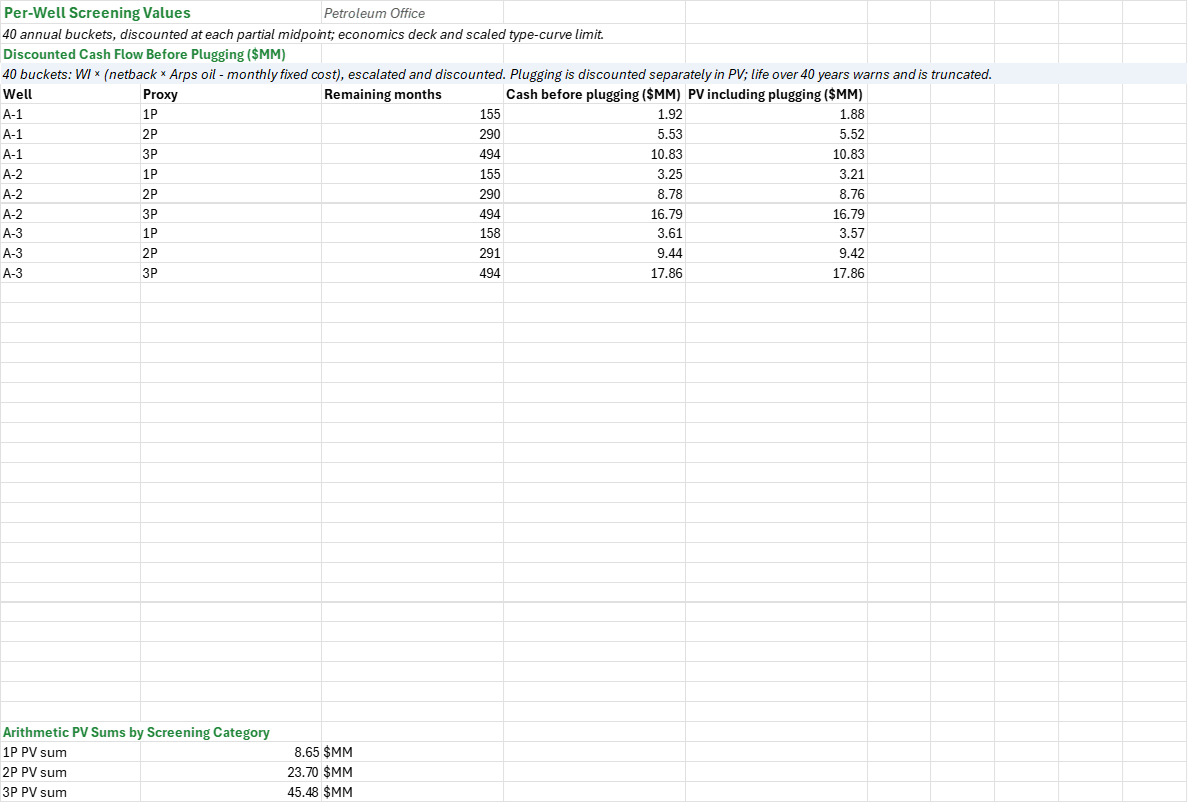
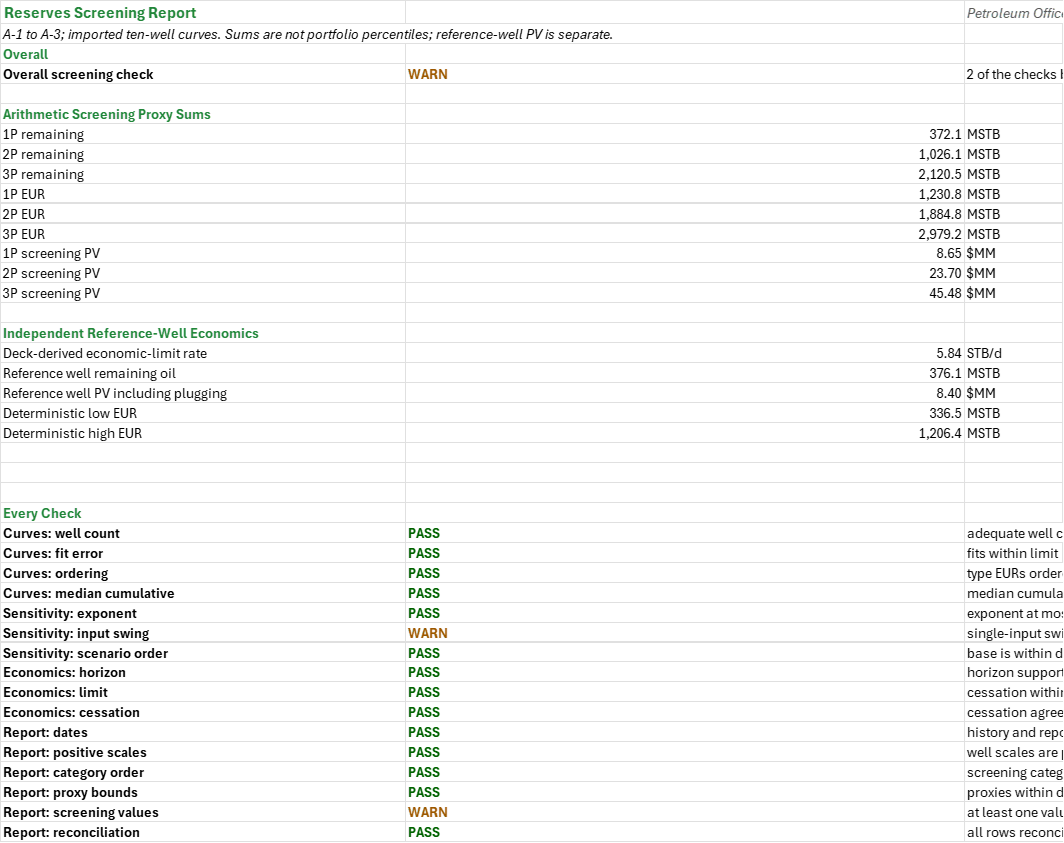
How much oil do wells A-1 to A-3 have left in 1P, 2P and 3P screening cases, what is it worth, and how does this year's number reconcile with last year's? You import the P90, P50 and P10 type curves fitted to a ten-well population, enter each well's 30-month history and lateral, an economics deck and last year's balances. You read off each well's scaled EUR and remaining oil per category, its limit and screening PV, the low and high scenario bounds, and the bridge residual from the prior booking. Oil rates in STB/d, volumes in MSTB, value in $MM.
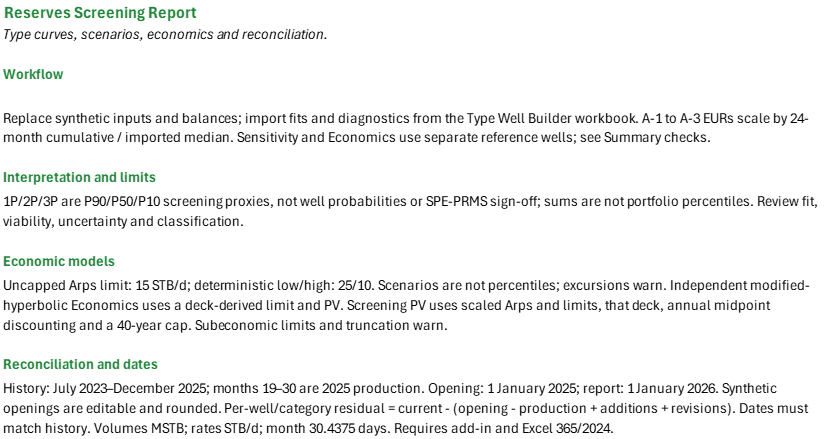
How to use it: Rebuild the ten-well population in the Type Well Builder workbook and copy its reviewed fits and population diagnostics onto the Type curves sheet; a changed fit or diagnostic warns until it is rebuilt and reviewed there. Enter each report well's lateral and monthly history and its prior remaining, additions and revisions per category on the Report sheet (below the results); the 30 months include the final twelve used in the reconciliation. Set the reporting dates and the bridge tolerance at the top of the Report sheet, the sensitivity ranges on the Sensitivity sheet, and the price, cost, tax and discount deck on the Economics sheet. Read each well's numbers on the Report and Valuation sheets and the totals and every check on the Summary. Replace every synthetic default, balance and date before using the numbers.
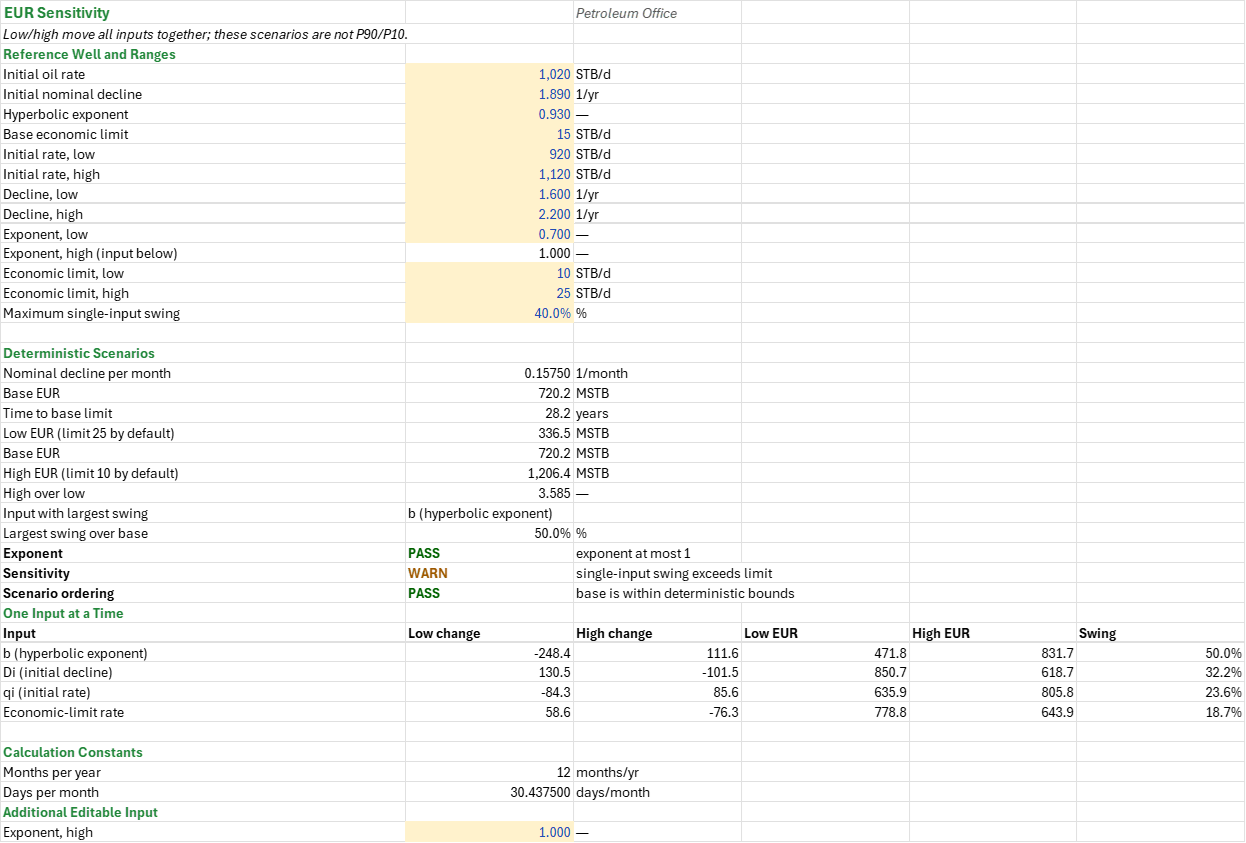
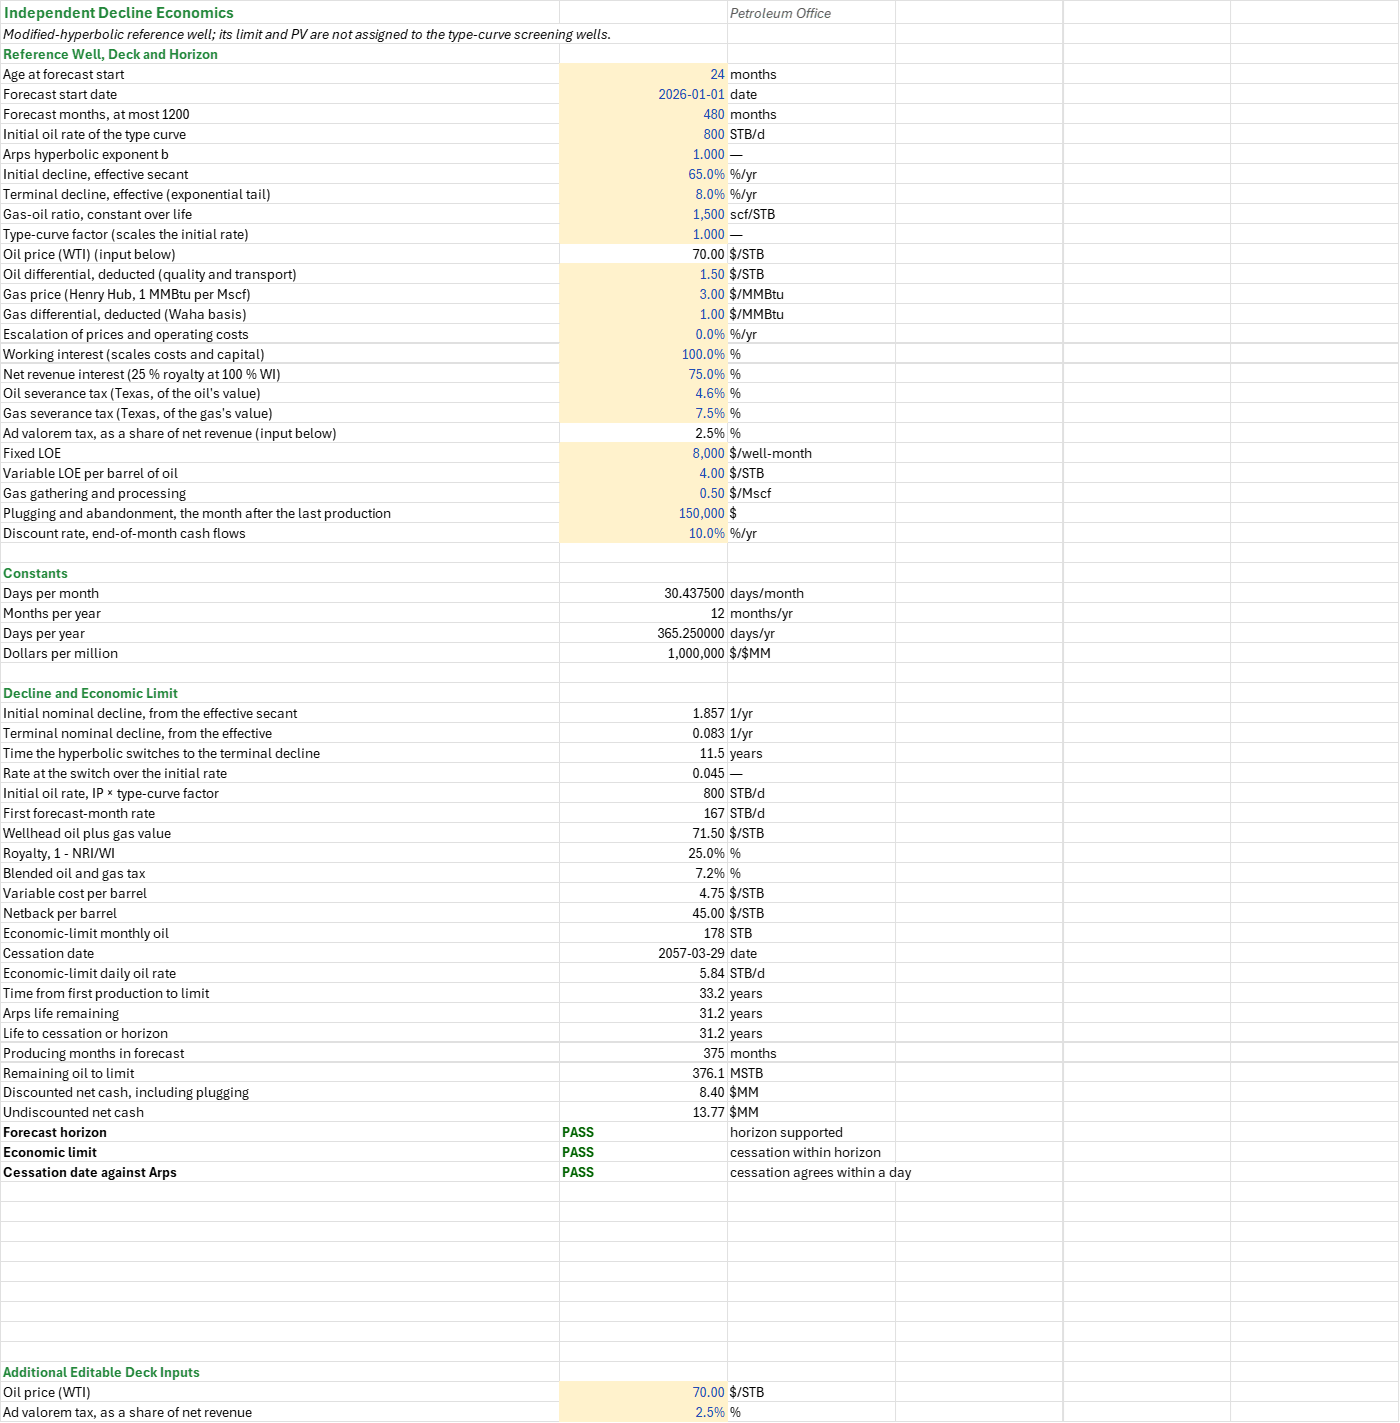
Method: Each type curve's Arps EUR runs to the screening limit. A report well's 1P, 2P and 3P EURs are the P90, P50 and P10 curve EURs scaled by its first-24-month cumulative over the imported normalised median, and its remaining oil is the scaled EUR less its cumulative production, floored at zero. The fit, well-count and cumulative checks read the imported diagnostics, not a recalculated population; the EUR ordering uses the current parameters. The Report compares the proxies with scaled deterministic low and high scenarios and warns on excursions; the scenarios move qi, decline, b and the limit together and are not percentiles, and their independent reference well takes 25 and 10 STB/d as its low and high limits against the type curve's 15 STB/d. The Economics sheet is an independent modified-hyperbolic well with an exponential tail, a limit from the deck and a PV including plugging; its results are not assigned to the report wells. Each report well and category instead gets a scaled Arps limit and a screening PV from the deck's working interest, royalty, tax, fixed and variable costs, escalation, discount and plugging. The valuation inverts the Arps cumulative for a depletion-equivalent age, integrates annual buckets to the limit and discounts partial buckets at their midpoints; it warns at the 40-year cap or where a type limit falls below the deck's break-even. The bridge residual per well and category is current − (prior − production + additions + revisions), with last year's production months 19–30 and a default tolerance of 0.1 MSTB per row. Oil volumes use 30.4375 days a month.
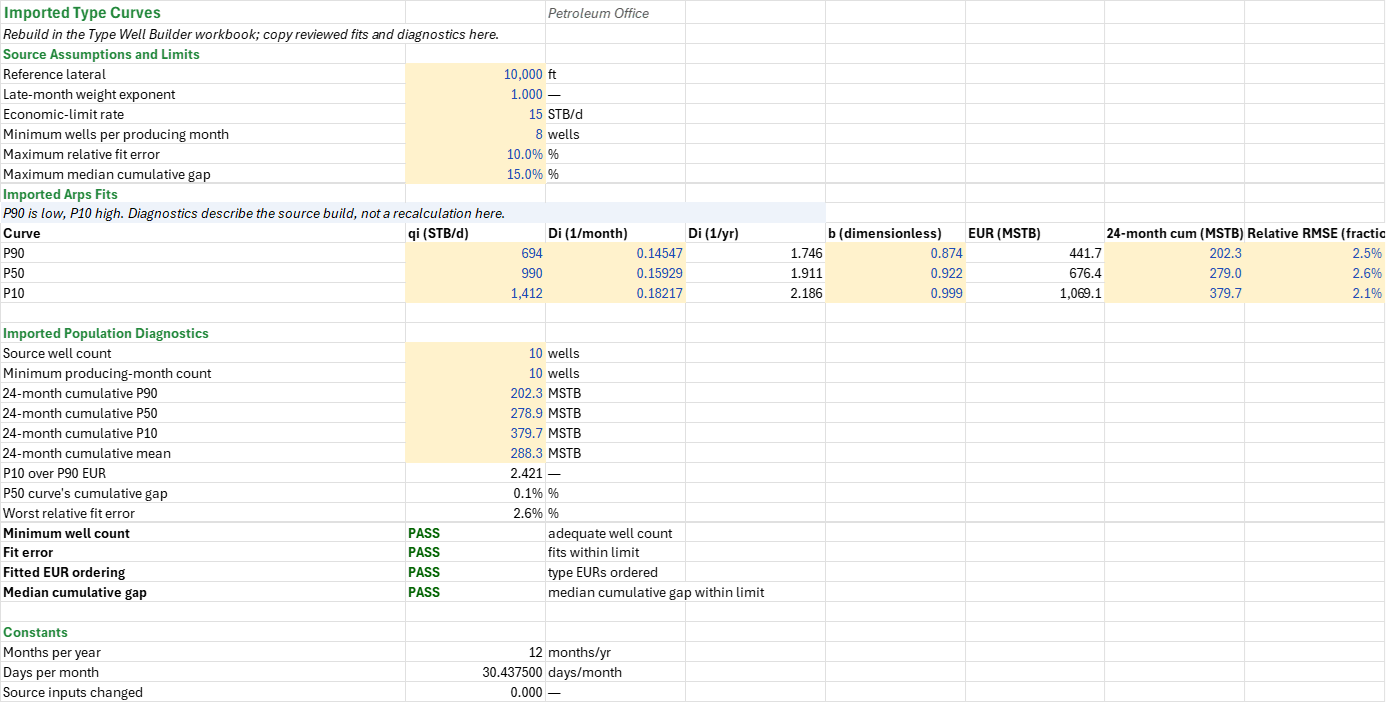
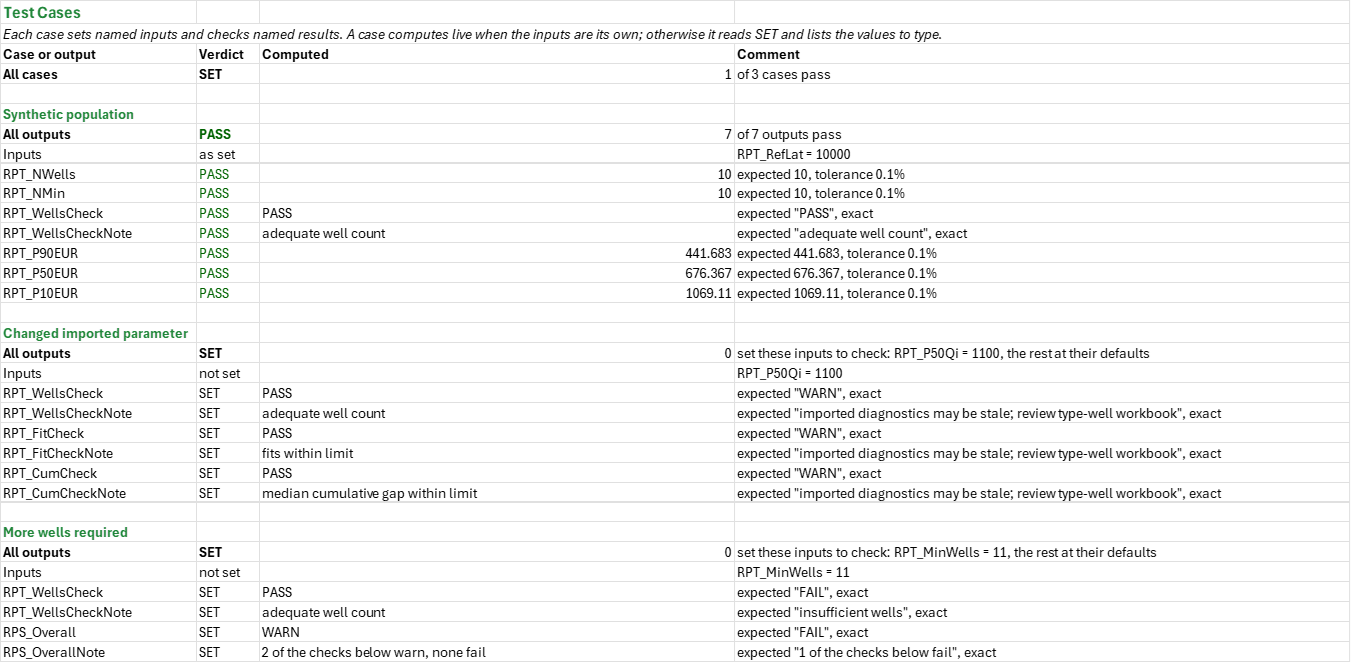
Example: The synthetic population at a 10000 ft reference lateral: the imported population and the minimum monthly count are both 10 wells. The P90, P50 and P10 curve EURs are about 441.683, 676.367 and 1069.11 MSTB. The history starts in July 2023, the opening balance is dated 1 January 2025 and the report 1 January 2026; the openings are rounded synthetic assumptions. These are screening curves, not portfolio percentiles.
Validity
P90, P50 and P10 use exceedance ordering: the 10th, 50th and 90th percentiles of monthly rates across wells. Neither these curves nor the scaled EURs are individual-well probability distributions. The labels are screening conventions, not SPE-PRMS classification or sign-off; arithmetic sums are not portfolio percentiles. The low and high scenarios are illustrative bounds, not an uncertainty interval, and not guaranteed physical bounds. The screening values are approximations, not booking valuations. The date check fails on a mismatch between the dates and the history, and changed fits or balances may need revisions in the bridge. Independently review uncapped tails, economic thresholds, history, lateral scaling, sample size, recoverability, commerciality, ownership and classification; replace the synthetic inputs and balances.
References
- Arps, J.J. (1945). Analysis of Decline Curves. Trans. AIME 160, 228-247.
- SPEE (2016). Monograph 4: Estimating Ultimate Recovery of Developed Wells in Low-Permeability Reservoirs.
- Society of Petroleum Engineers et al. (2018). Petroleum Resources Management System.
Inputs
| Input | Unit | Default | Name |
|---|---|---|---|
| Reference lateral | ft | 10000 | RPT_RefLat |
| Late-month weight exponent | — | 1 | RPT_WPow |
| Economic-limit rate | STB/d | 15 | RPT_QEcon |
| Minimum wells per producing month | wells | 8 | RPT_MinWells |
| Maximum relative fit error | fraction | 0.1 | RPT_FitMax |
| Maximum median cumulative gap | fraction | 0.15 | RPT_CumBand |
| Imported Arps fits: qi, Di, b, cumulative and fit error per curve | STB/d, 1/month, —, MSTB, fraction | imported fits | RPT_P90Qi, RPT_P90DiM, RPT_P90B and the P50 and P10 equivalents, each curve's Cum and Err |
| Source well count; minimum producing-month count | wells | imported diagnostics | RPT_NWells, RPT_NMin |
| 24-month cumulative P90, P50, P10 and mean | MSTB | imported diagnostics | RPT_CumP90, RPT_CumP50, RPT_CumP10, RPT_CumMean |
| Initial oil rate; initial nominal decline; hyperbolic exponent; base economic limit | STB/d, 1/yr, —, STB/d | 1020, 1.89, 0.93, 15 | RPE_qi, RPE_Di, RPE_b, RPE_QEcon |
| Initial rate, low and high | STB/d | 920, 1120 | RPE_qiLo, RPE_qiHi |
| Decline, low and high | 1/yr | 1.6, 2.2 | RPE_DiLo, RPE_DiHi |
| Exponent, low and high | — | 0.7, 1 | RPE_bLo, RPE_bHi |
| Economic limit, low and high | STB/d | 10, 25 | RPE_QEconLo, RPE_QEconHi |
| Age at forecast start | months | 24 | RPC_Age |
| Forecast start date | date | 2026-01-01 | RPC_Start |
| Forecast months, at most 1200 | months | 480 | RPC_Horizon |
| First calendar production month | date | 2023-07-01 | RPR_CalendarStart |
| Opening reserves date | date | 2025-01-01 | RPR_PriorDate |
| Current reserves date | date | 2026-01-01 | RPR_AsOf |
| Reconciliation tolerance per row | MSTB | 0.1 | RPR_Tolerance |
| A-1 1P prior remaining, additions and revisions (every row has its own) | MSTB | synthetic, 0, 0 | RPR_PriorA1, RPR_AdditionA1, RPR_RevisionA1 |
The imported fits and diagnostics, the three well histories and laterals, the economics deck, and each bridge row's prior balance, additions and revisions are editable. The histories and bridge inputs sit below the Report results. Two economics inputs and the high sensitivity exponent sit below their main blocks; the sheet labels document the complete deck.
Sheets
Guide— the workflow, the interpretation and limits, the economic models, and the reconciliation and dates.Type curves— the imported P90, P50 and P10 Arps fits and population diagnostics, their annual declines and EURs to the limit, and the checks; rebuild them in the Type Well Builder workbook.Sensitivity— an independent reference well's low, base and high EUR with all inputs moved together, and the one-at-a-time sensitivity.Economics— an independent modified-hyperbolic reference well: netback, economic limit, cessation date, remaining oil to the limit and PV including plugging.Report— each well's 1P, 2P and 3P proxy EUR and remaining oil, the scenario bounds, the limit and the prior-year bridge, with the editable balances and histories below.Valuation— each well and category's discounted annual cash flows over 40 annual buckets and its PV including plugging, with the PV sums by category.Summary— the arithmetic proxy totals, the independent reference-well economics and every check under one verdict.Test Cases— the worked example and other cases, with expected and computed results.
Functions used
Names (198)
| Name | Refers to | Comment |
|---|---|---|
PO.ECON.COP.DateLAMBDA |
=LAMBDA(Dates, Rate, Limit, LET(i, SEQUENCE(ROWS(Rate)), hit, IFERROR(MATCH(1, (Rate<=Limit)*1, 0), 0), qb, SUM((i=hit)*Rate), qa, SUM((i=hit-1)*Rate), tb, SUM((i=hit)*Dates), ta, SUM((i=hit-1)*Dates), IF(hit=0, "none", IF(hit=1, tb, IF(qb>0, ta+(tb-ta)*LN(qa/Limit)/LN(qa/qb), ta+(tb-ta)*(qa-Limit)/(qa-qb)))))) |
Cessation-of-production date: where a rate forecast first falls to the economic limit, interpolated log-linearly between dates; "none" if it never does |
PO.ECON.NPV.MonthlyLAMBDA |
=LAMBDA(cash,annual_rate,NPV((1+annual_rate)^(1/12)-1,cash)) |
NPV of end-of-month cash flows at an annual discount rate, in the units of cash. |
PO.RES.Reserves.EconLimitLAMBDA |
=LAMBDA(Price, Royalty, Tax, Opex, Fixed, LET(netback, Price*(1-Royalty)*(1-Tax)-Opex, IF(netback>0, Fixed/netback, NA()))) |
Economic-limit rate: fixed cost per period over the netback per unit after royalty, production tax and variable opex; #N/A if the netback is not positive |
RPR_DepletionAgeLAMBDA |
=LAMBDA(da_np,da_rem,da_scale,da_qi,da_di,da_b,da_limit,LET(da_life,PO.DCA.Arps.Time(da_qi,da_di,da_b,da_limit),da_x,da_np*1000/da_scale/RPT_DMo*da_di/da_qi,IF(da_rem<=0,da_life,IF(ABS(da_b)<0.00000001,-LN(1-da_x)/da_di,IF(ABS(da_b-1)<0.00000001,(EXP(da_x)-1)/da_di,((1-(1-da_b)*da_x)^(-da_b/(1-da_b))-1)/(da_b*da_di)))))) |
|
RPV_CashFlowLAMBDA |
=LAMBDA(dv_age,dv_life,dv_scale,dv_qi,dv_di,dv_b,LET(dv_idx,SEQUENCE(1,40,0),dv_t0,IF(12*dv_idx<dv_life,12*dv_idx,dv_life),dv_t1,IF(12*(dv_idx+1)<dv_life,12*(dv_idx+1),dv_life),dv_oil,(IF(ABS(dv_b)<0.00000001,dv_qi/dv_di*(1-EXP(-dv_di*(dv_age+dv_t1))),IF(ABS(dv_b-1)<0.00000001,dv_qi/dv_di*LN(1+dv_di*(dv_age+dv_t1)),dv_qi/(dv_di*(1-dv_b))*(1-(1+dv_b*dv_di*(dv_age+dv_t1))^((dv_b-1)/dv_b))))-IF(ABS(dv_b)<0.00000001,dv_qi/dv_di*(1-EXP(-dv_di*(dv_age+dv_t0))),IF(ABS(dv_b-1)<0.00000001,dv_qi/dv_di*LN(1+dv_di*(dv_age+dv_t0)),dv_qi/(dv_di*(1-dv_b))*(1-(1+dv_b*dv_di*(dv_age+dv_t0))^((dv_b-1)/dv_b)))))*dv_scale*RPT_DMo,dv_mid,(dv_t0+dv_t1)/2/12,SUM(IF(dv_t1>dv_t0,RPC_WI*(RPC_Netback*dv_oil-RPC_LOE*(dv_t1-dv_t0))*(1+RPC_Esc)^dv_mid/(1+RPC_Disc)^dv_mid/RPC_PerMM,0)))) |
|
RPC_AdVal |
Economics!$B$71 |
|
RPC_Age |
Economics!$B$4 |
|
RPC_COP |
Economics!$B$48 |
|
RPC_CopCheck |
Economics!$B$59 |
|
RPC_CopCheckNote |
Economics!$C$59 |
|
RPC_Days |
Economics!$B$30 |
|
RPC_DaysYr |
Economics!$B$32 |
|
RPC_Dei |
Economics!$B$9 |
|
RPC_Di |
Economics!$B$36 |
|
RPC_Disc |
Economics!$B$27 |
|
RPC_Dt |
Economics!$B$37 |
|
RPC_Dterm |
Economics!$B$10 |
|
RPC_ELimit |
Economics!$B$47 |
|
RPC_Esc |
Economics!$B$17 |
|
RPC_GOR |
Economics!$B$11 |
|
RPC_Gas |
Economics!$B$15 |
|
RPC_GasDiff |
Economics!$B$16 |
|
RPC_Gath |
Economics!$B$25 |
|
RPC_Horizon |
Economics!$B$6 |
|
RPC_HorizonCheck |
Economics!$B$57 |
|
RPC_HorizonCheckNote |
Economics!$C$57 |
|
RPC_IP |
Economics!$B$7 |
|
RPC_LOE |
Economics!$B$23 |
|
RPC_LOEVar |
Economics!$B$24 |
|
RPC_Life |
Economics!$B$52 |
|
RPC_LimitCheck |
Economics!$B$58 |
|
RPC_LimitCheckNote |
Economics!$C$58 |
|
RPC_MoYr |
Economics!$B$31 |
|
RPC_Months |
Economics!$B$53 |
|
RPC_NRI |
Economics!$B$19 |
|
RPC_NetCash |
Economics!$B$56 |
|
RPC_Netback |
Economics!$B$46 |
|
RPC_Oil |
Economics!$B$70 |
|
RPC_OilDiff |
Economics!$B$14 |
|
RPC_Opex |
Economics!$B$45 |
|
RPC_PA |
Economics!$B$26 |
|
RPC_PV |
Economics!$B$55 |
|
RPC_PerMM |
Economics!$B$33 |
|
RPC_QLimit |
Economics!$B$49 |
|
RPC_Qi |
Economics!$B$40 |
|
RPC_Qs |
Economics!$B$39 |
|
RPC_RateNow |
Economics!$B$41 |
|
RPC_Remain |
Economics!$B$51 |
|
RPC_Reserves |
Economics!$B$54 |
|
RPC_Roy |
Economics!$B$43 |
|
RPC_SevGas |
Economics!$B$21 |
|
RPC_SevOil |
Economics!$B$20 |
|
RPC_Start |
Economics!$B$5 |
|
RPC_TC |
Economics!$B$12 |
|
RPC_TLimit |
Economics!$B$50 |
|
RPC_Tax |
Economics!$B$44 |
|
RPC_Ts |
Economics!$B$38 |
|
RPC_Value |
Economics!$B$42 |
|
RPC_WI |
Economics!$B$18 |
|
RPC_b |
Economics!$B$8 |
|
RPE_BCheck |
Sensitivity!$B$28 |
|
RPE_BCheckNote |
Sensitivity!$C$28 |
|
RPE_DMo |
Sensitivity!$B$40 |
|
RPE_Di |
Sensitivity!$B$5 |
|
RPE_DiHi |
Sensitivity!$B$11 |
|
RPE_DiLo |
Sensitivity!$B$10 |
|
RPE_DiM |
Sensitivity!$B$19 |
|
RPE_EUR |
Sensitivity!$B$20 |
|
RPE_EURBest |
Sensitivity!$B$23 |
|
RPE_EURHigh |
Sensitivity!$B$24 |
|
RPE_EURLow |
Sensitivity!$B$22 |
|
RPE_HiLo |
Sensitivity!$B$25 |
|
RPE_MoYr |
Sensitivity!$B$39 |
|
RPE_QEcon |
Sensitivity!$B$7 |
|
RPE_QEconHi |
Sensitivity!$B$15 |
|
RPE_QEconLo |
Sensitivity!$B$14 |
|
RPE_RangeCheck |
Sensitivity!$B$30 |
|
RPE_RangeCheckNote |
Sensitivity!$C$30 |
|
RPE_SwingCheck |
Sensitivity!$B$29 |
|
RPE_SwingCheckNote |
Sensitivity!$C$29 |
|
RPE_SwingMax |
Sensitivity!$B$16 |
|
RPE_TLim |
Sensitivity!$B$21 |
|
RPE_Top |
Sensitivity!$B$26 |
|
RPE_TopSwing |
Sensitivity!$B$27 |
|
RPE_Tornado |
Sensitivity!$A$33:$F$36 |
|
RPE_b |
Sensitivity!$B$6 |
|
RPE_bHi |
Sensitivity!$B$42 |
|
RPE_bLo |
Sensitivity!$B$12 |
|
RPE_qi |
Sensitivity!$B$4 |
|
RPE_qiHi |
Sensitivity!$B$9 |
|
RPE_qiLo |
Sensitivity!$B$8 |
|
RPR_AdditionA1 |
Report!$C$66 |
|
RPR_AsOf |
Report!$B$6 |
|
RPR_BoundsCheck |
Report!$B$15 |
|
RPR_BoundsCheckNote |
Report!$C$15 |
|
RPR_BridgeInputs |
Report!$A$66:$J$68 |
|
RPR_CalendarStart |
Report!$B$4 |
|
RPR_Cases |
Report!$A$20:$V$28 |
|
RPR_DateCheck |
Report!$B$12 |
|
RPR_DateCheckNote |
Report!$C$12 |
|
RPR_Eur1P |
Report!$B$56 |
|
RPR_Eur2P |
Report!$B$57 |
|
RPR_Eur3P |
Report!$B$58 |
|
RPR_HighLimit |
Report!$B$10 |
|
RPR_LowLimit |
Report!$B$9 |
|
RPR_OrderCheck |
Report!$B$14 |
|
RPR_OrderCheckNote |
Report!$C$14 |
|
RPR_PriorA1 |
Report!$B$66 |
|
RPR_PriorDate |
Report!$B$5 |
|
RPR_QLimit |
Report!$B$8 |
|
RPR_ReconCheck |
Report!$B$17 |
|
RPR_ReconCheckNote |
Report!$C$17 |
|
RPR_Rem1P |
Report!$B$52 |
|
RPR_Rem2P |
Report!$B$53 |
|
RPR_Rem3P |
Report!$B$54 |
|
RPR_ReportHistory |
Report!$A$83:$D$112 |
|
RPR_ReportWells |
Report!$A$75:$D$77 |
|
RPR_RevisionA1 |
Report!$D$66 |
|
RPR_ScaleCheck |
Report!$B$13 |
|
RPR_ScaleCheckNote |
Report!$C$13 |
|
RPR_Tolerance |
Report!$B$7 |
|
RPR_ValueCheck |
Report!$B$16 |
|
RPR_ValueCheckNote |
Report!$C$16 |
|
RPS_Checks |
Summary!$B$27:$B$42 |
|
RPS_EURHigh |
Summary!$B$22 |
|
RPS_EURLow |
Summary!$B$21 |
|
RPS_EconReserves |
Summary!$B$19 |
|
RPS_Eur1P |
Summary!$B$10 |
|
RPS_Eur2P |
Summary!$B$11 |
|
RPS_Eur3P |
Summary!$B$12 |
|
RPS_Overall |
Summary!$B$4 |
|
RPS_OverallNote |
Summary!$C$4 |
|
RPS_PV |
Summary!$B$20 |
|
RPS_PV1P |
Summary!$B$13 |
|
RPS_PV2P |
Summary!$B$14 |
|
RPS_PV3P |
Summary!$B$15 |
|
RPS_QLimit |
Summary!$B$18 |
|
RPS_Rem1P |
Summary!$B$7 |
|
RPS_Rem2P |
Summary!$B$8 |
|
RPS_Rem3P |
Summary!$B$9 |
|
RPT_CumBand |
'Type curves'!$B$9 |
|
RPT_CumCheck |
'Type curves'!$B$30 |
|
RPT_CumCheckNote |
'Type curves'!$C$30 |
|
RPT_CumGap |
'Type curves'!$B$25 |
|
RPT_CumMean |
'Type curves'!$B$23 |
|
RPT_CumP10 |
'Type curves'!$B$22 |
|
RPT_CumP50 |
'Type curves'!$B$21 |
|
RPT_CumP90 |
'Type curves'!$B$20 |
|
RPT_DMo |
'Type curves'!$B$34 |
|
RPT_Decline_Results |
'Type curves'!$D$13:$D$15 |
|
RPT_Diagnostics_Inputs |
'Type curves'!$B$18:$B$23 |
|
RPT_Diagnostics_Results |
'Type curves'!$B$24:$B$26 |
|
RPT_EurRatio |
'Type curves'!$B$24 |
|
RPT_FitCheck |
'Type curves'!$B$28 |
|
RPT_FitCheckNote |
'Type curves'!$C$28 |
|
RPT_FitMax |
'Type curves'!$B$8 |
|
RPT_Fits |
'Type curves'!$A$13:$H$15 |
|
RPT_Fits_Inputs |
'Type curves'!$B$13:$H$15 |
|
RPT_Inputs |
'Type curves'!$B$4:$B$9 |
|
RPT_MinWells |
'Type curves'!$B$7 |
|
RPT_MoYr |
'Type curves'!$B$33 |
|
RPT_NMin |
'Type curves'!$B$19 |
|
RPT_NWells |
'Type curves'!$B$18 |
|
RPT_OrderCheck |
'Type curves'!$B$29 |
|
RPT_OrderCheckNote |
'Type curves'!$C$29 |
|
RPT_P10B |
'Type curves'!$E$15 |
|
RPT_P10Cum |
'Type curves'!$G$15 |
|
RPT_P10Di |
'Type curves'!$D$15 |
|
RPT_P10DiM |
'Type curves'!$C$15 |
|
RPT_P10EUR |
'Type curves'!$F$15 |
|
RPT_P10Err |
'Type curves'!$H$15 |
|
RPT_P10Qi |
'Type curves'!$B$15 |
|
RPT_P50B |
'Type curves'!$E$14 |
|
RPT_P50Cum |
'Type curves'!$G$14 |
|
RPT_P50Di |
'Type curves'!$D$14 |
|
RPT_P50DiM |
'Type curves'!$C$14 |
|
RPT_P50EUR |
'Type curves'!$F$14 |
|
RPT_P50Err |
'Type curves'!$H$14 |
|
RPT_P50Qi |
'Type curves'!$B$14 |
|
RPT_P90B |
'Type curves'!$E$13 |
|
RPT_P90Cum |
'Type curves'!$G$13 |
|
RPT_P90Di |
'Type curves'!$D$13 |
|
RPT_P90DiM |
'Type curves'!$C$13 |
|
RPT_P90EUR |
'Type curves'!$F$13 |
|
RPT_P90Err |
'Type curves'!$H$13 |
|
RPT_P90Qi |
'Type curves'!$B$13 |
|
RPT_QEcon |
'Type curves'!$B$6 |
|
RPT_RefLat |
'Type curves'!$B$4 |
|
RPT_Results |
'Type curves'!$F$13:$F$15 |
|
RPT_Stale |
'Type curves'!$B$35 |
|
RPT_WPow |
'Type curves'!$B$5 |
|
RPT_WellsCheck |
'Type curves'!$B$27 |
|
RPT_WellsCheckNote |
'Type curves'!$C$27 |
|
RPT_WorstErr |
'Type curves'!$B$26 |
|
RPV_CashFlows |
Valuation!$A$6:$E$14 |
|
RPV_PV1P |
Valuation!$B$38 |
|
RPV_PV2P |
Valuation!$B$39 |
|
RPV_PV3P |
Valuation!$B$40 |
Details
| Opens in | Needs the Petroleum Office add-in: its PO functions show #NAME? without it once Excel recalculates. Needs Microsoft 365 or Excel 2024: it uses functions Excel 2016 doesn't have, such as named LAMBDAs, which show #NAME? there. |
| File | ReservesReport.xlsx, 103 KB |
| Category | Reservoir |
| For agents and tools | Descriptor (.md) |