AFE and Time-Depth

Description
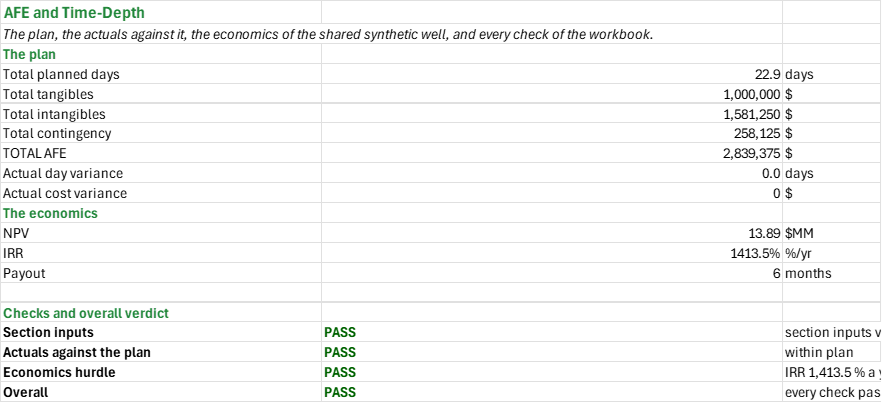
How long will this well take to drill, what should the AFE be, and what is the well worth at that cost? You enter each hole section's ROP, round trips, trip rate, flat time, spread rate, tangibles and fixed intangibles, and a contingency. You read off the time-depth curve, the AFE build-up and its total, the variance of the actual days and cost against the plan, and the NPV, IRR and payout of a synthetic well carrying the AFE as its drilling and completion cost. Field units: feet, hours, days and US dollars; no add-in needed.
How to use it: Replace the section assumptions on the Time-Depth sheet with the planned ROP, round trips, trip rate, flat time, spread rate, tangibles and fixed intangibles, and the contingency with the one the programme carries. Type the actual days and cost of each section on the Actuals sheet as the well is drilled; the cells start at the plan's own values, so the variances start at zero. The Economics sheet takes the TOTAL AFE as the well's drilling and completion cost, so editing the plan moves the NPV. Read the plan, the variances and the economics on the Summary, and read every check there before the numbers are used.
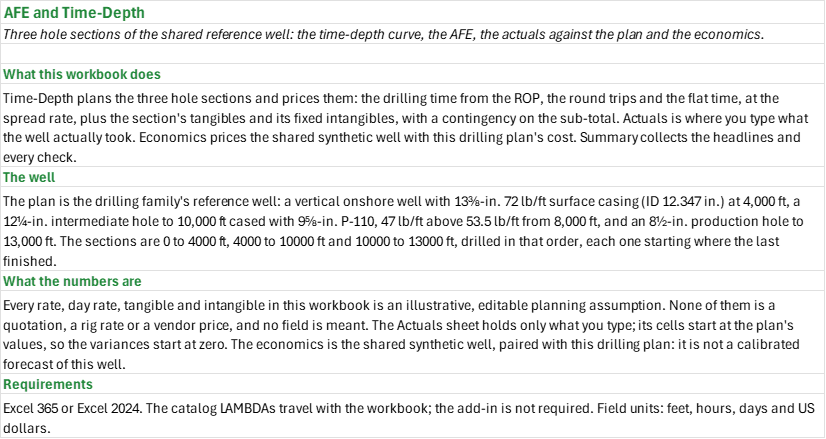
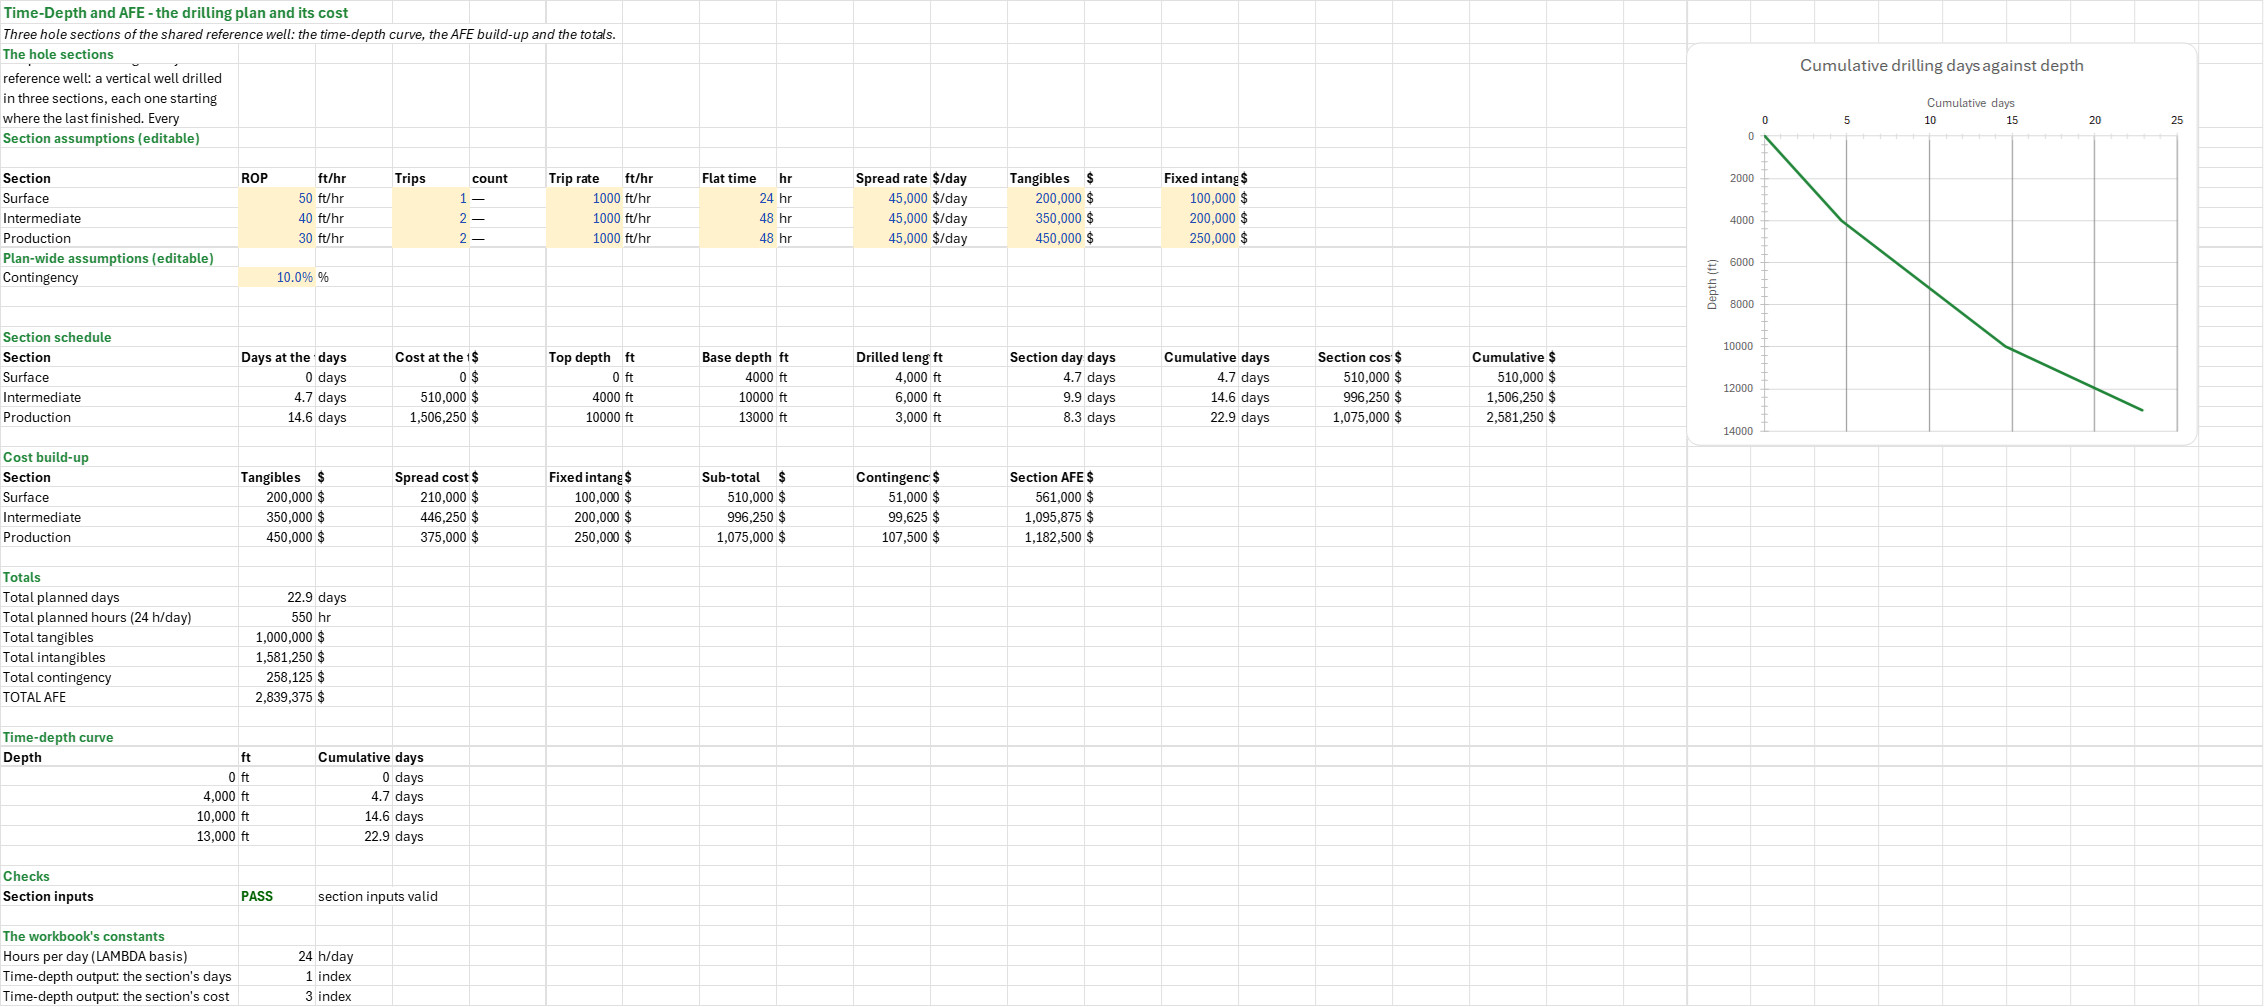
Method: The plan is the drilling family's shared reference well: a vertical well with its surface shoe at 4,000 ft, its intermediate shoe at 10,000 ft and total depth at 13,000 ft, drilled in three sections (surface 0 to 4,000 ft, intermediate 4,000 to 10,000 ft and production 10,000 to 13,000 ft), each starting where the last finished. Each section's time is t = (drilled length / ROP + trips x 2 x base depth / trip rate + flat time) / 24 days, and its cost is the days at the spread rate plus its fixed cost, the section's tangibles plus its fixed intangibles, so the cost is the section's sub-total before contingency. Each section carries the previous section's cumulative days and cost, and the last section's cumulative days are the plan's total days. The build-up splits the same money out again into tangibles, spread cost (the section's days at the spread rate) and fixed intangibles; the contingency is an editable fraction of that sub-total, and the AFE is the sub-total plus the contingency.
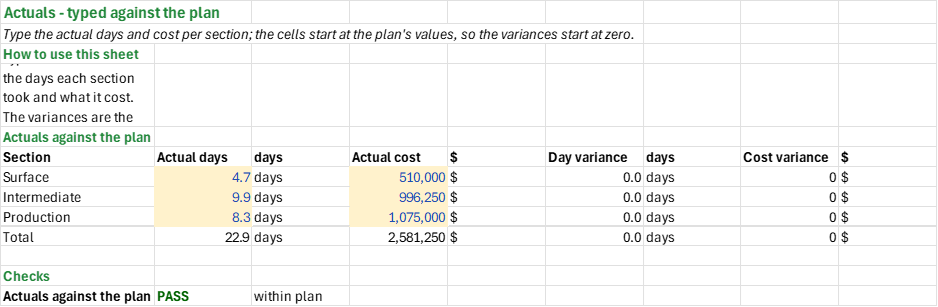
The actual days and cost of each section are typed numbers, never formulas, so what you enter stays what you entered when the plan changes. The day variance is the actual less the plan, the cost variance the same on the dollars, and a check warns when the total day variance is above zero.
The economics is the shared synthetic well: online in month 3, its life capped at 360 months, an initial rate of 800 STB/d on an Arps hyperbolic (b = 1, 65 %/yr effective secant decline) switching to an 8 %/yr exponential tail, 1,500 scf/STB of gas, oil at $70/STB less $1.50 and gas at $3/MMBtu less $1.00, a 25 % royalty, Texas severance and ad valorem, $8,000 a month of fixed LOE and $4/STB of variable LOE, discounted at 10 % a year. The only input the drilling plan touches is the drilling and completion cost, the TOTAL AFE in $MM. The cash flow is monthly: the mid-month rate on the type curve, the oil it makes, the margin after royalty, taxes and variable costs, the phased capital and the net cash, with the plugging in the month after the last production. NPV, IRR and payout follow from the monthly net cash. The same model is the one-well NPV and IRR blueprint, and every number in the economics matches it on the same inputs.
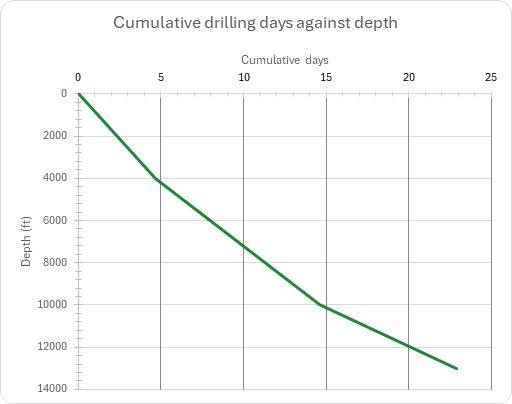
Example: The surface section takes 4,000 ft at 50 ft/hr, 80 hours of drilling, plus one round trip to 4,000 ft at 1,000 ft/hr (8 hours) and 24 hours of flat time: 112 hours, 4.67 days, and $510,000 at a $45,000/day spread rate plus $300,000 of tangibles and fixed intangibles. The intermediate section takes 6,000 ft at 40 ft/hr (150 hours), two round trips to 10,000 ft (40 hours) and 48 hours of flat time: 238 hours, 9.92 days, $996,250. The production section takes 3,000 ft at 30 ft/hr (100 hours), two round trips to 13,000 ft (52 hours) and 48 hours of flat time: 200 hours, 8.33 days, $1,075,000. The plan is 22.92 days, or 550 hours: $1,000,000 of tangibles, $1,581,250 of intangibles (the $1,031,250 of spread and time plus $550,000 of fixed intangibles) and $258,125 of contingency at 10 % of the $2,581,250 sub-total, for a TOTAL AFE of $2,839,375. At $2.839375 MM of drilling and completion cost the synthetic well's NPV is $13.89 MM at the 10 % discount rate, its IRR 1413.5 % a year (the monthly cash flows annualised) and its payout in month 6; the discounted capital is $2.79 MM, the PV/I 4.97, the oil EUR 611.9 MSTB and the undiscounted net cash $21.67 MM. Every rate, day rate, tangible, intangible and the contingency is an illustrative, editable planning assumption, not a quotation, a rig rate or a vendor price.
Validity
The rates, the day rate, the tangibles, the intangibles and the contingency are illustrative, editable planning assumptions. They are not quotations, rig rates or vendor prices, and no field is meant.
The plan is a deterministic P50: there is no non-productive time in it unless it is entered as flat time, and the round trips are taken as full round trips from the section's base, the conservative depth for the section. The workbook does not compute a probabilistic AFE (P10/P50/P90).
The actuals are typed by the user; the workbook does not read them from anywhere, and the sheet starts at the plan's own values.
The economics pairs this drilling plan with the shared synthetic well forecast. That forecast is a well-program workbook's illustrative base case reduced to one well, not a calibrated forecast of this well, and the NPV, IRR and payout it gives are the economics of that synthetic case at this plan's cost.
The monthly cash flow table carries 400 months. The shipped case needs 363 (online in month 3, a 360-month life), so a life cap beyond about 397 months would need a longer table; the results read the first N rows of it, so a longer life is truncated rather than refused.
References
- Bourgoyne, A.T., Millheim, K.K., Chenevert, M.R. and Young, P.D. (1986). Applied Drilling Engineering. SPE Textbook Series Vol. 2, ch. 1: drilling cost per foot and the drilling-time curve.
- Mitchell, P.D. and Miska, T. (2011). Fundamentals of Drilling Engineering. SPE Textbook Series Vol. 12: well planning and AFE.
- Mian, M.A. (2011). Project Economics and Decision Analysis. Third edition. Gulf Professional Publishing: the NPV and the IRR.
- Arps, C.J. (1945). "Analysis of Decline Curve Types." Transactions of the AIME 194: 228-232.
- The Petroleum Office blueprint
po.bp.econ.npv.irr, the one-well NPV and IRR whose numbers this workbook's economics matches on the same inputs.
Inputs
| Input | Unit | Default | Name |
|---|---|---|---|
| ROP, connections included (surface, intermediate, production) | ft/hr | 50, 40, 30 | ATD_SurfaceROP, ATD_IntermediateROP, ATD_ProductionROP |
| Trips: round trips in the section | count | 1, 2, 2 | ATD_SurfaceTrips, ATD_IntermediateTrips, ATD_ProductionTrips |
| Trip rate, one way | ft/hr | 1000 each | ATD_SurfaceTripRate, ATD_IntermediateTripRate, ATD_ProductionTripRate |
| Flat time: casing, cementing, logging, BOP test | hr | 24, 48, 48 | ATD_SurfaceFlatHours, ATD_IntermediateFlatHours, ATD_ProductionFlatHours |
| Spread rate: rig and time-dependent services | $/day | 45000 each | ATD_SurfaceDayRate, ATD_IntermediateDayRate, ATD_ProductionDayRate |
| Tangibles | $ | 200000, 350000, 450000 | ATD_SurfaceTangibles, ATD_IntermediateTangibles, ATD_ProductionTangibles |
| Fixed intangibles | $ | 100000, 200000, 250000 | ATD_SurfaceFixedIntangibles, ATD_IntermediateFixedIntangibles, ATD_ProductionFixedIntangibles |
| Contingency on the sub-total | % | 10 | ATD_Contingency |
| Actual days per section, typed | days | the plan's days | ATA_SurfaceDays, ATA_IntermediateDays, ATA_ProductionDays |
| Actual cost per section, typed | $ | the plan's cost | ATA_SurfaceCost, ATA_IntermediateCost, ATA_ProductionCost |
| D&C from the AFE | $MM | 2.839375 | AEC_DC |
The economics' other inputs are the shared synthetic well's own: AEC_Online, AEC_LifeCap, AEC_IP, AEC_b, AEC_Dei, AEC_Dterm, AEC_GOR, AEC_TC, AEC_Oil, AEC_OilDiff, AEC_Gas, AEC_GasDiff, AEC_Esc, AEC_WI, AEC_NRI, AEC_SevOil, AEC_SevGas, AEC_AdVal, AEC_LOE, AEC_LOEVar, AEC_Gath, AEC_PA, AEC_Phase4, AEC_Phase3, AEC_Phase2, AEC_Phase1, AEC_Disc, AEC_Hurdle and AEC_PayoutMax.
Sheets
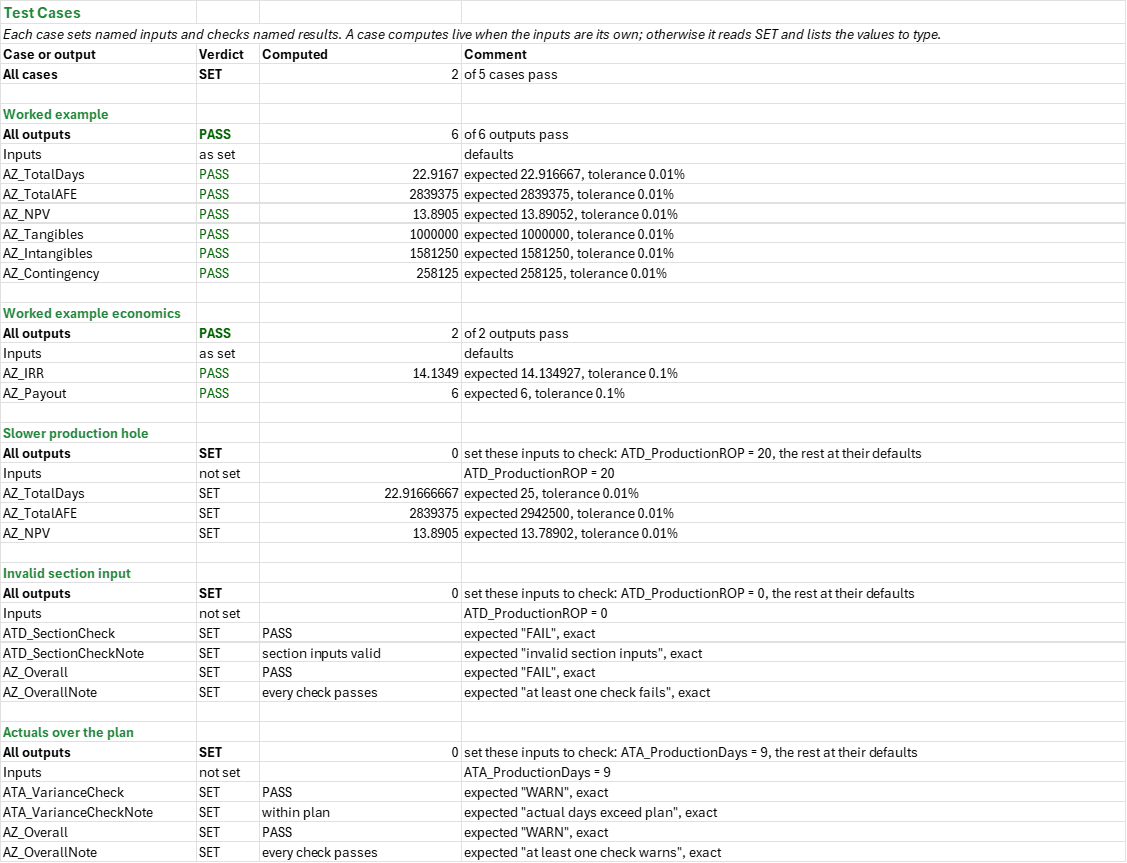
Guide— what the workbook answers and the order to work through its sheets.Time-Depth— the three hole sections' assumptions, each section's days and cost with the cumulative chain, the AFE build-up into tangibles, spread cost, fixed intangibles and contingency, the totals and the time-depth curve.Actuals— the actual days and cost typed for each section against the plan, with the day and cost variances.Economics— the shared synthetic well priced with the TOTAL AFE as its drilling and completion cost: the decline, limit and life, NPV, IRR, payout and PV/I, and the monthly cash flow.Summary— the plan, the economics and every check under one verdict.Test Cases— the worked example and other cases, with expected and computed results.
One chart: cumulative drilling days against depth.
Functions used
Names (88)
| Name | Refers to | Comment |
|---|---|---|
PO.DE.AFE.TimeDepthLAMBDA |
=LAMBDA(Top_ft, Base_ft, ROP_fthr, Trips, TripRate_fthr, Flat_hr, DayRate_usd, Fixed_usd, PrevDays, PrevCost_usd, LET(secDays, ((Base_ft - Top_ft)/ROP_fthr + Trips*2*Base_ft/TripRate_fthr + Flat_hr)/24, secCost, secDays*DayRate_usd + Fixed_usd, HSTACK(secDays, PrevDays + secDays, secCost, PrevCost_usd + secCost))) |
Days and cost of one hole section from ROP, round trips and flat time, and the running totals: {days, cumulative days, cost, cumulative cost}. |
PO.ECON.IRR.MonthlyLAMBDA |
=LAMBDA(cash,LET(cash_col,cash,grid_step,0.0025,rates,SEQUENCE(1,201,-0.05,grid_step),periods,SEQUENCE(ROWS(cash_col)),npv_grid,MMULT(TRANSPOSE(cash_col),(1+rates)^(-periods)),first_pos,IFERROR(XMATCH(TRUE,npv_grid>0),0),crossing,IF(first_pos=0,0,IFERROR(XMATCH(1,(SEQUENCE(1,201)>first_pos)*(npv_grid<=0)),0)),IF(crossing=0,"n/a",LET(r_lo,INDEX(rates,1,crossing-1),v_lo,INDEX(npv_grid,1,crossing-1),v_hi,INDEX(npv_grid,1,crossing),r_interp,r_lo+grid_step*v_lo/(v_lo-v_hi),r_refined,IFERROR(IRR(cash_col,r_lo),r_interp),(1+IF(AND(r_refined>=r_lo,r_refined<=r_lo+grid_step),r_refined,r_interp))^12-1)))) |
Annualised IRR of monthly cash flows: the first rate, scanning up from -5 %/month, at which NPV falls through zero; "n/a" when it never does |
PO.ECON.NPV.MonthlyLAMBDA |
=LAMBDA(cash,annual_rate,NPV((1+annual_rate)^(1/12)-1,cash)) |
NPV of end-of-month cash flows at an annual discount rate, in the units of cash. |
PO.ECON.PayoutLAMBDA |
=LAMBDA(cash,LET(cumulative,SCAN(0,cash,LAMBDA(running,flow,running+flow)),trough,MATCH(MIN(cumulative),cumulative,0),IFERROR(MATCH(1,(SEQUENCE(ROWS(cumulative))>trough)*(cumulative>=0),0),"none"))) |
Month in which cumulative cash flow climbs back to zero after its low point; "none" if it never does |
AEC_AdVal |
Economics!$B$22 |
Ad valorem tax, as a share of net revenue, % |
AEC_DC |
Economics!$B$4 |
Drilling and completion cost from the AFE, $MM |
AEC_Dei |
Economics!$B$9 |
Initial decline, effective secant, %/yr |
AEC_Disc |
Economics!$B$31 |
Discount rate, end-of-month cash flows, %/yr |
AEC_Dterm |
Economics!$B$10 |
Terminal decline, effective, %/yr |
AEC_Esc |
Economics!$B$17 |
Escalation of prices and operating costs, %/yr |
AEC_GOR |
Economics!$B$11 |
Gas-oil ratio, constant over life, scf/STB |
AEC_Gas |
Economics!$B$15 |
Gas price (Henry Hub, 1 MMBtu per Mscf), $/MMBtu |
AEC_GasDiff |
Economics!$B$16 |
Gas differential, deducted (Waha basis), $/MMBtu |
AEC_Gath |
Economics!$B$25 |
Gas gathering and processing, $/Mscf |
AEC_Hurdle |
Economics!$B$32 |
IRR hurdle, %/yr |
AEC_IP |
Economics!$B$7 |
Initial oil rate of the type curve, STB/d |
AEC_Inputs |
Economics!$A$4:$C$33 |
The well's timing and type curve, prices, interests and taxes, costs and capital phasing, the discount rate, the IRR hurdle and the payout limit, and the D&C cost the AFE gives |
AEC_LOE |
Economics!$B$23 |
Fixed LOE, $/well-month |
AEC_LOEVar |
Economics!$B$24 |
Variable LOE per barrel of oil, $/STB |
AEC_LifeCap |
Economics!$B$6 |
Longest producing life of the well, months |
AEC_NRI |
Economics!$B$19 |
Net revenue interest, % |
AEC_NpvCheck |
Economics!$B$62 |
IRR hurdle verdict |
AEC_NpvCheckNote |
Economics!$C$62 |
IRR hurdle comment |
AEC_Oil |
Economics!$B$13 |
Oil price (WTI), $/STB |
AEC_OilDiff |
Economics!$B$14 |
Oil differential, deducted, $/STB |
AEC_Online |
Economics!$B$5 |
Month the well comes online, months |
AEC_PA |
Economics!$B$26 |
Plugging and abandonment, $ |
AEC_PayoutMax |
Economics!$B$33 |
Longest acceptable payout, from month 1, months |
AEC_Phase1 |
Economics!$B$30 |
D&C share spent the month before online, % |
AEC_Phase2 |
Economics!$B$29 |
D&C share spent two months before online, % |
AEC_Phase3 |
Economics!$B$28 |
D&C share spent three months before online, % |
AEC_Phase4 |
Economics!$B$27 |
D&C share spent four months before, % |
AEC_Results |
Economics!$A$41:$C$59 |
The decline terms, the economic limit and the life, the months in the cash flow, and the NPV, IRR, payout, discounted capital, PV/I, EUR and net cash |
AEC_SevGas |
Economics!$B$21 |
Gas severance tax, of the gas's value, % |
AEC_SevOil |
Economics!$B$20 |
Oil severance tax, of the oil's value, % |
AEC_TC |
Economics!$B$12 |
Type-curve factor |
AEC_WI |
Economics!$B$18 |
Working interest, % |
AEC_b |
Economics!$B$8 |
Arps hyperbolic exponent b |
ATA_Inputs |
Actuals!$A$6:$I$9 |
The actual days and cost each section took, typed by the user |
ATA_IntermediateCost |
Actuals!$D$8 |
Intermediate actual cost, $ |
ATA_IntermediateDays |
Actuals!$B$8 |
Intermediate actual days, days |
ATA_ProductionCost |
Actuals!$D$9 |
Production actual cost, $ |
ATA_ProductionDays |
Actuals!$B$9 |
Production actual days, days |
ATA_Results |
Actuals!$A$10:$I$10 |
The actuals' totals and their variances against the plan |
ATA_SurfaceCost |
Actuals!$D$7 |
Surface actual cost, $ |
ATA_SurfaceDays |
Actuals!$B$7 |
Surface actual days, days |
ATA_VarianceCheck |
Actuals!$B$13 |
Actuals against the plan verdict |
ATA_VarianceCheckNote |
Actuals!$C$13 |
Actuals against the plan comment |
ATD_Contingency |
'Time-Depth'!$B$12 |
Contingency on the sub-total, % |
ATD_Curve |
'Time-Depth'!$A$37:$C$40 |
Cumulative drilling days against depth |
ATD_Inputs |
'Time-Depth'!$A$7:$O$12 |
The three sections' drilling assumptions and the plan-wide assumptions: ROP, round trips, trip rate, flat time, spread rate, tangibles, fixed intangibles and contingency |
ATD_IntermediateDayRate |
'Time-Depth'!$J$9 |
Intermediate spread rate, $/day |
ATD_IntermediateFixedIntangibles |
'Time-Depth'!$N$9 |
Intermediate fixed intangibles, $ |
ATD_IntermediateFlatHours |
'Time-Depth'!$H$9 |
Intermediate flat time, hr |
ATD_IntermediateROP |
'Time-Depth'!$B$9 |
Intermediate ROP, ft/hr |
ATD_IntermediateTangibles |
'Time-Depth'!$L$9 |
Intermediate tangibles, $ |
ATD_IntermediateTripRate |
'Time-Depth'!$F$9 |
Intermediate trip rate, ft/hr |
ATD_IntermediateTrips |
'Time-Depth'!$D$9 |
Intermediate round trips, count |
ATD_ProductionDayRate |
'Time-Depth'!$J$10 |
Production spread rate, $/day |
ATD_ProductionFixedIntangibles |
'Time-Depth'!$N$10 |
Production fixed intangibles, $ |
ATD_ProductionFlatHours |
'Time-Depth'!$H$10 |
Production flat time, hr |
ATD_ProductionROP |
'Time-Depth'!$B$10 |
Production ROP, ft/hr |
ATD_ProductionTangibles |
'Time-Depth'!$L$10 |
Production tangibles, $ |
ATD_ProductionTripRate |
'Time-Depth'!$F$10 |
Production trip rate, ft/hr |
ATD_ProductionTrips |
'Time-Depth'!$D$10 |
Production round trips, count |
ATD_Results |
'Time-Depth'!$A$16:$S$33 |
The section schedule, the cost build-up and the totals: the section days and costs, the cumulative days and costs, the tangibles, the spread cost, the fixed intangibles, the contingency and the AFE |
ATD_SectionCheck |
'Time-Depth'!$B$43 |
Section inputs verdict |
ATD_SectionCheckNote |
'Time-Depth'!$C$43 |
Section inputs comment |
ATD_SurfaceDayRate |
'Time-Depth'!$J$8 |
Surface spread rate, $/day |
ATD_SurfaceFixedIntangibles |
'Time-Depth'!$N$8 |
Surface fixed intangibles, $ |
ATD_SurfaceFlatHours |
'Time-Depth'!$H$8 |
Surface flat time, hr |
ATD_SurfaceROP |
'Time-Depth'!$B$8 |
Surface ROP, ft/hr |
ATD_SurfaceTangibles |
'Time-Depth'!$L$8 |
Surface tangibles, $ |
ATD_SurfaceTripRate |
'Time-Depth'!$F$8 |
Surface trip rate, ft/hr |
ATD_SurfaceTrips |
'Time-Depth'!$D$8 |
Surface round trips, count |
AZ_Contingency |
Summary!$B$7 |
Total contingency, $ |
AZ_CostVariance |
Summary!$B$10 |
Actual cost variance, $ |
AZ_DayVariance |
Summary!$B$9 |
Actual day variance, days |
AZ_IRR |
Summary!$B$13 |
IRR, %/yr |
AZ_Intangibles |
Summary!$B$6 |
Total intangibles, $ |
AZ_NPV |
Summary!$B$12 |
NPV, $MM |
AZ_Overall |
Summary!$B$20 |
Overall verdict |
AZ_OverallNote |
Summary!$C$20 |
Overall comment |
AZ_Payout |
Summary!$B$14 |
Payout, months |
AZ_Results |
Summary!$A$4:$C$20 |
The plan, the actuals against it, the economics of the shared synthetic well, and every check of the workbook |
AZ_Tangibles |
Summary!$B$5 |
Total tangibles, $ |
AZ_TotalAFE |
Summary!$B$8 |
TOTAL AFE, $ |
AZ_TotalDays |
Summary!$B$4 |
Total planned days, days |
Details
| Opens in | Needs Microsoft 365 or Excel 2024: it uses functions Excel 2016 doesn't have, such as named LAMBDAs, which show #NAME? there. |
| File | AfeTimeDepth.xlsx, 66 KB |
| Category | Drilling |
| For agents and tools | Descriptor (.md) |