Hydrate Curve Against a Flowline's Pressure-Temperature Path
Description
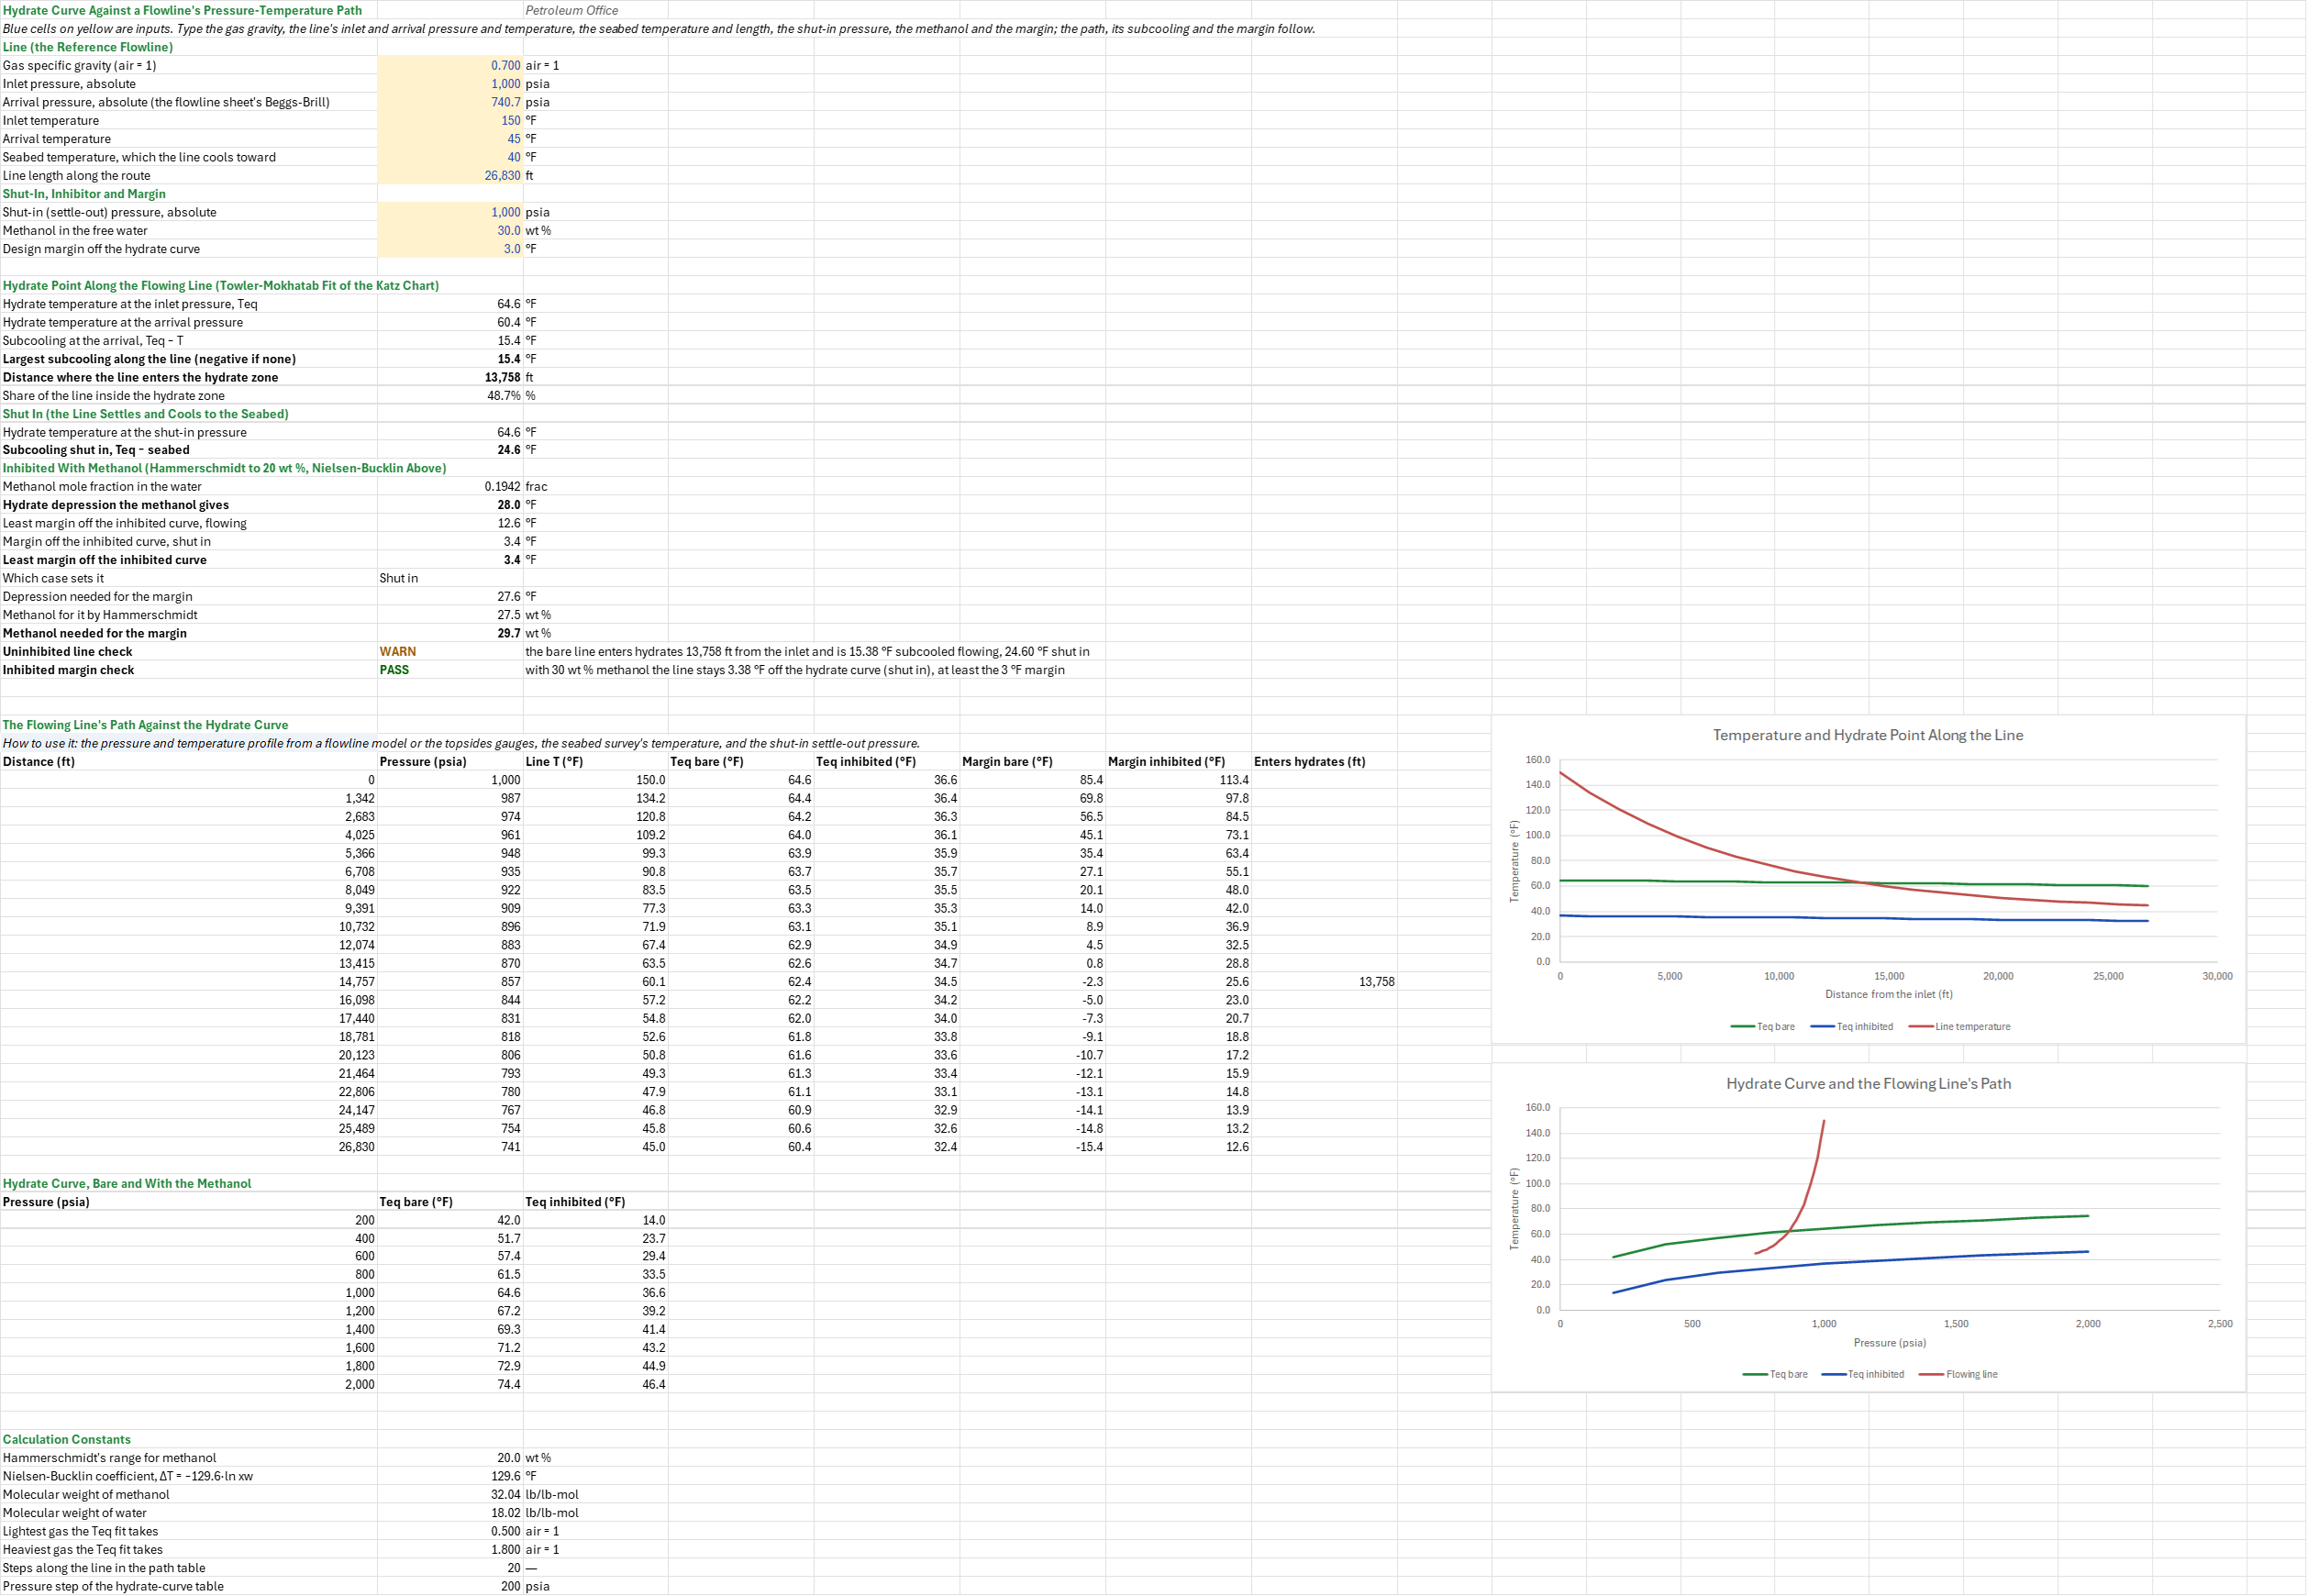
Where along a subsea flowline does the gas enter the hydrate zone, how deep does it go, and how much margin does the methanol in the water keep? You enter the gas gravity, the line's inlet and arrival pressures and temperatures, its length, the seabed temperature, the shut-in pressure, the methanol in the water and the design margin. You read off where the line enters the hydrate zone, its subcooling flowing and shut in, the margin off the inhibited curve, and the methanol the design margin needs.
Parameters:
- Line: the gas gravity
HCV_SG, the inlet and arrival pressuresHCV_Pin,HCV_Pout, the inlet and arrival temperaturesHCV_Tin,HCV_Tout, the seabed temperatureHCV_Tseaand the lengthHCV_L - Shut-in, inhibitor and margin: the settle-out pressure
HCV_Pshut, the methanol in the free waterHCV_MeOHin wt %, and the design marginHCV_Marginoff the hydrate curve
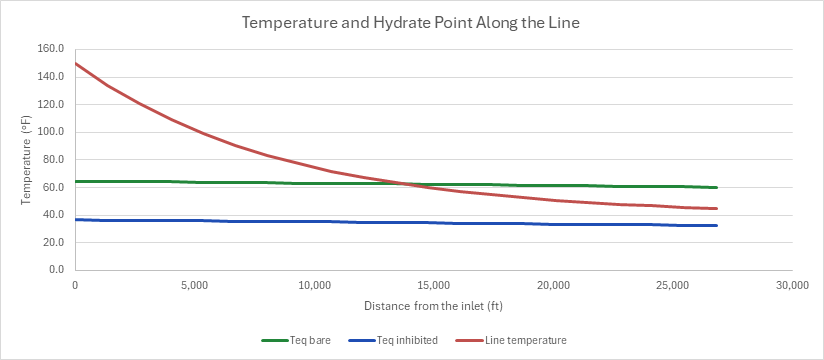
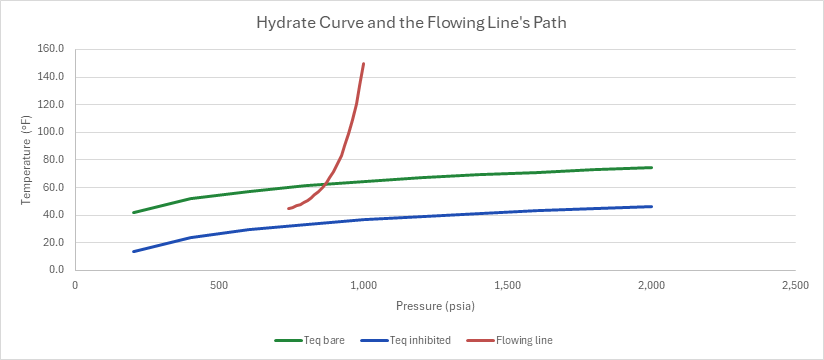
How to use it: Take the pressure and temperature profile from a flowline model or the topsides and subsea gauges, the seabed temperature from the route survey, and the settle-out pressure from a shut-in (or the highest pressure the line can pack to). Measure the methanol in the produced water at the arrival; the injected rate over-states it when methanol is lost to the gas and the condensate. The sheet lays the line's path against the Katz gas-gravity hydrate curve at 21 stations from the inlet to the arrival, takes the subcooling at each, and repeats the comparison against the curve the methanol depresses; it does the same for the shut-in line, which settles at one pressure and cools to the seabed. Read which case, flowing or shut in, sets the margin, and the methanol that margin needs. One chart draws the line's temperature and the bare and inhibited hydrate points along the line; the other draws the hydrate curves against pressure with the flowing line's path across them.
Method:
- Path. Distance runs from 0 to the line length in 20 equal steps. The pressure falls in a straight line from the inlet to the arrival. The temperature cools exponentially toward the seabed, T(x) = Tsea + (Tin − Tsea)·((Tout − Tsea)/(Tin − Tsea))^(x/L), the steady-state profile of a line with a constant overall heat-transfer coefficient, passed through the two measured ends.
- Hydrate point. Towler and Mokhatab's (2005) fit of the Katz chart: Teq = 13.47·ln p + 34.27·ln γ − 1.675·ln p·ln γ − 20.35, p in psia and Teq in °F. The margin at a station is T − Teq, and the subcooling is its negative (the subcooling function at the arrival). Where the margin changes sign between two stations, the sheet interpolates the entry distance linearly.
- Shut in. The settled line is at the settle-out pressure and the seabed temperature everywhere, so its subcooling is Teq(Pshut) − Tsea.
- Methanol. Up to 20 wt % the depression is Hammerschmidt's, ΔT = 2,335·W/(32.04·(100 − W)). Above it the sheet takes Nielsen and Bucklin's ΔT = −129.6·ln xw, xw the water's mole fraction in the inhibited water (methanol 32.04, water 18.015). The inhibited curve is Teq − ΔT, and the margins are taken against it, flowing and shut in.
- Methanol needed. The depression needed is the larger subcooling, flowing or shut in, plus the margin. The concentration for it is Hammerschmidt's while that stays within 20 wt %, and Nielsen and Bucklin's above it, as the Hydrate Inhibitor Dosing for Methanol and MEG sheet doses.
- Checks.
- Uninhibited line: whether the bare line enters hydrates, flowing or shut in; it fails for a gas gravity outside the fit's 0.5 to 1.8, or an arrival no warmer than the seabed.
- Inhibited margin: the least margin off the inhibited curve against the design margin; a warning under it, a failure inside the curve.
Example: The default case is the flow-assurance family's reference flowline: a 6-in subsea tieback carrying 20 MMscf/d of a 0.7 gravity gas with 3 % CO2 and 500 ppm H2S, 1,000 STB/d of the reference black oil and 500 bbl/d of water, entering at 1,000 psia and 150 °F and arriving at 45 °F. Its length, 26,830 ft, and its 740.7 psia arrival are those of the Multiphase Flowline by Beggs and Brill sheet over the same route. The 40 °F seabed is this sheet's choice, a little under the arrival. Shut in, the line settles at the 1,000 psia the Hydrate Inhibitor Dosing for Methanol and MEG sheet designs at, and cools to the seabed. The water carries 30 wt % methanol, and the design margin is 3 °F.
At the 1,000 psia inlet the 0.7 gravity gas forms hydrates below 64.60 °F, and at the 740.7 psia arrival below 60.38 °F. The line cools from 150 °F and crosses its hydrate curve 13,758 ft from the inlet, so 48.7 % of the line runs in the hydrate zone, and it arrives 15.38 °F subcooled. Shut in at 1,000 psia and cooled to the 40 °F seabed, it is 24.60 °F subcooled, which is the inhibitor sheet's 19.60 °F at 45 °F plus the 5 °F it cools further. The 30 wt % methanol (a mole fraction of 0.194) depresses the curve by 27.98 °F by Nielsen-Bucklin. Flowing, that leaves at least 12.60 °F of margin; shut in, 3.38 °F, which sets the design and meets the 3 °F margin. The margin needs 27.60 °F of depression: 29.68 wt % of methanol, since Hammerschmidt's 27.47 wt % is past its range.
Functions used
PO.FA.Hydrate.Teq(P, SG_gas)
Calculates the hydrate formation temperature of a sweet gas with free water from its gravity (Towler-Mokhatab 2005 fit of the Katz chart; no N2, CO2, H2S or inhibitor correction). At 1,000 psia, gravity 0.8: 67.6 degF vs 66 degF on Ahmed's chart, [degF].
PO.FA.Hydrate.dTsub(T_hyd, T_op)
Calculates subcooling (hydrate formation temp minus operating temp), [deltaF].
PO.FA.Hydrate.dT.MeOH(W)
Calculates temperature depression from methanol using Hammerschmidt equation, [deltaF].
PO.FA.Hydrate.Conc.MeOH(dT)
Calculates required methanol concentration for target temperature depression, by weight, [%].
Names (43)
| Name | Refers to | Comment |
|---|---|---|
HCV_SG |
$B$4 |
Gas specific gravity (air = 1), air = 1 |
HCV_Pin |
$B$5 |
Inlet pressure, absolute, psia |
HCV_Pout |
$B$6 |
Arrival pressure, absolute (the flowline sheet's Beggs-Brill), psia |
HCV_Tin |
$B$7 |
Inlet temperature, °F |
HCV_Tout |
$B$8 |
Arrival temperature, °F |
HCV_Tsea |
$B$9 |
Seabed temperature, which the line cools toward, °F |
HCV_L |
$B$10 |
Line length along the route, ft |
HCV_Pshut |
$B$12 |
Shut-in (settle-out) pressure, absolute, psia |
HCV_MeOH |
$B$13 |
Methanol in the free water, wt % |
HCV_Margin |
$B$14 |
Design margin off the hydrate curve, °F |
HCV_Inputs |
$B$4:$B$14 |
The gas gravity, the line's inlet and arrival pressures and temperatures, the seabed temperature, the line length, the shut-in pressure, the methanol in the water and the design margin |
HCV_TeqIn |
$B$17 |
Hydrate temperature at the inlet pressure, Teq, °F |
HCV_TeqOut |
$B$18 |
Hydrate temperature at the arrival pressure, °F |
HCV_SubOut |
$B$19 |
Subcooling at the arrival, Teq − T, °F |
HCV_SubMax |
$B$20 |
Largest subcooling along the line (negative if none), °F |
HCV_Onset |
$B$21 |
Distance where the line enters the hydrate zone, ft |
HCV_ZoneFrac |
$B$22 |
Share of the line inside the hydrate zone, % |
HCV_TeqShut |
$B$24 |
Hydrate temperature at the shut-in pressure, °F |
HCV_SubShut |
$B$25 |
Subcooling shut in, Teq − seabed, °F |
HCV_xMeOH |
$B$27 |
Methanol mole fraction in the water, frac |
HCV_dT |
$B$28 |
Hydrate depression the methanol gives, °F |
HCV_MarginFlow |
$B$29 |
Least margin off the inhibited curve, flowing, °F |
HCV_MarginShut |
$B$30 |
Margin off the inhibited curve, shut in, °F |
HCV_MarginMin |
$B$31 |
Least margin off the inhibited curve, °F |
HCV_Governs |
$B$32 |
Which case sets it |
HCV_dTNeed |
$B$33 |
Depression needed for the margin, °F |
HCV_MeOHHam |
$B$34 |
Methanol for it by Hammerschmidt, wt % |
HCV_MeOHNeed |
$B$35 |
Methanol needed for the margin, wt % |
HCV_BareCheck |
$B$36 |
Uninhibited line check verdict |
HCV_BareCheckNote |
$C$36 |
Uninhibited line check comment |
HCV_Check |
$B$37 |
Inhibited margin check verdict |
HCV_CheckNote |
$C$37 |
Inhibited margin check comment |
HCV_Results |
$B$17:$B$37 |
Hydrate temperature at inlet and arrival, the subcooling at the arrival and at worst, where the line enters the hydrate zone, the shut-in hydrate point and subcooling, the methanol's depression and margins, the methanol the margin needs, two checks |
HCV_Profile |
$A$43:$H$63 |
Distance along the line, the pressure (straight from inlet to arrival) and temperature (cooling toward the seabed), the hydrate temperature bare and with the methanol, the margins off each, and where the line crosses into the hydrate zone |
HCV_Curve |
$A$67:$C$76 |
The hydrate temperature against pressure in steps, with no inhibitor and with the methanol's depression |
HCV_HamMax |
$B$80 |
Hammerschmidt's range for methanol, wt % |
HCV_NB |
$B$81 |
Nielsen-Bucklin coefficient, ΔT = −129.6·ln xw, °F |
HCV_MwMeOH |
$B$82 |
Molecular weight of methanol, lb/lb-mol |
HCV_MwW |
$B$83 |
Molecular weight of water, lb/lb-mol |
HCV_SGMin |
$B$84 |
Lightest gas the Teq fit takes, air = 1 |
HCV_SGMax |
$B$85 |
Heaviest gas the Teq fit takes, air = 1 |
HCV_Steps |
$B$86 |
Steps along the line in the path table |
HCV_Pstep |
$B$87 |
Pressure step of the hydrate-curve table, psia |
Details
| Inserts | 87 rows × 8 columns |
| Category | Flow Assurance |
| For agents and tools | Descriptor (.md) |