Break-Even Oil Price
Description
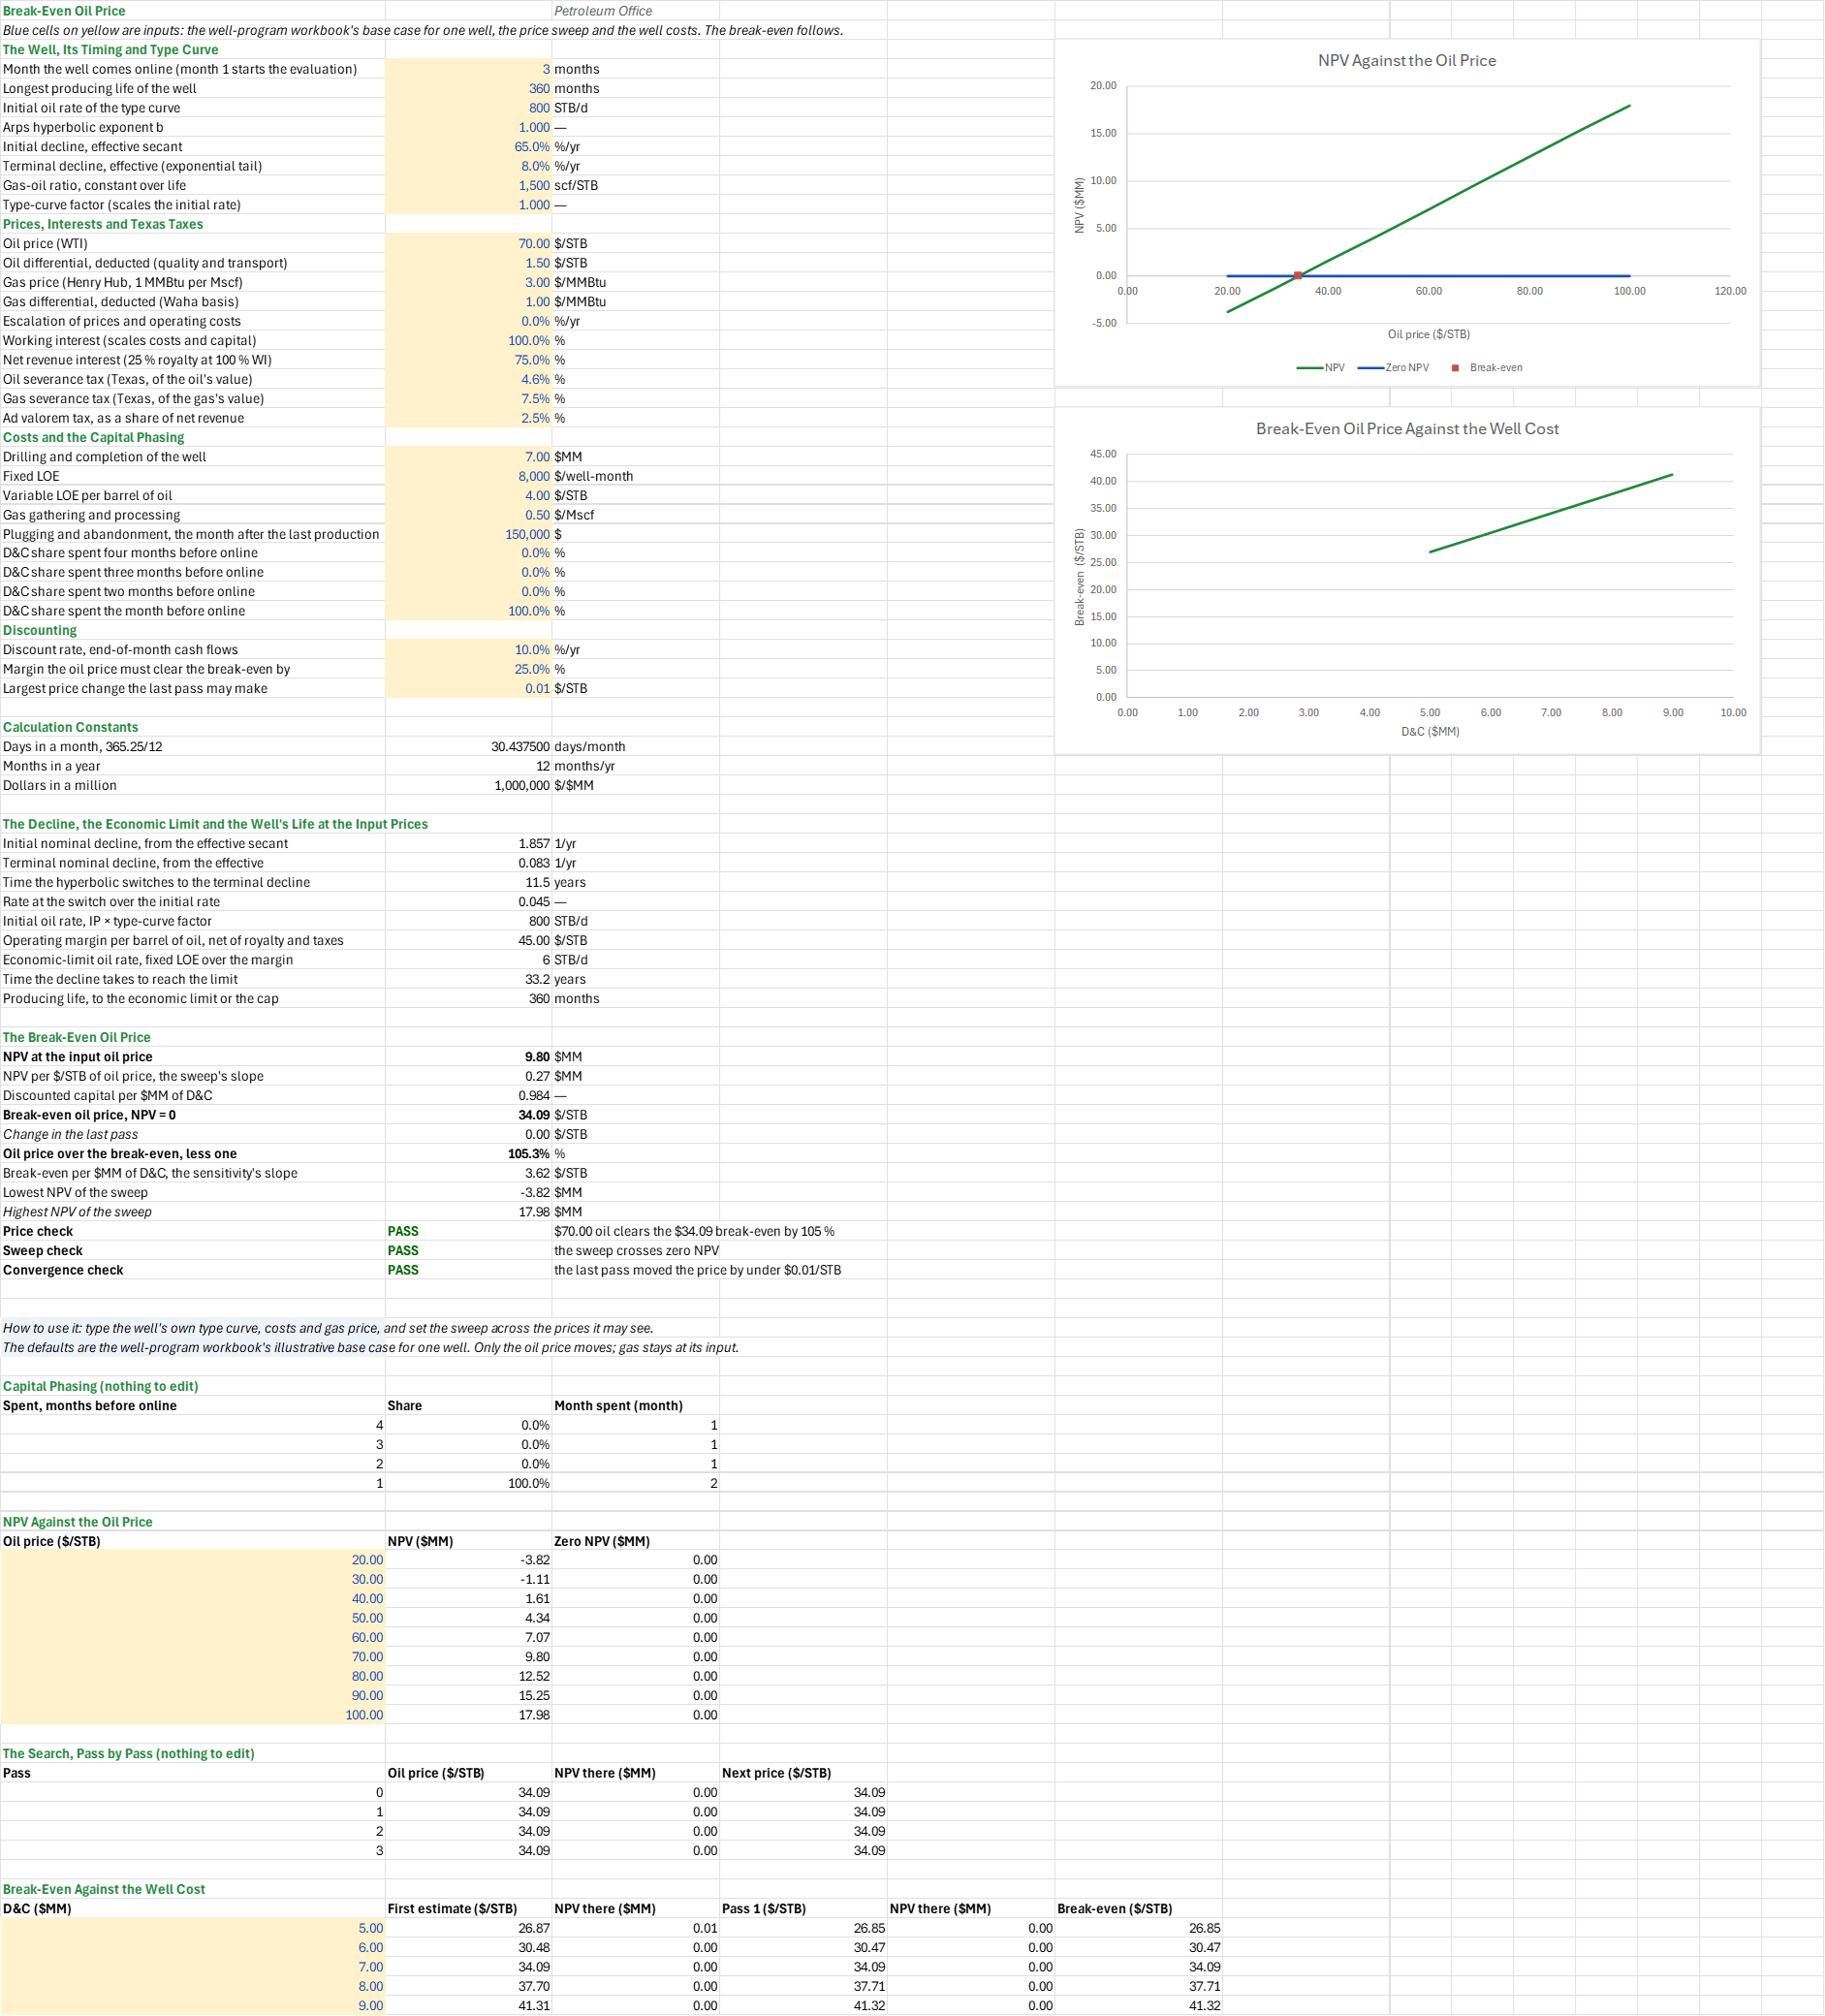
At what oil price does a well stop paying for itself, and how much does that price move with the well's cost? You enter one well's type curve, prices, interests, taxes, costs and discount rate, a sweep of oil prices and a range of well costs. You read off the break-even, the oil price at which the well's NPV is zero, how far the input price clears it, and the break-even at each well cost.
Parameters:
- The well: the month it comes online
BE_Online, the life capBE_LifeCap(months), the type curve's initial rateBE_IP(STB/d), Arps exponentBE_b, effective secant initial declineBE_Dei, effective terminal declineBE_Dterm, the gas-oil ratioBE_GOR(scf/STB) and the type-curve factorBE_TC - Prices: oil
BE_Oil(/MMBtu) lessBE_GasDiff, and escalationBE_Esc - Interests and taxes:
BE_WI,BE_NRI, severanceBE_SevOilandBE_SevGas, and ad valoremBE_AdVal - Costs: the D&C
BE_DC(/well-month), variable LOEBE_LOEVar(/Mscf), pluggingBE_PA($), and the D&C phasingBE_Phase4toBE_Phase1 - Discounting and the search: the discount rate
BE_Disc, the cushion the oil price must clear the break-even byBE_Cushion, and the largest price change the last pass may makeBE_Tol($/STB) - Sweep and well costs: the oil prices of the sweep table, and the D&C values of the well-cost table
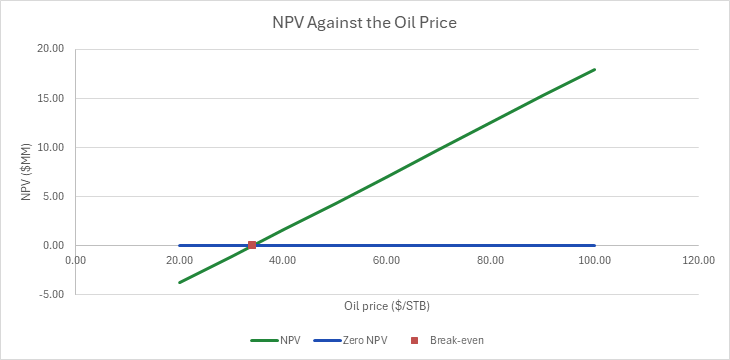
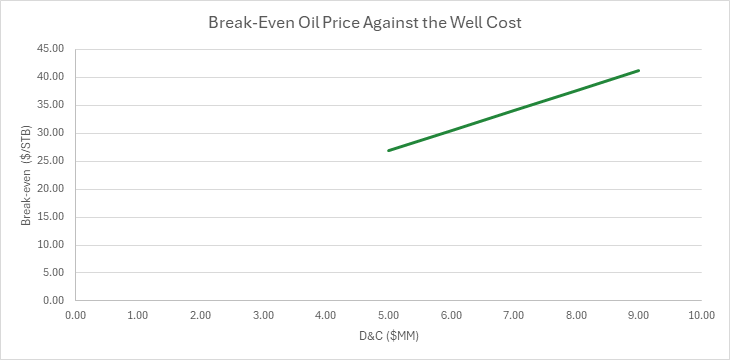
How to use it: The well is the workbook's illustrative case, not a forecast. Type the well's own type curve, costs and gas price over the inputs, set the sweep across the prices the well may see so that its NPVs straddle zero, and the well costs across the range of AFEs being weighed. The sheet prices the well's monthly cash flow at each sweep price, takes the sweep's zero crossing as a first estimate and refines it with three Newton passes on the full model; the same search at five well costs gives the break-even against the D&C. The first chart draws the NPV against the oil price, with the zero line and the break-even marked; the second draws the break-even against the well cost. Check that the input oil price is above the break-even and clears it by at least the cushion, that the sweep's NPVs straddle zero so that it brackets a break-even, and that the last pass moves the price by less than the tolerance.
Method: Each NPV is the full monthly model of the NPV and IRR sheet, written as one cell, with the capital phased over the months before first production: the type curve sampled at mid-month to the economic limit, the operating margin per barrel u = (Oil − OilDiff)·NRI·(1 − SevOil − AdVal) + GOR/1000·((Gas − GasDiff)·NRI·(1 − SevGas − AdVal) − Gath·WI) − LOEVar·WI, a month's cash esc·(u·oil − LOE·WI) − capital − plugging, discounted end of month. For a fixed producing life the NPV is linear in the oil price, slope NRI·(1 − SevOil − AdVal) times the discounted oil; the life shortens as the price falls, so the NPV is only nearly linear. Pass 0 is the crossing of the sweep's NPV line with zero, by linear interpolation between the sweep's prices. Each pass then prices its oil price on the full model and steps by −NPV/S, S the sweep's least-squares slope, $MM per $/STB; the passes are rows, not a circular reference, and the last row's next price is the break-even. The D&C enters the cash flow linearly, through the discounted capital per $MM of D&C, K = WI·Σ shareᵢ·(1 + Disc)^(−monthᵢ/12)/Σ shareᵢ, so a well cost's first estimate is the base break-even plus (D&C − base D&C)·K/S, refined by two passes.
Example: The well-program workbook's base case for one well, the same well as the NPV and IRR sheet: one Texas horizontal, 800 STB/d on an Arps hyperbolic with b = 1 and a 65 %/yr secant decline to an 8 %/yr tail, 1,500 scf/STB, a 100 % WI and 75 % NRI, Texas severance and ad valorem, a $7MM well spent the month before it comes online in month 3, $8,000 a month of fixed LOE and 10 % discounting. Oil is $70/STB and gas $3.00/MMBtu. The sweep runs from $20 to $100 in $10 steps and the well costs from $5MM to $9MM; the cushion is 25 % and the tolerance $0.01/STB.
The NPV at $70 oil is $9.80MM, the NPV and IRR sheet's. The sweep runs from −$3.82MM at $20 to $17.98MM at $100, with a least-squares slope of $0.2726MM per $/STB, and crosses zero at $34.09/STB by interpolation between $30 (−$1.11MM) and $40 (+$1.61MM). Three passes settle the break-even at $34.09/STB to a millionth of a dollar; the input price clears it by 105 %. A $1MM well costs 1.1^(−2/12) = $0.984MM discounted, so the break-even rises by 0.984/0.2726 = $3.61/STB per $MM: the table gives $26.85, $30.47, $34.09, $37.71 and $41.32/STB at $5MM to $9MM, a least-squares slope of $3.618/STB per $MM. At $40 oil the NPV is $1.61MM, 17.3 % above the break-even, inside the 25 % cushion; at $30 it is −$1.11MM, below the break-even. At $1.50/MMBtu gas the NPV is $9.20MM and the break-even $36.27/STB. These break-evens match a bisection on a plain monthly loop of the workbook's model to the cent.
Functions used
PO.Spline.Linear.Intersect(x_values_1, y_values_1, x_values_2, y_values_2, [occurrence])
Calculates x value of intersection point between two linear splines. When they cross more than once, occurrence picks which crossing (1 or omitted: the first, -1: the last).
Names (69)
| Name | Refers to | Comment |
|---|---|---|
PO.ECON.NPV.MonthlyLAMBDA |
=LAMBDA(cash,annual_rate,NPV((1+annual_rate)^(1/12)-1,cash)) |
NPV of end-of-month cash flows at an annual discount rate, in the units of cash. |
PO.ECON.Capex.PhasingLAMBDA |
=LAMBDA(total,profile,total*profile/SUM(profile)) |
Spreads a capital total over periods in proportion to a phasing profile; returns an array the shape of the profile, in the units of total. |
BE_Online |
$B$4 |
Month the well comes online (month 1 starts the evaluation), months |
BE_LifeCap |
$B$5 |
Longest producing life of the well, months |
BE_IP |
$B$6 |
Initial oil rate of the type curve, STB/d |
BE_b |
$B$7 |
Arps hyperbolic exponent b |
BE_Dei |
$B$8 |
Initial decline, effective secant, %/yr |
BE_Dterm |
$B$9 |
Terminal decline, effective (exponential tail), %/yr |
BE_GOR |
$B$10 |
Gas-oil ratio, constant over life, scf/STB |
BE_TC |
$B$11 |
Type-curve factor (scales the initial rate) |
BE_Oil |
$B$13 |
Oil price (WTI), $/STB |
BE_OilDiff |
$B$14 |
Oil differential, deducted (quality and transport), $/STB |
BE_Gas |
$B$15 |
Gas price (Henry Hub, 1 MMBtu per Mscf), $/MMBtu |
BE_GasDiff |
$B$16 |
Gas differential, deducted (Waha basis), $/MMBtu |
BE_Esc |
$B$17 |
Escalation of prices and operating costs, %/yr |
BE_WI |
$B$18 |
Working interest (scales costs and capital), % |
BE_NRI |
$B$19 |
Net revenue interest (25 % royalty at 100 % WI), % |
BE_SevOil |
$B$20 |
Oil severance tax (Texas, of the oil's value), % |
BE_SevGas |
$B$21 |
Gas severance tax (Texas, of the gas's value), % |
BE_AdVal |
$B$22 |
Ad valorem tax, as a share of net revenue, % |
BE_DC |
$B$24 |
Drilling and completion of the well, $MM |
BE_LOE |
$B$25 |
Fixed LOE, $/well-month |
BE_LOEVar |
$B$26 |
Variable LOE per barrel of oil, $/STB |
BE_Gath |
$B$27 |
Gas gathering and processing, $/Mscf |
BE_PA |
$B$28 |
Plugging and abandonment, the month after the last production, $ |
BE_Phase4 |
$B$29 |
D&C share spent four months before online, % |
BE_Phase3 |
$B$30 |
D&C share spent three months before online, % |
BE_Phase2 |
$B$31 |
D&C share spent two months before online, % |
BE_Phase1 |
$B$32 |
D&C share spent the month before online, % |
BE_Disc |
$B$34 |
Discount rate, end-of-month cash flows, %/yr |
BE_Cushion |
$B$35 |
Margin the oil price must clear the break-even by, % |
BE_Tol |
$B$36 |
Largest price change the last pass may make, $/STB |
BE_Phasing |
$B$29:$B$32 |
The D&C phasing shares, four months before the well comes online down to the month before |
BE_Inputs |
$B$4:$B$36 |
The well's timing and type curve, prices, interests and taxes, costs and capital phasing, the discount rate, the price cushion and the search tolerance |
BE_Days |
$B$39 |
Days in a month, 365.25/12, days/month |
BE_MoYr |
$B$40 |
Months in a year, months/yr |
BE_PerMM |
$B$41 |
Dollars in a million, $/$MM |
BE_Di |
$B$44 |
Initial nominal decline, from the effective secant, 1/yr |
BE_Dt |
$B$45 |
Terminal nominal decline, from the effective, 1/yr |
BE_Ts |
$B$46 |
Time the hyperbolic switches to the terminal decline, years |
BE_Qs |
$B$47 |
Rate at the switch over the initial rate |
BE_Qi |
$B$48 |
Initial oil rate, IP × type-curve factor, STB/d |
BE_Margin |
$B$49 |
Operating margin per barrel of oil, net of royalty and taxes, $/STB |
BE_QLimit |
$B$50 |
Economic-limit oil rate, fixed LOE over the margin, STB/d |
BE_TLimit |
$B$51 |
Time the decline takes to reach the limit, years |
BE_Life |
$B$52 |
Producing life, to the economic limit or the cap, months |
BE_NPV |
$B$55 |
NPV at the input oil price, $MM |
BE_Slope |
$B$56 |
NPV per $/STB of oil price, the sweep's slope, $MM |
BE_CapitalPv |
$B$57 |
Discounted capital per $MM of D&C |
BE_Breakeven |
$B$58 |
Break-even oil price, NPV = 0, $/STB |
BE_LastChange |
$B$59 |
Change in the last pass, $/STB |
BE_Headroom |
$B$60 |
Oil price over the break-even, less one, % |
BE_CostSlope |
$B$61 |
Break-even per $MM of D&C, the sensitivity's slope, $/STB |
BE_SweepMin |
$B$62 |
Lowest NPV of the sweep, $MM |
BE_SweepMax |
$B$63 |
Highest NPV of the sweep, $MM |
BE_PriceCheck |
$B$64 |
Price check verdict |
BE_PriceCheckNote |
$C$64 |
Price check comment |
BE_SweepCheck |
$B$65 |
Sweep check verdict |
BE_SweepCheckNote |
$C$65 |
Sweep check comment |
BE_ConvergenceCheck |
$B$66 |
Convergence check verdict |
BE_ConvergenceCheckNote |
$C$66 |
Convergence check comment |
BE_Results |
$B$44:$B$66 |
The decline terms, the economic limit and life, the NPV at the input price, the sweep's slope, the discounted capital per $MM, the break-even and its headroom, the cost slope and three checks |
BE_CapitalPhasing |
$A$74:$C$77 |
Each D&C share's lead, its share and the month it is spent (before month 1 it falls in month 1) |
BE_Spend |
$C$74:$C$77 |
The month each D&C share is spent, four months before online down to the month before |
BE_Sweep |
$A$81:$C$89 |
Oil prices, the well's NPV at each with the rest at the inputs, and the zero line |
BE_Search |
$A$93:$D$96 |
Pass 0 reads the sweep's crossing; each pass prices its oil price and steps by minus the NPV over the slope |
BE_Costs |
$A$100:$F$104 |
Well costs, a first estimate of each break-even, two Newton passes and the break-even |
BE_SweepCurve |
$A$81:$C$89 |
NPV Against the Oil Price |
BE_CostCurve |
$A$100:$F$104 |
Break-Even Oil Price Against the Well Cost |
Details
| Inserts | 104 rows × 6 columns |
| Category | Petroleum Economics |
| For agents and tools | Descriptor (.md) |