Decline Economics

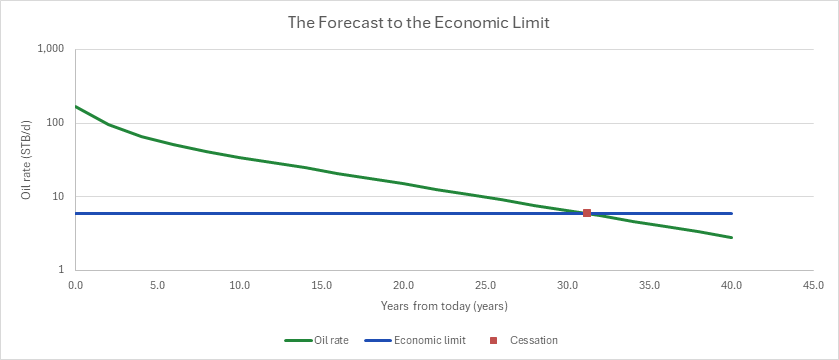
Description
How much oil is left in a producing well, what is it worth, and when does the well stop paying? You enter the well's Arps type curve and months on production, the price deck, interests, taxes and costs. You read off the economic limit, the date the forecast falls to it (the cessation of production), the remaining reserves to that date, their PV after operating costs and plugging, and the economic life left.
Parameters:
- The well: the months it has produced
DEC_Age, the date the forecast startsDEC_Start, the forecast's horizonDEC_Horizon(months), the type curve's initial rateDEC_IP(STB/d), Arps exponentDEC_b, effective secant initial declineDEC_Deiand effective terminal declineDEC_Dterm, the gas-oil ratioDEC_GOR(scf/STB) and the type-curve factorDEC_TC - Prices, interests and taxes: oil
DEC_Oil(/MMBtu) lessDEC_GasDiff, the escalationDEC_Esc, working interestDEC_WI, net revenue interestDEC_NRI, severanceDEC_SevOilandDEC_SevGas, and ad valoremDEC_AdVal - Costs: fixed LOE
DEC_LOE(/STB), gatheringDEC_Gath() - Discounting: the discount rate
DEC_Disc
How to use it: The defaults are an illustrative well, not a forecast. Fit the well's own decline to its history (the Arps or modified hyperbolic forecast sheets), then type its parameters, its months on production and today's date, and its own deck and costs. For a forecast that is not an Arps curve, type its mid-month rates over the Oil rate column and keep the columns to its right. The chart draws the forecast rate on a log scale against the years from today, with the economic limit and the cessation of production on it. The sheet checks that the forecast reaches the limit inside the horizon, flagging a well still above the limit at the horizon and a well that already makes less than its limit, and it reconciles the interpolated cessation date with the closed-form Arps time to the limit, to within a day.
Method: The rate follows the type curve, Arps hyperbolic with Di = ((1 − Dei)^(−b) − 1)/b switching to an exponential tail of Dt = −ln(1 − Dterm) at ts = (Di/Dt − 1)/(b·Di). It is read at mid-month of the well's age, t = (2·(age + m) − 1)/24 years in forecast month m, and dated Start + (m − ½)·30.4375. The economic-limit function takes one price, royalty, tax and variable cost, so the deck is folded into them. The value per barrel of oil, with its gas, is V = (Oil − OilDiff) + GOR/1000·(Gas − GasDiff), and the royalty is 1 − NRI/WI. The blended tax is 1 − ((Oil − OilDiff)·(1 − SevOil − AdVal) + GOR/1000·(Gas − GasDiff)·(1 − SevGas − AdVal))/V, and the variable cost is LOEVar + GOR/1000·Gath. The netback is V·(1 − royalty)·(1 − tax) − variable cost, which is the economics family's margin per barrel over WI. The limit is LOE/netback barrels a month (the WI cancels). The cessation date is the first month whose oil is at or below the limit, interpolated log-linearly from the month before; that is exact on the exponential tail. The well produces in the months above the limit and is plugged the month after. Each producing month earns WI·(netback·oil − LOE), escalated by (1 + Esc)^((m − 1)/12), and the PV discounts end-of-month flows by (1 + Disc)^(m/12). The closed-form time to the limit is ((Qi/qEL)^b − 1)/(b·Di) on the hyperbolic and ts + ln(Qi·Qs/qEL)/Dt on the tail.
Example: The default well is the economics family's well (the well-program workbook's base case for one well, as on the One-Well NPV and IRR sheet) after two years on production, with the forecast starting on 1 January 2026 and running at most 40 years. The well has 800 STB/d initial on an Arps hyperbolic with b = 1 and a 65 %/yr effective secant decline switching to an 8 %/yr exponential tail, and 1,500 scf/STB. The deck is $70/STB oil less $1.50 and $3.00/MMBtu gas less $1.00, flat, with 100 % WI and 75 % NRI. The well pays Texas severance of 4.6 % on oil and 7.5 % on gas and 2.5 % ad valorem, $8,000 a month of fixed LOE, $4/STB of variable LOE, $0.50/Mscf of gathering and $150,000 to plug. Cash is discounted at 10 %. The D&C is sunk, so it is not in the cash flow.
After 24 months the well makes 800/(1 + 1.857 × 49/24) = 167.0 STB/d. The value per barrel is 68.50 + 1.5 × 2.00 = $71.50, the royalty 25 %, the blended tax 1 − (68.50 × 0.929 + 3.00 × 0.900)/71.50 = 7.22 % and the variable cost 4 + 1.5 × 0.50 = $4.75/STB. The netback is 71.50 × 0.75 × 0.9278 − 4.75 = $45.00/STB, the margin of the One-Well NPV and IRR sheet. So the limit is 8,000/45.00 = 177.8 STB a month, or 5.84 STB/d. The tail reaches it at 11.45 + ln(35.92/5.840)/0.08338 = 33.24 years from first production, 31.24 years from today. The interpolated cessation falls on 29 March 2057 (serial 57433.13), the same 31.24 years: the dates agree to the day. The well has 375 producing months left and 376.1 MSTB of remaining reserves, worth $8.40MM at 10 % ($13.77MM undiscounted), plugging included.
At $40 oil the netback falls to $24.10/STB and the limit rises to 332.0 STB a month. The life left falls to 23.75 years, the reserves to 353.9 MSTB and the PV to $4.06MM. A 10-year horizon stops the forecast while the well is still above the limit, so there is no cessation date. Thirty-five years on (age 420) the well makes 5.03 STB/d, already below its limit; plugging it is worth −$0.149MM.
Functions used
None: the blueprint calculates with Excel's own functions.
Names (61)
| Name | Refers to | Comment |
|---|---|---|
PO.RES.Reserves.EconLimitLAMBDA |
=LAMBDA(Price, Royalty, Tax, Opex, Fixed, LET(netback, Price*(1-Royalty)*(1-Tax)-Opex, IF(netback>0, Fixed/netback, NA()))) |
Economic-limit rate: fixed cost per period over the netback per unit after royalty, production tax and variable opex; #N/A if the netback is not positive |
PO.ECON.COP.DateLAMBDA |
=LAMBDA(Dates, Rate, Limit, LET(i, SEQUENCE(ROWS(Rate)), hit, IFERROR(MATCH(1, (Rate<=Limit)*1, 0), 0), qb, SUM((i=hit)*Rate), qa, SUM((i=hit-1)*Rate), tb, SUM((i=hit)*Dates), ta, SUM((i=hit-1)*Dates), IF(hit=0, "none", IF(hit=1, tb, IF(qb>0, ta+(tb-ta)*LN(qa/Limit)/LN(qa/qb), ta+(tb-ta)*(qa-Limit)/(qa-qb)))))) |
Cessation-of-production date: where a rate forecast first falls to the economic limit, interpolated log-linearly between dates; "none" if it never does |
PO.ECON.NPV.MonthlyLAMBDA |
=LAMBDA(cash,annual_rate,NPV((1+annual_rate)^(1/12)-1,cash)) |
NPV of end-of-month cash flows at an annual discount rate, in the units of cash. |
DEC_Age |
$B$4 |
Months the well has produced before the forecast starts, months |
DEC_Start |
$B$5 |
Date the forecast starts, date |
DEC_Horizon |
$B$6 |
Months the forecast runs, at most 1,200, months |
DEC_IP |
$B$7 |
Initial oil rate of the type curve, STB/d |
DEC_b |
$B$8 |
Arps hyperbolic exponent b |
DEC_Dei |
$B$9 |
Initial decline, effective secant, %/yr |
DEC_Dterm |
$B$10 |
Terminal decline, effective (exponential tail), %/yr |
DEC_GOR |
$B$11 |
Gas-oil ratio, constant over life, scf/STB |
DEC_TC |
$B$12 |
Type-curve factor (scales the initial rate) |
DEC_Oil |
$B$14 |
Oil price (WTI), $/STB |
DEC_OilDiff |
$B$15 |
Oil differential, deducted (quality and transport), $/STB |
DEC_Gas |
$B$16 |
Gas price (Henry Hub, 1 MMBtu per Mscf), $/MMBtu |
DEC_GasDiff |
$B$17 |
Gas differential, deducted (Waha basis), $/MMBtu |
DEC_Esc |
$B$18 |
Escalation of prices and operating costs, %/yr |
DEC_WI |
$B$19 |
Working interest (scales costs and capital), % |
DEC_NRI |
$B$20 |
Net revenue interest (25 % royalty at 100 % WI), % |
DEC_SevOil |
$B$21 |
Oil severance tax (Texas, of the oil's value), % |
DEC_SevGas |
$B$22 |
Gas severance tax (Texas, of the gas's value), % |
DEC_AdVal |
$B$23 |
Ad valorem tax, as a share of net revenue, % |
DEC_LOE |
$B$25 |
Fixed LOE, $/well-month |
DEC_LOEVar |
$B$26 |
Variable LOE per barrel of oil, $/STB |
DEC_Gath |
$B$27 |
Gas gathering and processing, $/Mscf |
DEC_PA |
$B$28 |
Plugging and abandonment, the month after the last production, $ |
DEC_Disc |
$B$30 |
Discount rate, end-of-month cash flows, %/yr |
DEC_Inputs |
$B$4:$B$30 |
The well's age, the forecast's start and horizon, the type curve, prices, interests and taxes, operating and plugging costs, and the discount rate |
DEC_Days |
$B$33 |
Days in a month, 365.25/12, days/month |
DEC_MoYr |
$B$34 |
Months in a year, months/yr |
DEC_DaysYr |
$B$35 |
Days in a year, days/yr |
DEC_PerMM |
$B$36 |
Dollars in a million, $/$MM |
DEC_Di |
$B$39 |
Initial nominal decline, from the effective secant, 1/yr |
DEC_Dt |
$B$40 |
Terminal nominal decline, from the effective, 1/yr |
DEC_Ts |
$B$41 |
Time the hyperbolic switches to the terminal decline, years |
DEC_Qs |
$B$42 |
Rate at the switch over the initial rate |
DEC_Qi |
$B$43 |
Initial oil rate, IP × type-curve factor, STB/d |
DEC_RateNow |
$B$44 |
Oil rate in the forecast's first month, STB/d |
DEC_Value |
$B$47 |
Wellhead value per barrel of oil, with its gas, $/STB |
DEC_Roy |
$B$48 |
Royalty, 1 − NRI/WI, % |
DEC_Tax |
$B$49 |
Severance and ad valorem, blended over oil and gas, % |
DEC_Opex |
$B$50 |
Variable cost per barrel, LOE and the gas's gathering, $/STB |
DEC_Netback |
$B$51 |
Netback per barrel, value less royalty, taxes and variable cost, $/STB |
DEC_ELimit |
$B$52 |
Economic limit, oil a month, STB |
DEC_COP |
$B$53 |
Cessation-of-production date, date |
DEC_QLimit |
$B$54 |
Economic-limit oil rate, STB/d |
DEC_TLimit |
$B$55 |
Time from first production to the limit, Arps, years |
DEC_Remain |
$B$56 |
Life left to the limit, Arps, years |
DEC_Life |
$B$57 |
Life left to the COP date, or to the horizon, years |
DEC_Months |
$B$58 |
Producing months left, the forecast above the limit, months |
DEC_Reserves |
$B$60 |
Remaining reserves, oil to the economic limit, MSTB |
DEC_PV |
$B$61 |
PV of the net cash, plugging included, $MM |
DEC_NetCash |
$B$62 |
Net cash, undiscounted, $MM |
DEC_LimitCheck |
$B$64 |
Economic limit check verdict |
DEC_LimitCheckNote |
$C$64 |
Economic limit check comment |
DEC_CopCheck |
$B$65 |
COP date against Arps verdict |
DEC_CopCheckNote |
$C$65 |
COP date against Arps comment |
DEC_Results |
$B$39:$B$65 |
The decline terms and today's rate, the economic limit from the deck and the COP date, the Arps time to the limit, the life left, the remaining reserves, their PV and two checks |
DEC_Rates |
$A$72:$C$92 |
Years from today, the forecast oil rate and the economic-limit rate |
DEC_Cessation |
$A$96:$C$96 |
The life left to the COP date, and the economic-limit rate there |
DEC_ForecastCurve |
$A$72:$C$92 |
The Forecast to the Economic Limit |
Details
| Inserts | 101 rows × 8 columns |
| Category | Petroleum Economics |
| For agents and tools | Descriptor (.md) |