Workover Decision
Description
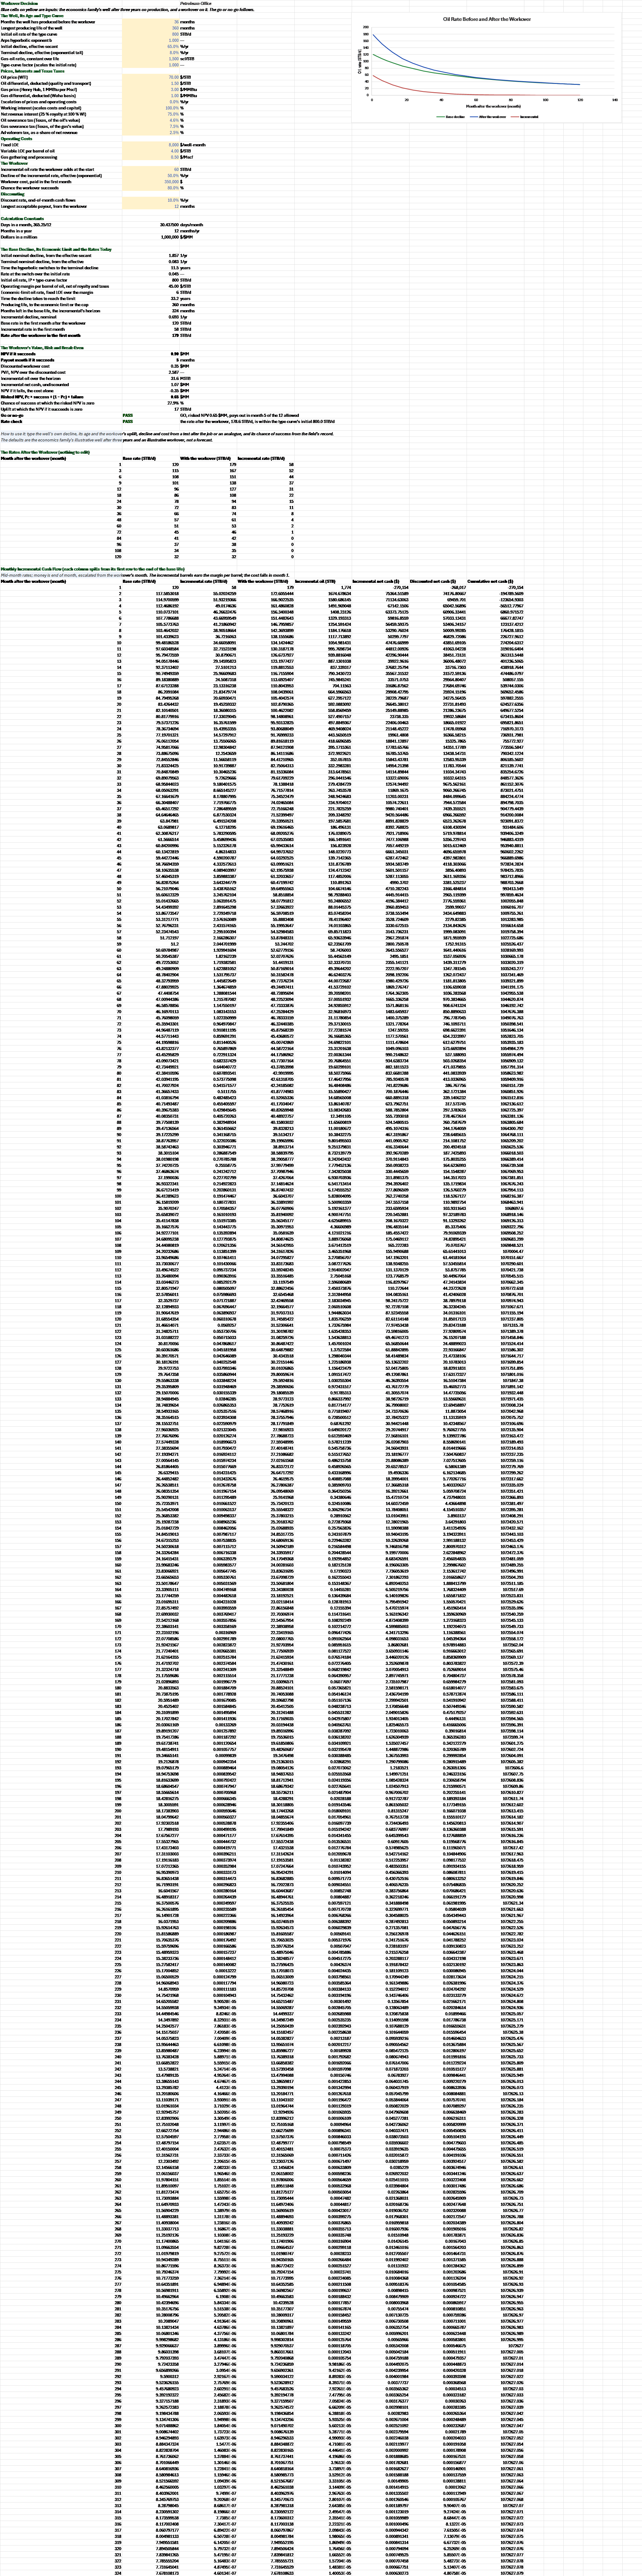
Is a workover worth doing on a producing well? You enter the well's base decline, prices and costs, and the workover's uplift, its decline, its cost and its chance of success. You read off the incremental rate over the base decline, the incremental NPV and payout month, the NPV risked by the chance of success, and the chance of success and uplift at which the workover breaks even.
Parameters:
- The well: the months it has produced before the workover
WO_Age, the life capWO_LifeCap(months from first production), the type curve's initial rateWO_IP(STB/d), Arps exponentWO_b, effective secant initial declineWO_Deiand effective terminal declineWO_Dterm, the gas-oil ratioWO_GOR(scf/STB) and the type-curve factorWO_TC - Prices, interests and taxes: oil
WO_Oil(/MMBtu) lessWO_GasDiff, the escalationWO_Esc, working interestWO_WI, net revenue interestWO_NRI, severanceWO_SevOilandWO_SevGas, and ad valoremWO_AdVal - Operating costs: fixed LOE
WO_LOE(/STB) and gatheringWO_Gath($/Mscf); they set the margin per barrel and the base economic limit - The workover: the incremental rate it adds at the start
WO_Uplift(STB/d), its effective exponential declineWO_UpDecl, its costWO_Cost($, paid in the first month) and its chance of successWO_Pc - Discounting and limits: the discount rate
WO_Discand the longest acceptable payoutWO_PayoutMax(months)
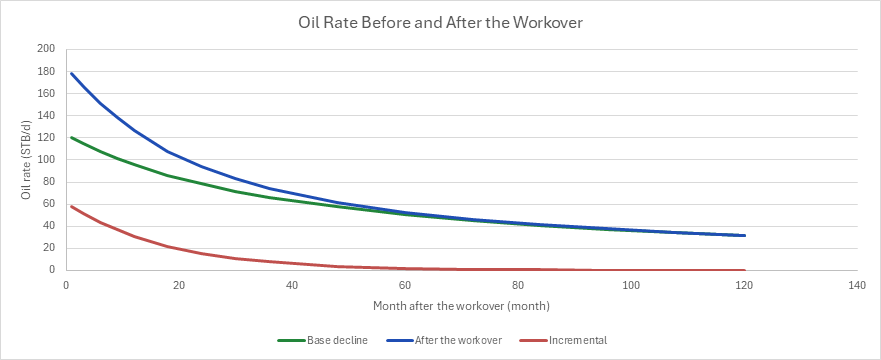
How to use it: The defaults are an illustrative well and workover, not a forecast. Type the well's own decline parameters and age, and the workover's uplift and decline from a post-job test or an analogue job in the same field; take the chance of success from the field's workover record. The chart draws the base decline, the rate after the workover and the incremental rate over the first ten years. The verdict is go when the risked NPV is positive and the workover pays out within the payout limit, a caution when it is positive but pays out later, and no-go when the risked NPV is not positive. The sheet also flags a rate after the workover above the type curve's initial rate.
Method: The base rate follows the type curve, Arps hyperbolic with Di = ((1 − Dei)^(−b) − 1)/b switching to an exponential tail of Dt = −ln(1 − Dterm) at ts = (Di/Dt − 1)/(b·Di), read at mid-month of the well's age, t = (2·age − 1)/24 years. The base life is the One-Well NPV and IRR sheet's: the months until the rate falls to the economic limit LOE·WI/(30.4375·u), or the cap, u the margin per barrel u = (Oil − OilDiff)·NRI·(1 − SevOil − AdVal) + GOR/1000·((Gas − GasDiff)·NRI·(1 − SevGas − AdVal) − Gath·WI) − LOEVar·WI. The incremental rate in month m after the workover is Δq = Uplift·exp(−Dw·(2m − 1)/24), Dw = −ln(1 − UpDecl), while the base well still produces. Each incremental barrel earns u, escalated by (1 + Esc)^((m − 1)/12); the fixed LOE is paid with or without the workover, so it is not incremental. The month-1 cash also pays the cost × WI. NPV discounts end-of-month flows by (1 + Disc)^(m/12); payout is the month the cumulative cash climbs back to zero. A failed workover is the cost alone, NPV(fail) = −Cost·WI/(1 + Disc)^(1/12). The risked NPV is Pc·NPV + (1 − Pc)·NPV(fail). Because the NPV is linear in the uplift, the chance of success that zeroes the risked NPV, Pc* = −NPV(fail)/(NPV − NPV(fail)), is also the fraction of the uplift that zeroes the unrisked NPV.
Example: The default well is the economics family's well (the well-program workbook's base case for one well, as on the One-Well NPV and IRR sheet) after three years on production: 800 STB/d initial on an Arps hyperbolic with b = 1 and a 65 %/yr effective secant decline switching to an 8 %/yr exponential tail, 1,500 scf/STB, a 360-month cap, $70/STB oil less $1.50 and $3.00/MMBtu gas less $1.00, flat, 100 % WI and 75 % NRI, Texas severance of 4.6 % on oil and 7.5 % on gas, 2.5 % ad valorem, $8,000 a month of fixed LOE, $4/STB of variable LOE and $0.50/Mscf of gathering. The workover (a re-stimulation or an artificial-lift change, say) adds 60 STB/d declining at 50 %/yr, costs $350,000 and succeeds four times in five. Cash is discounted at 10 % against a 12-month payout limit.
After 36 months the base rate in the first month after the workover is 800/(1 + 1.857 × 73/24) = 120.3 STB/d. The uplift there is 60·exp(−ln 2/24) = 58.3 STB/d, so the well makes 178.6 STB/d. The margin is $45.00/STB and the economic limit 5.84 STB/d, as on the One-Well NPV and IRR sheet; the base well runs to its 360-month cap, so the horizon is 324 months. The incremental oil is 31.61 MSTB, close to 60 × 365.25/ln 2 = 31.62 MSTB for an endless tail, and the undiscounted net cash is 31,612 × 45.00 − 350,000 = $1.07MM. The NPV if it succeeds is $0.90MM, paying out in month 5. The discounted cost is $0.347MM, so PV/I is 2.59. Risked at 80 %, the NPV is 0.8 × 0.898 − 0.2 × 0.347 = $0.65MM: go. It breaks even at a 27.9 % chance of success, or at 60 × 0.279 = 16.7 STB/d of uplift.
A $1.5MM workover loses $0.24MM even if it works, never pays out, and is a no-go. A 20 STB/d uplift earns $0.07MM if it works and pays out in month 24, but risked at 80 % it loses $0.015MM. That is a no-go too, since 20 STB/d is only just above the 16.7 STB/d break-even. At $40 oil the margin falls to $24.10/STB, the base life to 308 months and the NPV to $0.32MM, still a go. Ten years on (age 120), the base rate is 40.7 STB/d but the incremental barrels and their value are the same.
Functions used
None: the blueprint calculates with Excel's own functions.
Names (64)
| Name | Refers to | Comment |
|---|---|---|
PO.ECON.NPV.MonthlyLAMBDA |
=LAMBDA(cash,annual_rate,NPV((1+annual_rate)^(1/12)-1,cash)) |
NPV of end-of-month cash flows at an annual discount rate, in the units of cash. |
PO.ECON.PayoutLAMBDA |
=LAMBDA(cash,LET(cumulative,SCAN(0,cash,LAMBDA(running,flow,running+flow)),trough,MATCH(MIN(cumulative),cumulative,0),IFERROR(MATCH(1,(SEQUENCE(ROWS(cumulative))>trough)*(cumulative>=0),0),"none"))) |
Month in which cumulative cash flow climbs back to zero after its low point; "none" if it never does |
WO_Age |
$B$4 |
Months the well has produced before the workover, months |
WO_LifeCap |
$B$5 |
Longest producing life of the well, months |
WO_IP |
$B$6 |
Initial oil rate of the type curve, STB/d |
WO_b |
$B$7 |
Arps hyperbolic exponent b |
WO_Dei |
$B$8 |
Initial decline, effective secant, %/yr |
WO_Dterm |
$B$9 |
Terminal decline, effective (exponential tail), %/yr |
WO_GOR |
$B$10 |
Gas-oil ratio, constant over life, scf/STB |
WO_TC |
$B$11 |
Type-curve factor (scales the initial rate) |
WO_Oil |
$B$13 |
Oil price (WTI), $/STB |
WO_OilDiff |
$B$14 |
Oil differential, deducted (quality and transport), $/STB |
WO_Gas |
$B$15 |
Gas price (Henry Hub, 1 MMBtu per Mscf), $/MMBtu |
WO_GasDiff |
$B$16 |
Gas differential, deducted (Waha basis), $/MMBtu |
WO_Esc |
$B$17 |
Escalation of prices and operating costs, %/yr |
WO_WI |
$B$18 |
Working interest (scales costs and capital), % |
WO_NRI |
$B$19 |
Net revenue interest (25 % royalty at 100 % WI), % |
WO_SevOil |
$B$20 |
Oil severance tax (Texas, of the oil's value), % |
WO_SevGas |
$B$21 |
Gas severance tax (Texas, of the gas's value), % |
WO_AdVal |
$B$22 |
Ad valorem tax, as a share of net revenue, % |
WO_LOE |
$B$24 |
Fixed LOE, $/well-month |
WO_LOEVar |
$B$25 |
Variable LOE per barrel of oil, $/STB |
WO_Gath |
$B$26 |
Gas gathering and processing, $/Mscf |
WO_Uplift |
$B$28 |
Incremental oil rate the workover adds at the start, STB/d |
WO_UpDecl |
$B$29 |
Decline of the incremental rate, effective (exponential), %/yr |
WO_Cost |
$B$30 |
Workover cost, paid in the first month, $ |
WO_Pc |
$B$31 |
Chance the workover succeeds, % |
WO_Disc |
$B$33 |
Discount rate, end-of-month cash flows, %/yr |
WO_PayoutMax |
$B$34 |
Longest acceptable payout, from the workover, months |
WO_Inputs |
$B$4:$B$34 |
The well's age and type curve, prices, interests and taxes, operating costs, the workover's uplift, decline, cost and chance of success, the discount rate and the payout limit |
WO_Days |
$B$37 |
Days in a month, 365.25/12, days/month |
WO_MoYr |
$B$38 |
Months in a year, months/yr |
WO_PerMM |
$B$39 |
Dollars in a million, $/$MM |
WO_Di |
$B$42 |
Initial nominal decline, from the effective secant, 1/yr |
WO_Dt |
$B$43 |
Terminal nominal decline, from the effective, 1/yr |
WO_Ts |
$B$44 |
Time the hyperbolic switches to the terminal decline, years |
WO_Qs |
$B$45 |
Rate at the switch over the initial rate |
WO_Qi |
$B$46 |
Initial oil rate, IP × type-curve factor, STB/d |
WO_Margin |
$B$47 |
Operating margin per barrel of oil, net of royalty and taxes, $/STB |
WO_QLimit |
$B$48 |
Economic-limit oil rate, fixed LOE over the margin, STB/d |
WO_TLimit |
$B$49 |
Time the decline takes to reach the limit, years |
WO_Life |
$B$50 |
Producing life, to the economic limit or the cap, months |
WO_N |
$B$51 |
Months left in the base life, the incremental's horizon, months |
WO_Dw |
$B$52 |
Incremental decline, nominal, 1/yr |
WO_BaseNow |
$B$53 |
Base rate in the first month after the workover, STB/d |
WO_IncNow |
$B$54 |
Incremental rate in the first month, STB/d |
WO_AfterNow |
$B$55 |
Rate after the workover in the first month, STB/d |
WO_NPV |
$B$58 |
NPV if it succeeds, $MM |
WO_Payout |
$B$59 |
Payout month if it succeeds, months |
WO_PvCost |
$B$60 |
Discounted workover cost, $MM |
WO_PVI |
$B$61 |
PV/I, NPV over the discounted cost |
WO_IncEUR |
$B$62 |
Incremental oil over the horizon, MSTB |
WO_NetCash |
$B$63 |
Incremental net cash, undiscounted, $MM |
WO_NpvFail |
$B$64 |
NPV if it fails, the cost alone, $MM |
WO_ENPV |
$B$65 |
Risked NPV, Pc × success + (1 − Pc) × failure, $MM |
WO_PcMin |
$B$66 |
Chance of success at which the risked NPV is zero, % |
WO_UpliftMin |
$B$67 |
Uplift at which the NPV if it succeeds is zero, STB/d |
WO_GoCheck |
$B$68 |
Go or no-go verdict |
WO_GoCheckNote |
$C$68 |
Go or no-go comment |
WO_RateCheck |
$B$69 |
Rate check verdict |
WO_RateCheckNote |
$C$69 |
Rate check comment |
WO_Results |
$B$42:$B$69 |
The decline terms, the base economic limit and life, the rates today, the workover's NPV, payout, PV/I, incremental oil, the risked NPV and the break-evens, and two checks |
WO_Rates |
$A$76:$D$91 |
Months after the workover, and the base, post-workover and incremental oil rates at each |
WO_RateCurve |
$A$76:$D$91 |
Oil Rate Before and After the Workover |
Details
| Inserts | 96 rows × 8 columns |
| Category | Petroleum Economics |
| For agents and tools | Descriptor (.md) |