One-Well NPV Tornado
Description
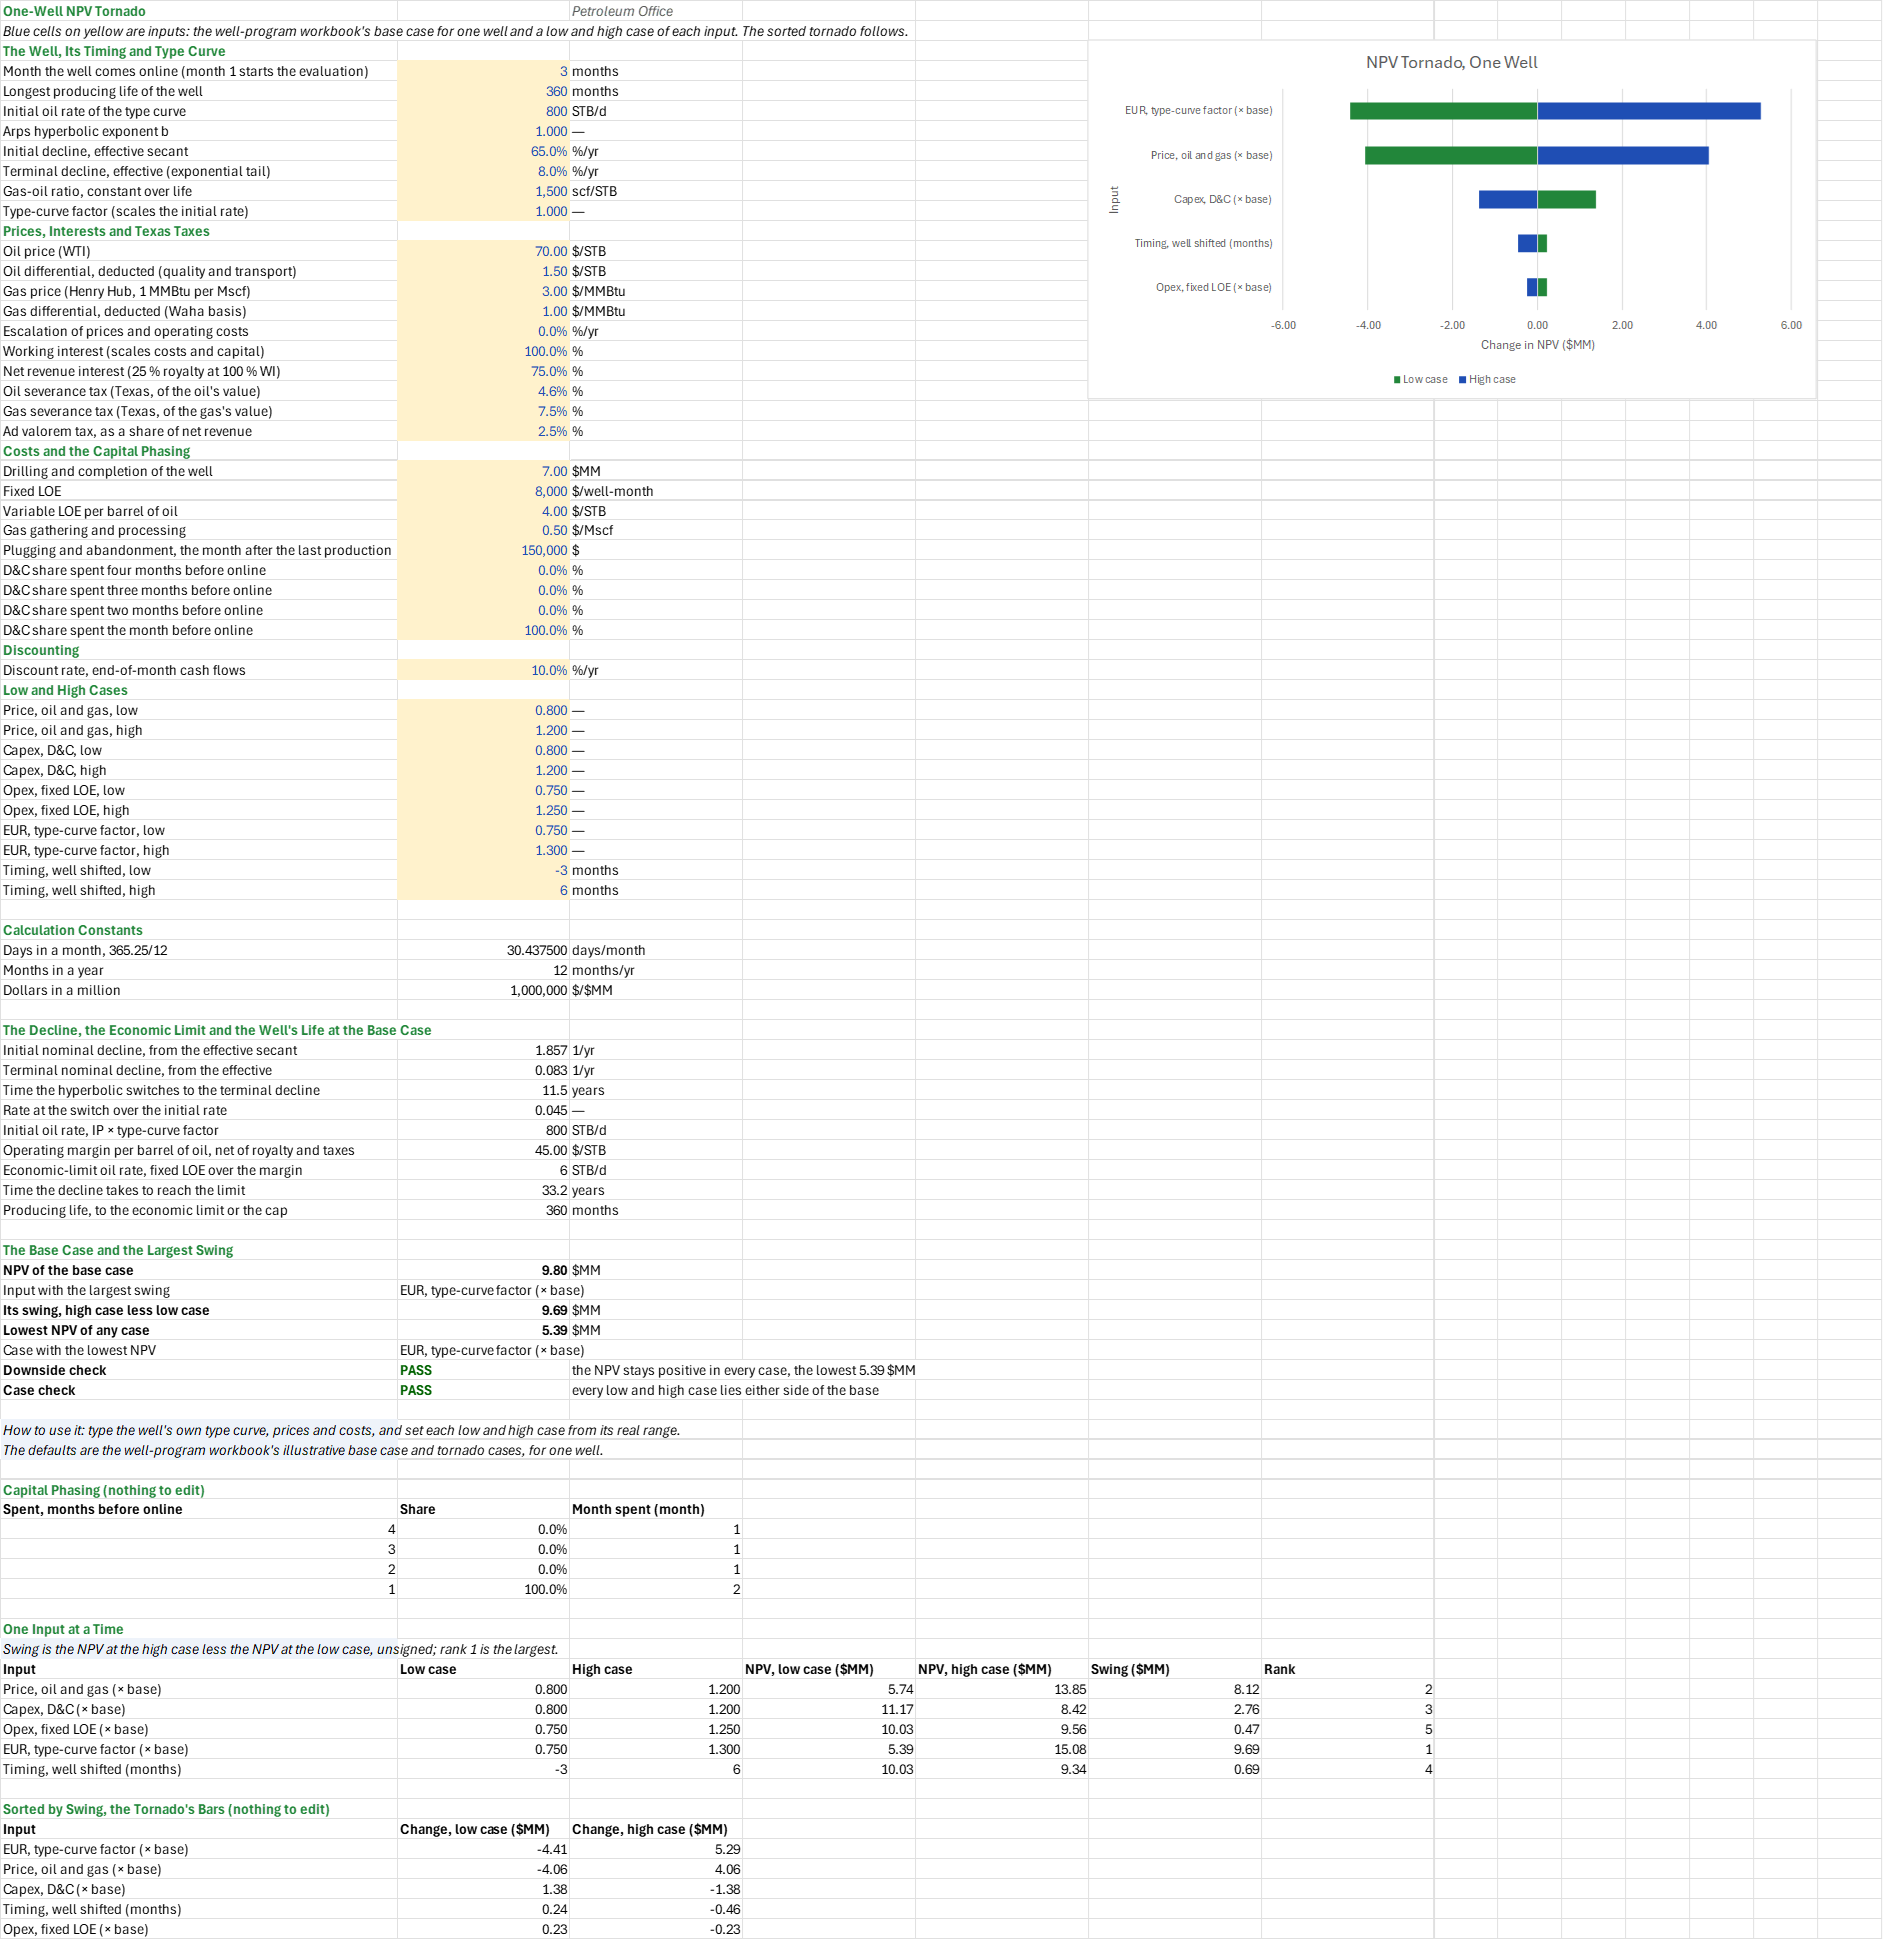
Which input moves a well's value most, and does any plausible case lose money? You enter the well and a low and a high case for the price, the D&C, the fixed LOE, the EUR (through the type-curve factor) and the timing. The sheet moves one input at a time, the rest at the base case, and you read off the NPV at each case, the swings ranked largest first, and the cases that take the NPV to zero or below.
Parameters:
- The well: the month it comes online
TOR_Online, the life capTOR_LifeCap(months), the type curve's initial rateTOR_IP(STB/d), Arps exponentTOR_b, effective secant initial declineTOR_Dei, effective terminal declineTOR_Dterm, the gas-oil ratioTOR_GOR(scf/STB) and the type-curve factorTOR_TC - Prices: oil
TOR_Oil(/MMBtu) lessTOR_GasDiff, and escalationTOR_Esc - Interests and taxes:
TOR_WI,TOR_NRI, severanceTOR_SevOilandTOR_SevGas, and ad valoremTOR_AdVal - Costs: the D&C
TOR_DC(/well-month), variable LOETOR_LOEVar(/Mscf), pluggingTOR_PA($), and the D&C phasingTOR_Phase4toTOR_Phase1 - Discounting:
TOR_Disc - Low and high cases: price
TOR_PriceLoandTOR_PriceHi, capexTOR_CapexLoandTOR_CapexHi, and opexTOR_OpexLoandTOR_OpexHi, each a multiple of the base; the type-curve factorTOR_EurLoandTOR_EurHi, a multiple ofTOR_TC; and the shiftTOR_DelayLoandTOR_DelayHiin months, negative earlier
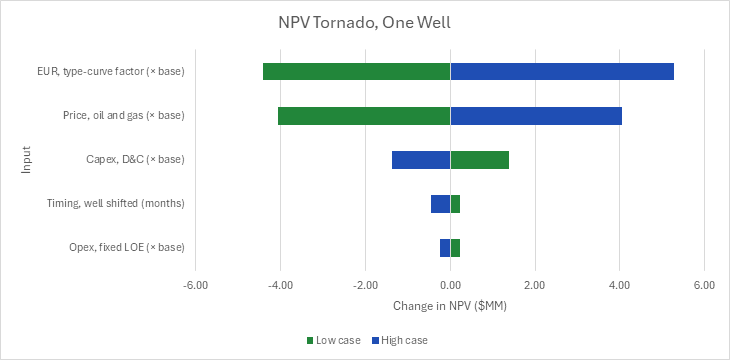
How to use it: The well and its cases are the well-program workbook's illustrative ones; the sheet is that workbook's Tornado sheet reduced to one well. Type the well's own type curve, prices and costs over the inputs, and set each low and high case from the input's real range: the price deck's low and high, the AFE's contingency, the LOE history's spread, the type curve's P90 and P10, and the schedule's slip. The chart is a tornado of the NPV's change at each case, the largest swing at the top, and it stays sorted as the inputs change. The sheet flags a base case that loses money, names any low or high case that takes the NPV to zero or below, and flags an input whose low and high cases lie on the same side of the base, which makes its bars overlap.
Method: Each case's NPV is the full monthly model of the One-Well NPV and IRR sheet, written as one cell with that input moved, with the capital phased over the months before online: the type curve sampled at mid-month to the economic limit, so a lower price, a higher LOE or a weaker type curve also shortens the life; the margin per barrel after royalty, severance, ad valorem and variable costs; the fixed LOE, the phased D&C and the plugging; end-of-month discounting. Price moves oil and gas by the same factor, and capex the D&C only. Timing moves every cash flow by m months, which multiplies the NPV by (1 + Disc)^(−m/12), so it is exact without repricing. An input's swing is |NPV(high) − NPV(low)|; its rank counts the swings above it, a tie going to the row above, and the sorted table looks each rank up with INDEX and MATCH, so the chart's bars are the NPV's change from the base at each case, largest swing first.
Example: The default well is the One-Well NPV and IRR sheet's: the economics workbook's base case for one Texas horizontal, 800 STB/d on an Arps hyperbolic with b = 1 and a 65 %/yr secant decline to an 8 %/yr tail, $70/STB oil and $3.00/MMBtu gas, a 100 % WI and 75 % NRI, Texas severance and ad valorem, a $7MM well online in month 3, $8,000 a month of fixed LOE and 10 % discounting. The cases are the workbook's: price and D&C at 0.8 and 1.2 of the base, fixed LOE at 0.75 and 1.25, the type-curve factor at 0.75 (P90) and 1.3 (P10), and the well three months early or six late.
The base NPV is $9.80MM, the One-Well NPV and IRR sheet's. The EUR swings it most: $5.39MM at the P90 type curve and $15.08MM at the P10, a $9.69MM swing. Price follows: $5.74MM at 0.8 and $13.85MM at 1.2, $8.12MM. Capex: $11.17MM at 0.8 and $8.42MM at 1.2, $2.76MM, which is ±20 % of the $6.89MM discounted capital, as the D&C enters the cash flow linearly. Timing: 9.795 × 1.1^(3/12) = $10.03MM three months early and 9.795 × 1.1^(−6/12) = $9.34MM six months late, $0.69MM. Opex: $10.03MM and $9.56MM, $0.47MM. These are the workbook's eight-well tornado over its 7.782 discount-weighted wells (its $41.94MM P90 case is 7.782 × $5.39MM), in the same order. The lowest case, the P90 type curve, keeps the NPV at $5.39MM, so no plausible case loses money. At $30 oil the base case loses $1.11MM. A low type-curve factor of 0.4 takes the NPV to −$0.77MM, and the EUR is named as the losing case; a low price of 0.5 ($35 oil and $1.50 gas) gives −$0.35MM, a $14.20MM swing, and price takes the top.
Functions used
None: the blueprint calculates with Excel's own functions.
Names (84)
| Name | Refers to | Comment |
|---|---|---|
PO.ECON.NPV.MonthlyLAMBDA |
=LAMBDA(cash,annual_rate,NPV((1+annual_rate)^(1/12)-1,cash)) |
NPV of end-of-month cash flows at an annual discount rate, in the units of cash. |
PO.ECON.Capex.PhasingLAMBDA |
=LAMBDA(total,profile,total*profile/SUM(profile)) |
Spreads a capital total over periods in proportion to a phasing profile; returns an array the shape of the profile, in the units of total. |
TOR_Online |
$B$4 |
Month the well comes online (month 1 starts the evaluation), months |
TOR_LifeCap |
$B$5 |
Longest producing life of the well, months |
TOR_IP |
$B$6 |
Initial oil rate of the type curve, STB/d |
TOR_b |
$B$7 |
Arps hyperbolic exponent b |
TOR_Dei |
$B$8 |
Initial decline, effective secant, %/yr |
TOR_Dterm |
$B$9 |
Terminal decline, effective (exponential tail), %/yr |
TOR_GOR |
$B$10 |
Gas-oil ratio, constant over life, scf/STB |
TOR_TC |
$B$11 |
Type-curve factor (scales the initial rate) |
TOR_Oil |
$B$13 |
Oil price (WTI), $/STB |
TOR_OilDiff |
$B$14 |
Oil differential, deducted (quality and transport), $/STB |
TOR_Gas |
$B$15 |
Gas price (Henry Hub, 1 MMBtu per Mscf), $/MMBtu |
TOR_GasDiff |
$B$16 |
Gas differential, deducted (Waha basis), $/MMBtu |
TOR_Esc |
$B$17 |
Escalation of prices and operating costs, %/yr |
TOR_WI |
$B$18 |
Working interest (scales costs and capital), % |
TOR_NRI |
$B$19 |
Net revenue interest (25 % royalty at 100 % WI), % |
TOR_SevOil |
$B$20 |
Oil severance tax (Texas, of the oil's value), % |
TOR_SevGas |
$B$21 |
Gas severance tax (Texas, of the gas's value), % |
TOR_AdVal |
$B$22 |
Ad valorem tax, as a share of net revenue, % |
TOR_DC |
$B$24 |
Drilling and completion of the well, $MM |
TOR_LOE |
$B$25 |
Fixed LOE, $/well-month |
TOR_LOEVar |
$B$26 |
Variable LOE per barrel of oil, $/STB |
TOR_Gath |
$B$27 |
Gas gathering and processing, $/Mscf |
TOR_PA |
$B$28 |
Plugging and abandonment, the month after the last production, $ |
TOR_Phase4 |
$B$29 |
D&C share spent four months before online, % |
TOR_Phase3 |
$B$30 |
D&C share spent three months before online, % |
TOR_Phase2 |
$B$31 |
D&C share spent two months before online, % |
TOR_Phase1 |
$B$32 |
D&C share spent the month before online, % |
TOR_Disc |
$B$34 |
Discount rate, end-of-month cash flows, %/yr |
TOR_PriceLo |
$B$36 |
Price, oil and gas, low |
TOR_PriceHi |
$B$37 |
Price, oil and gas, high |
TOR_CapexLo |
$B$38 |
Capex, D&C, low |
TOR_CapexHi |
$B$39 |
Capex, D&C, high |
TOR_OpexLo |
$B$40 |
Opex, fixed LOE, low |
TOR_OpexHi |
$B$41 |
Opex, fixed LOE, high |
TOR_EurLo |
$B$42 |
EUR, type-curve factor, low |
TOR_EurHi |
$B$43 |
EUR, type-curve factor, high |
TOR_DelayLo |
$B$44 |
Timing, well shifted, low, months |
TOR_DelayHi |
$B$45 |
Timing, well shifted, high, months |
TOR_Phasing |
$B$29:$B$32 |
The D&C phasing shares, four months before the well comes online down to the month before |
TOR_Inputs |
$B$4:$B$45 |
The well's timing and type curve, prices, interests and taxes, costs and capital phasing, the discount rate, and each tornado input's low and high case |
TOR_Days |
$B$48 |
Days in a month, 365.25/12, days/month |
TOR_MoYr |
$B$49 |
Months in a year, months/yr |
TOR_PerMM |
$B$50 |
Dollars in a million, $/$MM |
TOR_Di |
$B$53 |
Initial nominal decline, from the effective secant, 1/yr |
TOR_Dt |
$B$54 |
Terminal nominal decline, from the effective, 1/yr |
TOR_Ts |
$B$55 |
Time the hyperbolic switches to the terminal decline, years |
TOR_Qs |
$B$56 |
Rate at the switch over the initial rate |
TOR_Qi |
$B$57 |
Initial oil rate, IP × type-curve factor, STB/d |
TOR_Margin |
$B$58 |
Operating margin per barrel of oil, net of royalty and taxes, $/STB |
TOR_QLimit |
$B$59 |
Economic-limit oil rate, fixed LOE over the margin, STB/d |
TOR_TLimit |
$B$60 |
Time the decline takes to reach the limit, years |
TOR_Life |
$B$61 |
Producing life, to the economic limit or the cap, months |
TOR_NPV |
$B$64 |
NPV of the base case, $MM |
TOR_Top |
$B$65 |
Input with the largest swing |
TOR_TopSwing |
$B$66 |
Its swing, high case less low case, $MM |
TOR_Low |
$B$67 |
Lowest NPV of any case, $MM |
TOR_LowCase |
$B$68 |
Case with the lowest NPV |
TOR_DownsideCheck |
$B$69 |
Downside check verdict |
TOR_DownsideCheckNote |
$C$69 |
Downside check comment |
TOR_CaseCheck |
$B$70 |
Case check verdict |
TOR_CaseCheckNote |
$C$70 |
Case check comment |
TOR_Results |
$B$53:$B$70 |
The decline terms, the economic limit and life, the base NPV, the input with the largest swing and its swing, the lowest NPV and its case, and two checks |
TOR_CapitalPhasing |
$A$77:$C$80 |
Each D&C share's lead, its share and the month it is spent (before month 1 it falls in month 1) |
TOR_Spend |
$C$77:$C$80 |
The month each D&C share is spent, four months before online down to the month before |
TOR_Cases |
$A$85:$G$89 |
Each input's low and high case, the NPV at each, the swing and its rank |
TOR_PriceNpvLo |
$D$85 |
NPV with Price, oil and gas at its low case, $MM |
TOR_PriceNpvHi |
$E$85 |
NPV with Price, oil and gas at its high case, $MM |
TOR_CapexNpvLo |
$D$86 |
NPV with Capex, D&C at its low case, $MM |
TOR_CapexNpvHi |
$E$86 |
NPV with Capex, D&C at its high case, $MM |
TOR_OpexNpvLo |
$D$87 |
NPV with Opex, fixed LOE at its low case, $MM |
TOR_OpexNpvHi |
$E$87 |
NPV with Opex, fixed LOE at its high case, $MM |
TOR_EurNpvLo |
$D$88 |
NPV with EUR, type-curve factor at its low case, $MM |
TOR_EurNpvHi |
$E$88 |
NPV with EUR, type-curve factor at its high case, $MM |
TOR_DelayNpvLo |
$D$89 |
NPV with Timing, well shifted at its low case, $MM |
TOR_DelayNpvHi |
$E$89 |
NPV with Timing, well shifted at its high case, $MM |
TOR_Names |
$A$85:$A$89 |
The tornado's inputs |
TOR_NpvLo |
$D$85:$D$89 |
NPV with each input at its low case, $MM |
TOR_NpvHi |
$E$85:$E$89 |
NPV with each input at its high case, $MM |
TOR_Swings |
$F$85:$F$89 |
Each input's swing, high less low, unsigned, $MM |
TOR_Ranks |
$G$85:$G$89 |
Each input's rank by swing, 1 the largest |
TOR_Bars |
$A$93:$C$97 |
The inputs sorted by swing, largest first, and the NPV's change at each case |
TOR_TornadoCurve |
$A$93:$C$97 |
NPV Tornado, One Well |
Details
| Inserts | 97 rows × 7 columns |
| Category | Petroleum Economics |
| For agents and tools | Descriptor (.md) |