One-Well NPV and IRR
Description
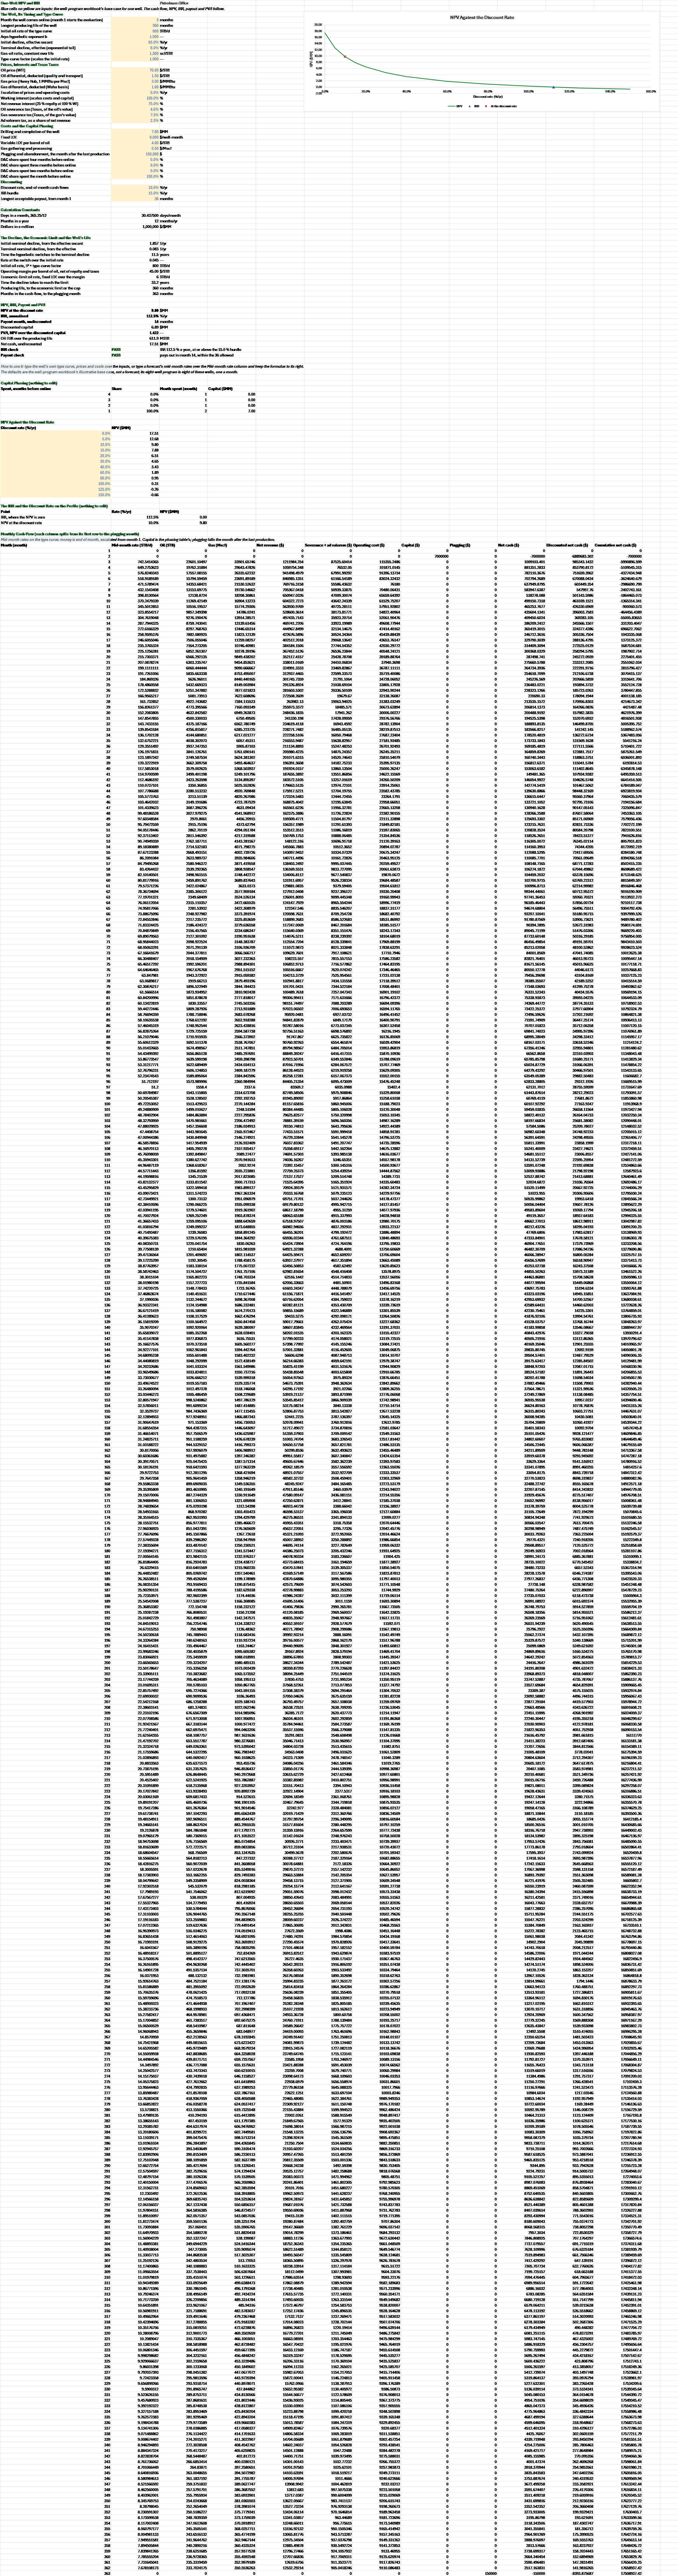
Does one well earn its cost of capital, and by how much? You enter the well's type curve, prices, interests, Texas taxes, operating costs and phased capital. The sheet builds its monthly cash flow, and you read off the NPV at the discount rate, the IRR, the payout month, PV/I (the NPV over the discounted capital) and the NPV profile against the discount rate.
Parameters:
- The well: the month it comes online
NI_Online(month 1 starts the evaluation), the life capNI_LifeCap(months), the type curve's initial rateNI_IP(STB/d), Arps exponentNI_b, effective secant initial declineNI_Deiand effective terminal declineNI_Dterm, the gas-oil ratioNI_GOR(scf/STB) and the type-curve factorNI_TC - Prices: oil
NI_Oil(/MMBtu, 1 MMBtu per Mscf) lessNI_GasDiff, and the escalation of prices and costsNI_Esc - Interests and taxes: working interest
NI_WI, net revenue interestNI_NRI, oil and gas severanceNI_SevOilandNI_SevGas, and ad valoremNI_AdVal - Costs: the D&C
NI_DC(/well-month), variable LOENI_LOEVar(/Mscf) and pluggingNI_PA($) - Capital phasing: the D&C shares spent four, three, two and one months before online,
NI_Phase4toNI_Phase1 - Discounting and limits: the discount rate
NI_Disc, the IRR hurdleNI_Hurdleand the longest acceptable payoutNI_PayoutMax(months)
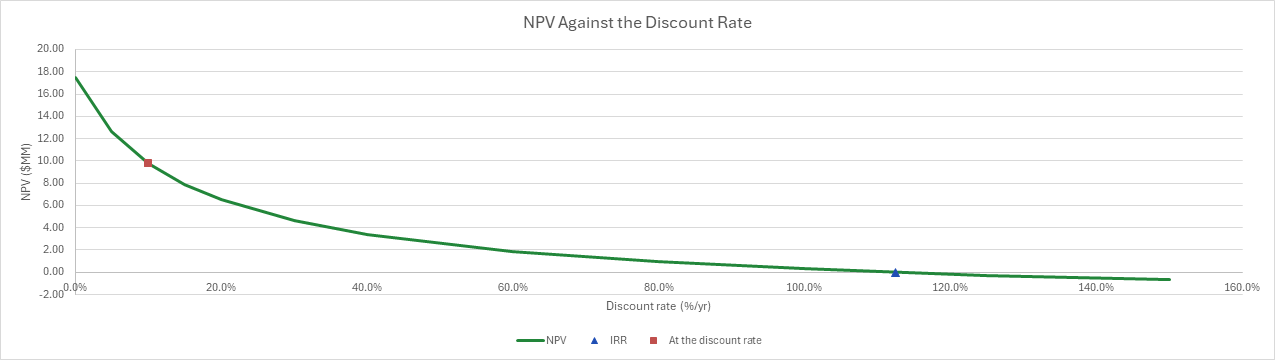
How to use it: The defaults are the well-program workbook's illustrative well, not a forecast; the sheet is that workbook's Cash Flow sheet reduced to one well. Type the well's own type curve, prices, interests and costs over the inputs; for a forecast that is not an Arps curve, type its mid-month oil rates over the Mid-month rate column, one a month to the plugging month, and keep the columns to its right. The chart draws the NPV against the discount rate, with the IRR marked where the curve crosses zero and the NPV at the sheet's rate marked on it. The sheet compares the IRR with the hurdle (and flags a well with no IRR) and the payout with the payout limit (and flags a well that never pays out).
Method: The type curve is Arps hyperbolic with nominal initial decline Di = ((1 − Dei)^(−b) − 1)/b per year, switching to an exponential tail of nominal decline Dt = −ln(1 − Dterm) when its decline falls to Dt, at ts = (Di/Dt − 1)/(b·Di) years. Each month's oil is the rate at mid-month, t = (2·age − 1)/24 years, times 30.4375 days; gas is GOR × oil. The operating margin per barrel is u = (Oil − OilDiff)·NRI·(1 − SevOil − AdVal) + GOR/1000·((Gas − GasDiff)·NRI·(1 − SevGas − AdVal) − Gath·WI) − LOEVar·WI, and the well produces until its rate falls to the economic limit LOE·WI/(30.4375·u), in whole months, or the life cap; it is plugged the month after. Net revenue is (oil·(Oil − OilDiff) + gas·(Gas − GasDiff))·NRI; severance is charged on the oil and gas value and ad valorem on net revenue; operating cost is (LOE + LOEVar·oil + Gath·gas)·WI; all escalate by (1 + Esc)^((month − 1)/12). Each D&C share is spent its lead before the well comes online, in month 1 if that is earlier. NPV discounts end-of-month cash flows, the month-k flow by (1 + Disc)^(k/12); IRR is the first monthly rate, scanning up from −5 %, where the NPV falls through zero, annualised; payout is the month the cumulative cash climbs back to zero after its low point; PV/I is NPV over the discounted capital.
Example: The default well is the economics workbook's base case for one of its eight wells: a Texas horizontal online in month 3, 800 STB/d on an Arps hyperbolic with b = 1 and a 65 %/yr effective secant decline switching to an 8 %/yr exponential tail, 1,500 scf/STB of gas, capped at 360 months. Oil sells at $70/STB less $1.50 and gas at $3.00/MMBtu less $1.00, flat. The well has a 100 % WI and a 75 % NRI, pays Texas severance of 4.6 % on oil and 7.5 % on gas and 2.5 % ad valorem, costs $7MM all spent the month before it comes online, $8,000 a month of fixed LOE, $4/STB of variable LOE, $0.50/Mscf of gathering and $150,000 to plug. Cash is discounted at 10 %, against a 15 % hurdle and a 36-month payout limit.
Di = (0.35⁻¹ − 1)/1 = 1.857/yr and Dt = −ln 0.92 = 0.0834/yr, so the hyperbolic runs for ts = (1.857/0.0834 − 1)/1.857 = 11.45 years, to 4.49 % of the initial rate (35.9 STB/d), before the tail. The margin is 68.50 × 0.75 × 0.929 + 1.5 × (2.00 × 0.75 × 0.900 − 0.50) − 4 = $45.00/STB, so the economic limit is 8,000/(30.4375 × 45.00) = 5.84 STB/d, which the decline reaches after 33.2 years: the well runs to its 360-month cap and is plugged in month 363. Its EUR is 611.9 MSTB. The NPV at 10 % is $9.80MM, the IRR 112.5 % a year, the payout month 14, the discounted capital $6.89MM (7 × 1.1^(−2/12)) and PV/I 1.42; the undiscounted net cash is $17.51MM. These are the workbook's eight-well numbers for one well: its program NPV of $76.23MM over the 7.782 discount-weighted wells (one a month from month 3, Σ 1.1^(−k/12) for k = 0 to 7), its net cash of $140.07MM over eight, and the same IRR, PV/I, EUR and life. The NPV profile falls from $17.51MM at 0 % through $0.31MM at 100 % to −$0.26MM at 125 %.
At $5 oil the margin is negative and the well never produces: the cash flow is the D&C and the plugging alone, −$7.04MM of NPV, with no IRR and no payout. The workbook's P90 type curve (factor 0.75) earns $5.39MM at a 54.4 % IRR, paying out in month 21 and producing 458.4 MSTB over 357 months. A 40 % partner, with its revenue interest in proportion, earns exactly 40 % of the NPV, $3.92MM, at the same IRR and PV/I. With the D&C spread 10/20/30/40 % over the four months before a month-6 start, the discounted capital is 0.7/1.1^(2/12) + 1.4/1.1^(3/12) + 2.1/1.1^(4/12) + 2.8/1.1^(5/12) = $6.78MM, the workbook's hand check.
Functions used
None: the blueprint calculates with Excel's own functions.
Names (66)
| Name | Refers to | Comment |
|---|---|---|
PO.ECON.NPV.MonthlyLAMBDA |
=LAMBDA(cash,annual_rate,NPV((1+annual_rate)^(1/12)-1,cash)) |
NPV of end-of-month cash flows at an annual discount rate, in the units of cash. |
PO.ECON.IRR.MonthlyLAMBDA |
=LAMBDA(cash,LET(cash_col,cash,grid_step,0.0025,rates,SEQUENCE(1,201,-0.05,grid_step),periods,SEQUENCE(ROWS(cash_col)),npv_grid,MMULT(TRANSPOSE(cash_col),(1+rates)^(-periods)),first_pos,IFERROR(XMATCH(TRUE,npv_grid>0),0),crossing,IF(first_pos=0,0,IFERROR(XMATCH(1,(SEQUENCE(1,201)>first_pos)*(npv_grid<=0)),0)),IF(crossing=0,"n/a",LET(r_lo,INDEX(rates,1,crossing-1),v_lo,INDEX(npv_grid,1,crossing-1),v_hi,INDEX(npv_grid,1,crossing),r_interp,r_lo+grid_step*v_lo/(v_lo-v_hi),r_refined,IFERROR(IRR(cash_col,r_lo),r_interp),(1+IF(AND(r_refined>=r_lo,r_refined<=r_lo+grid_step),r_refined,r_interp))^12-1)))) |
Annualised IRR of monthly cash flows: the first rate, scanning up from -5 %/month, at which NPV falls through zero; "n/a" when it never does |
PO.ECON.PayoutLAMBDA |
=LAMBDA(cash,LET(cumulative,SCAN(0,cash,LAMBDA(running,flow,running+flow)),trough,MATCH(MIN(cumulative),cumulative,0),IFERROR(MATCH(1,(SEQUENCE(ROWS(cumulative))>trough)*(cumulative>=0),0),"none"))) |
Month in which cumulative cash flow climbs back to zero after its low point; "none" if it never does |
PO.ECON.Capex.PhasingLAMBDA |
=LAMBDA(total,profile,total*profile/SUM(profile)) |
Spreads a capital total over periods in proportion to a phasing profile; returns an array the shape of the profile, in the units of total. |
NI_Online |
$B$4 |
Month the well comes online (month 1 starts the evaluation), months |
NI_LifeCap |
$B$5 |
Longest producing life of the well, months |
NI_IP |
$B$6 |
Initial oil rate of the type curve, STB/d |
NI_b |
$B$7 |
Arps hyperbolic exponent b |
NI_Dei |
$B$8 |
Initial decline, effective secant, %/yr |
NI_Dterm |
$B$9 |
Terminal decline, effective (exponential tail), %/yr |
NI_GOR |
$B$10 |
Gas-oil ratio, constant over life, scf/STB |
NI_TC |
$B$11 |
Type-curve factor (scales the initial rate) |
NI_Oil |
$B$13 |
Oil price (WTI), $/STB |
NI_OilDiff |
$B$14 |
Oil differential, deducted (quality and transport), $/STB |
NI_Gas |
$B$15 |
Gas price (Henry Hub, 1 MMBtu per Mscf), $/MMBtu |
NI_GasDiff |
$B$16 |
Gas differential, deducted (Waha basis), $/MMBtu |
NI_Esc |
$B$17 |
Escalation of prices and operating costs, %/yr |
NI_WI |
$B$18 |
Working interest (scales costs and capital), % |
NI_NRI |
$B$19 |
Net revenue interest (25 % royalty at 100 % WI), % |
NI_SevOil |
$B$20 |
Oil severance tax (Texas, of the oil's value), % |
NI_SevGas |
$B$21 |
Gas severance tax (Texas, of the gas's value), % |
NI_AdVal |
$B$22 |
Ad valorem tax, as a share of net revenue, % |
NI_DC |
$B$24 |
Drilling and completion of the well, $MM |
NI_LOE |
$B$25 |
Fixed LOE, $/well-month |
NI_LOEVar |
$B$26 |
Variable LOE per barrel of oil, $/STB |
NI_Gath |
$B$27 |
Gas gathering and processing, $/Mscf |
NI_PA |
$B$28 |
Plugging and abandonment, the month after the last production, $ |
NI_Phase4 |
$B$29 |
D&C share spent four months before online, % |
NI_Phase3 |
$B$30 |
D&C share spent three months before online, % |
NI_Phase2 |
$B$31 |
D&C share spent two months before online, % |
NI_Phase1 |
$B$32 |
D&C share spent the month before online, % |
NI_Disc |
$B$34 |
Discount rate, end-of-month cash flows, %/yr |
NI_Hurdle |
$B$35 |
IRR hurdle, %/yr |
NI_PayoutMax |
$B$36 |
Longest acceptable payout, from month 1, months |
NI_Phasing |
$B$29:$B$32 |
The D&C phasing shares, four months before the well comes online down to the month before |
NI_Inputs |
$B$4:$B$36 |
The well's timing and type curve, prices, interests and taxes, costs and capital phasing, the discount rate, the IRR hurdle and the payout limit |
NI_Days |
$B$39 |
Days in a month, 365.25/12, days/month |
NI_MoYr |
$B$40 |
Months in a year, months/yr |
NI_PerMM |
$B$41 |
Dollars in a million, $/$MM |
NI_Di |
$B$44 |
Initial nominal decline, from the effective secant, 1/yr |
NI_Dt |
$B$45 |
Terminal nominal decline, from the effective, 1/yr |
NI_Ts |
$B$46 |
Time the hyperbolic switches to the terminal decline, years |
NI_Qs |
$B$47 |
Rate at the switch over the initial rate |
NI_Qi |
$B$48 |
Initial oil rate, IP × type-curve factor, STB/d |
NI_Margin |
$B$49 |
Operating margin per barrel of oil, net of royalty and taxes, $/STB |
NI_QLimit |
$B$50 |
Economic-limit oil rate, fixed LOE over the margin, STB/d |
NI_TLimit |
$B$51 |
Time the decline takes to reach the limit, years |
NI_Life |
$B$52 |
Producing life, to the economic limit or the cap, months |
NI_N |
$B$53 |
Months in the cash flow, to the plugging month, months |
NI_NPV |
$B$56 |
NPV at the discount rate, $MM |
NI_IRR |
$B$57 |
IRR, annualised, %/yr |
NI_Payout |
$B$58 |
Payout month, undiscounted, months |
NI_PvCapital |
$B$59 |
Discounted capital, $MM |
NI_PVI |
$B$60 |
PV/I, NPV over the discounted capital |
NI_EUR |
$B$61 |
Oil EUR over the producing life, MSTB |
NI_NetCash |
$B$62 |
Net cash, undiscounted, $MM |
NI_IrrCheck |
$B$63 |
IRR check verdict |
NI_IrrCheckNote |
$C$63 |
IRR check comment |
NI_PayoutCheck |
$B$64 |
Payout check verdict |
NI_PayoutCheckNote |
$C$64 |
Payout check comment |
NI_Results |
$B$44:$B$64 |
The decline terms, the economic limit and life, the months in the cash flow, the NPV, IRR, payout, discounted capital, PV/I, EUR and net cash, and two checks |
NI_CapitalPhasing |
$A$71:$D$74 |
Each D&C share's lead, its share, the month it is spent (before month 1 it falls in month 1) and its capital |
NI_Spend |
$C$71:$C$74 |
The month each D&C share is spent, four months before online down to the month before |
NI_Profile |
$A$78:$B$89 |
Discount rates, and the well's NPV at each |
NI_Points |
$A$93:$C$94 |
The IRR at zero NPV, and the NPV at the sheet's discount rate |
NI_ProfileCurve |
$A$78:$C$89 |
NPV Against the Discount Rate |
Details
| Inserts | 99 rows × 12 columns |
| Category | Petroleum Economics |
| For agents and tools | Descriptor (.md) |