Decline Model Comparison — Arps, Duong, PLE
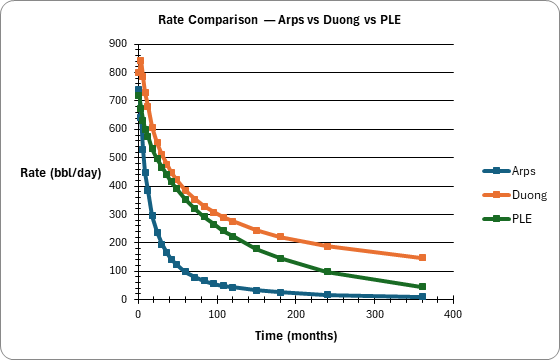
Side-by-side comparison of three decline models with EUR analysis. Named inputs for all model parameters. 21 time steps out to 360 months with model spread analysis.
Decline Model Comparison
Excel workbook
Inputs
Named cells you can edit — every result recalculates from them.
| Name | Description | Default | Unit |
|---|---|---|---|
DMF_Qi |
Initial Rate | 800 | bbl/day |
DMF_Qecon |
Economic Limit | 10 | bbl/day |
DMF_Arps_Di |
Di | 0.08 | 1/month |
DMF_Arps_b |
b-exponent | 0.7 | dimensionless |
DMF_Duong_a |
a constant | 1.3 | dimensionless |
DMF_Duong_m |
m exponent | 1.15 | dimensionless |
DMF_PLE_Di |
Di | 0.10 | 1/month |
DMF_PLE_n |
n exponent | 0.4 | dimensionless |
DMF_PLE_Dinf |
Dinf | 0.005 | 1/month |
2 sheets, shown with the values the file opens with
| A | B | C | D | E | F | |
|---|---|---|---|---|---|---|
| 1 | Decline Model Comparison — Inputs | |||||
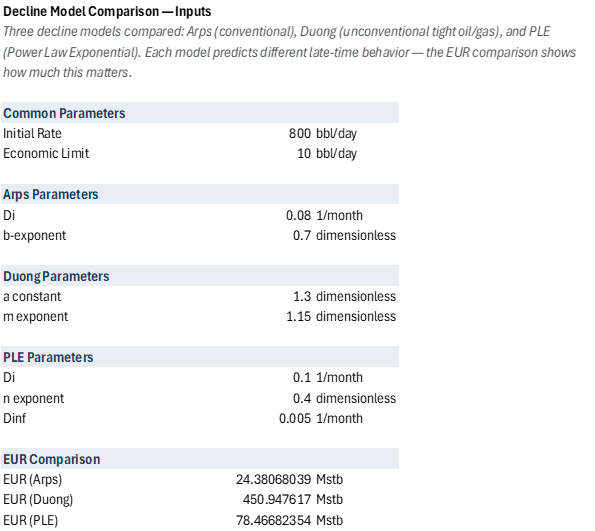
| 2 | Three decline models compared: Arps (conventional), Duong (unconventional tight oil/gas), and PLE (Power Law Exponential). Each model predicts different late-time behavior — the EUR comparison shows how much this matters. | |||||
| 3 | ||||||
| 4 | Common Parameters | |||||
| 5 | Initial Rate | 800 | bbl/day | |||
| 6 | Economic Limit | 10 | bbl/day | |||
| 7 | ||||||
| 8 | Arps Parameters | |||||
| 9 | Di | 0.08 | 1/month | |||
| 10 | b-exponent | 0.7 | dimensionless | |||
| 11 | ||||||
| 12 | Duong Parameters | |||||
| 13 | a constant | 1.3 | dimensionless | |||
| 14 | m exponent | 1.15 | dimensionless | |||
| 15 | ||||||
| 16 | PLE Parameters | |||||
| 17 | Di | 0.1 | 1/month | |||
| 18 | n exponent | 0.4 | dimensionless | |||
| 19 | Dinf | 0.005 | 1/month | |||
| 20 | ||||||
| 21 | EUR Comparison | |||||
| 22 | EUR (Arps) | 24.38068039 | Mstb | |||
| 23 | EUR (Duong) | 450.947617 | Mstb | |||
| 24 | EUR (PLE) | 78.46682354 | Mstb |
| A | B | C | D | E | F | |
|---|---|---|---|---|---|---|
| 1 | Rate Forecast — Three Models | |||||
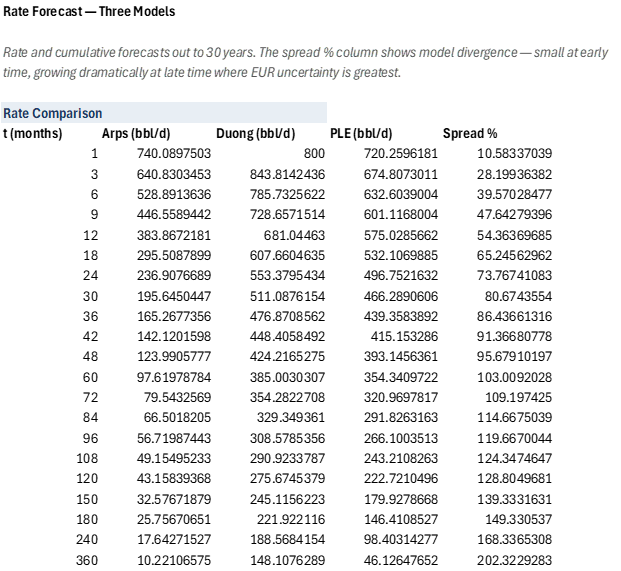
| 2 | Rate and cumulative forecasts out to 30 years. The spread % column shows model divergence — small at early time, growing dramatically at late time where EUR uncertainty is greatest. | |||||
| 3 | ||||||
| 4 | Rate Comparison | |||||
| 5 | t (months) | Arps (bbl/d) | Duong (bbl/d) | PLE (bbl/d) | Spread % | |
| 6 | 1 | 740.0897503 | 800 | 720.2596181 | 10.58337039 | |
| 7 | 3 | 640.8303453 | 843.8142436 | 674.8073011 | 28.19936382 | |
| 8 | 6 | 528.8913636 | 785.7325622 | 632.6039004 | 39.57028477 | |
| 9 | 9 | 446.5589442 | 728.6571514 | 601.1168004 | 47.64279396 | |
| 10 | 12 | 383.8672181 | 681.04463 | 575.0285662 | 54.36369685 | |
| 11 | 18 | 295.5087899 | 607.6604635 | 532.1069885 | 65.24562962 | |
| 12 | 24 | 236.9076689 | 553.3795434 | 496.7521632 | 73.76741083 | |
| 13 | 30 | 195.6450447 | 511.0876154 | 466.2890606 | 80.6743554 | |
| 14 | 36 | 165.2677356 | 476.8708562 | 439.3583892 | 86.43661316 | |
| 15 | 42 | 142.1201598 | 448.4058492 | 415.153286 | 91.36680778 | |
| 16 | 48 | 123.9905777 | 424.2165275 | 393.1456361 | 95.67910197 | |
| 17 | 60 | 97.61978784 | 385.0030307 | 354.3409722 | 103.0092028 | |
| 18 | 72 | 79.5432569 | 354.2822708 | 320.9697817 | 109.197425 | |
| 19 | 84 | 66.5018205 | 329.349361 | 291.8263163 | 114.6675039 | |
| 20 | 96 | 56.71987443 | 308.5785356 | 266.1003513 | 119.6670044 | |
| 21 | 108 | 49.15495233 | 290.9233787 | 243.2108263 | 124.3474647 | |
| 22 | 120 | 43.15839368 | 275.6745379 | 222.7210496 | 128.8049681 | |
| 23 | 150 | 32.57671879 | 245.1156223 | 179.9278668 | 139.3331631 | |
| 24 | 180 | 25.75670651 | 221.922116 | 146.4108527 | 149.330537 | |
| 25 | 240 | 17.64271527 | 188.5684154 | 98.40314277 | 168.3365308 | |
| 26 | 360 | 10.22106575 | 148.1076289 | 46.12647652 | 202.3229283 | |
| 27 | ||||||
| 28 | ||||||
| 29 | ||||||
| 30 | ||||||
| 31 | ||||||
| 32 | ||||||
| 33 | ||||||
| 34 | ||||||
| 35 | ||||||
| 36 | ||||||
| 37 | ||||||
| 38 | ||||||
| 39 | ||||||
| 40 | ||||||
| 41 | ||||||
| 42 | ||||||
| 43 | ||||||
| 44 | ||||||
| 45 |
| Name | Refers To | Comment |
|---|---|---|
| DMF_Arps_Di | Inputs!$B$9 | |
| DMF_Arps_b | Inputs!$B$10 | |
| DMF_Duong_a | Inputs!$B$13 | |
| DMF_Duong_m | Inputs!$B$14 | |
| DMF_PLE_Di | Inputs!$B$17 | |
| DMF_PLE_Dinf | Inputs!$B$19 | |
| DMF_PLE_n | Inputs!$B$18 | |
| DMF_Qecon | Inputs!$B$6 | |
| DMF_Qi | Inputs!$B$5 |
| Opens in | Needs the Petroleum Office add-in: its PO functions show #NAME? without it once Excel recalculates. |
| Functions used | PO.DCA.Arps.EURPO.DCA.Arps.RatePO.DCA.Duong.EURPO.DCA.Duong.RatePO.DCA.PLE.EURPO.DCA.PLE.Rate |
| File | DeclineModelFitters.xlsx, 13 KB |
| Category | Production |
| For agents and tools | Structure (.json) · Descriptor (.md) |