Decline Curve Analysis — Arps with EUR
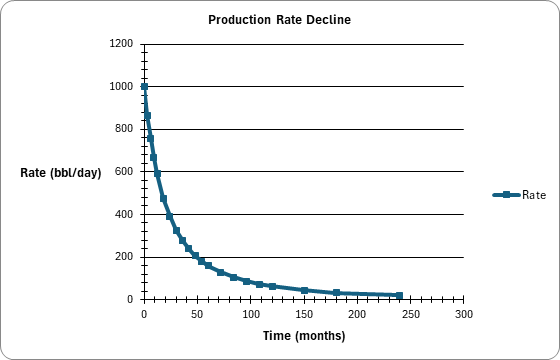
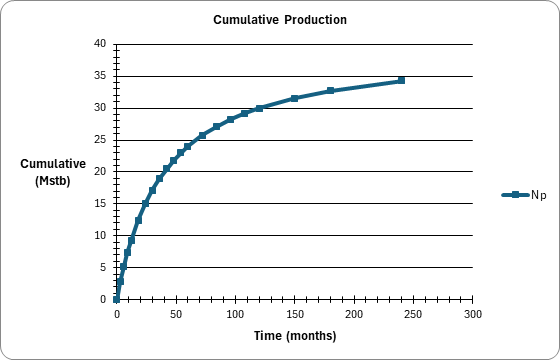
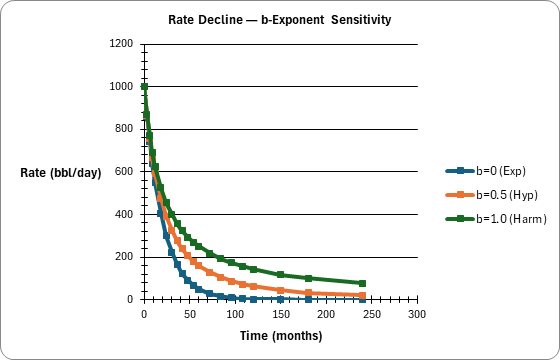
Complete Arps decline analysis: forecast rate and cumulative production over 20 years, calculate EUR at economic limit, and compare b-exponent sensitivity (b=0, 0.5, 1.0). Named input cells for qi, Di, b, and economic limit rate.
Decline Curve Analysis
Excel workbook
Inputs
Named cells you can edit — every result recalculates from them.
| Name | Description | Default | Unit |
|---|---|---|---|
DCA_Qi |
Initial Rate (qi) | 1000 | bbl/day |
DCA_Di |
Initial Decline Rate (Di) | 0.05 | 1/month |
DCA_b |
b-Exponent | 0.5 | (0=exp, 1=harmonic) |
DCA_Qecon |
Economic Limit Rate | 10 | bbl/day |
3 sheets, shown with the values the file opens with
| A | B | C | D | E | F | |
|---|---|---|---|---|---|---|
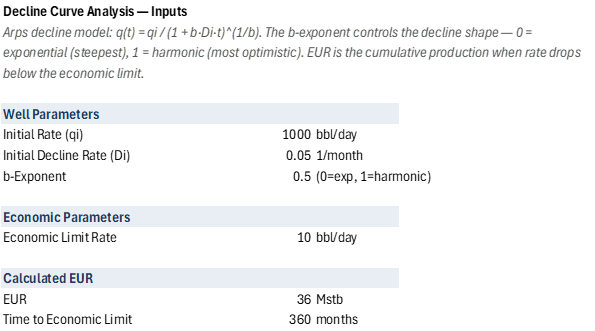
| 1 | Decline Curve Analysis — Inputs | |||||
| 2 | Arps decline model: q(t) = qi / (1 + b·Di·t)^(1/b). The b-exponent controls the decline shape — 0 = exponential (steepest), 1 = harmonic (most optimistic). EUR is the cumulative production when rate drops below the economic limit. | |||||
| 3 | ||||||
| 4 | Well Parameters | |||||
| 5 | Initial Rate (qi) | 1000 | bbl/day | |||
| 6 | Initial Decline Rate (Di) | 0.05 | 1/month | |||
| 7 | b-Exponent | 0.5 | (0=exp, 1=harmonic) | |||
| 8 | ||||||
| 9 | Economic Parameters | |||||
| 10 | Economic Limit Rate | 10 | bbl/day | |||
| 11 | ||||||
| 12 | Calculated EUR | |||||
| 13 | EUR | 36 | Mstb | |||
| 14 | Time to Economic Limit | 360 | months |
| A | B | C | D | E | F | |
|---|---|---|---|---|---|---|
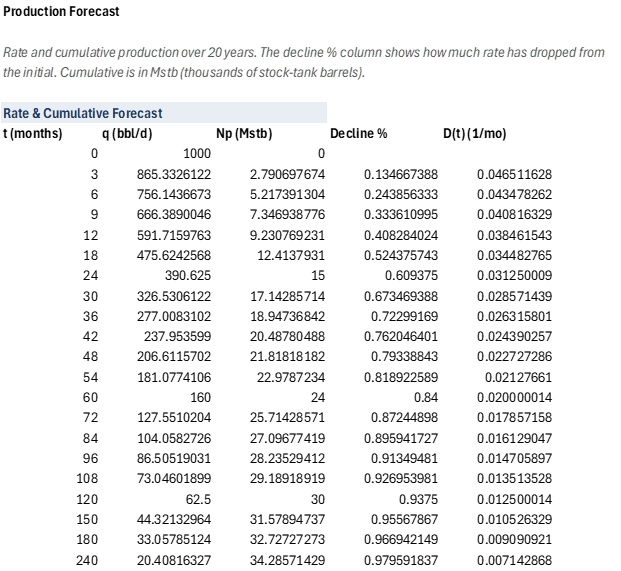
| 1 | Production Forecast | |||||
| 2 | Rate and cumulative production over 20 years. The decline % column shows how much rate has dropped from the initial. Cumulative is in Mstb (thousands of stock-tank barrels). | |||||
| 3 | ||||||
| 4 | Rate & Cumulative Forecast | |||||
| 5 | t (months) | q (bbl/d) | Np (Mstb) | Decline % | D(t) (1/mo) | |
| 6 | 0 | 1000 | 0 | |||
| 7 | 3 | 865.3326122 | 2.790697674 | 0.1346673878 | 0.04651162836 | |
| 8 | 6 | 756.1436673 | 5.217391304 | 0.2438563327 | 0.04347826235 | |
| 9 | 9 | 666.3890046 | 7.346938776 | 0.3336109954 | 0.04081632928 | |
| 10 | 12 | 591.7159763 | 9.230769231 | 0.4082840237 | 0.03846154256 | |
| 11 | 18 | 475.6242568 | 12.4137931 | 0.5243757432 | 0.03448276526 | |
| 12 | 24 | 390.625 | 15 | 0.609375 | 0.03125000879 | |
| 13 | 30 | 326.5306122 | 17.14285714 | 0.6734693878 | 0.02857143907 | |
| 14 | 36 | 277.0083102 | 18.94736842 | 0.7229916898 | 0.02631580128 | |
| 15 | 42 | 237.953599 | 20.48780488 | 0.762046401 | 0.0243902567 | |
| 16 | 48 | 206.6115702 | 21.81818182 | 0.7933884298 | 0.02272728625 | |
| 17 | 54 | 181.0774106 | 22.9787234 | 0.8189225894 | 0.02127660979 | |
| 18 | 60 | 160 | 24 | 0.84 | 0.0200000144 | |
| 19 | 72 | 127.5510204 | 25.71428571 | 0.8724489796 | 0.01785715762 | |
| 20 | 84 | 104.0582726 | 27.09677419 | 0.8959417274 | 0.01612904706 | |
| 21 | 96 | 86.50519031 | 28.23529412 | 0.9134948097 | 0.01470589701 | |
| 22 | 108 | 73.04601899 | 29.18918919 | 0.926953981 | 0.01351352791 | |
| 23 | 120 | 62.5 | 30 | 0.9375 | 0.01250001406 | |
| 24 | 150 | 44.32132964 | 31.57894737 | 0.9556786704 | 0.01052632891 | |
| 25 | 180 | 33.05785124 | 32.72727273 | 0.9669421488 | 0.009090921262 | |
| 26 | 240 | 20.40816327 | 34.28571429 | 0.9795918367 | 0.007142867638 | |
| 27 | ||||||
| 28 | ||||||
| 29 | ||||||
| 30 | ||||||
| 31 | ||||||
| 32 | ||||||
| 33 | ||||||
| 34 | ||||||
| 35 | ||||||
| 36 | ||||||
| 37 | ||||||
| 38 | ||||||
| 39 | ||||||
| 40 | ||||||
| 41 | ||||||
| 42 | ||||||
| 43 | ||||||
| 44 | ||||||
| 45 | ||||||
| 46 | ||||||
| 47 | ||||||
| 48 | ||||||
| 49 | ||||||
| 50 | ||||||
| 51 | ||||||
| 52 | ||||||
| 53 | ||||||
| 54 | ||||||
| 55 | ||||||
| 56 | ||||||
| 57 | ||||||
| 58 | ||||||
| 59 | ||||||
| 60 | ||||||
| 61 | ||||||
| 62 | ||||||
| 63 | ||||||
| 64 | ||||||
| 65 | ||||||
| 66 | ||||||
| 67 | ||||||
| 68 | ||||||
| 69 | ||||||
| 70 | ||||||
| 71 |
| A | B | C | D | E | F | |
|---|---|---|---|---|---|---|
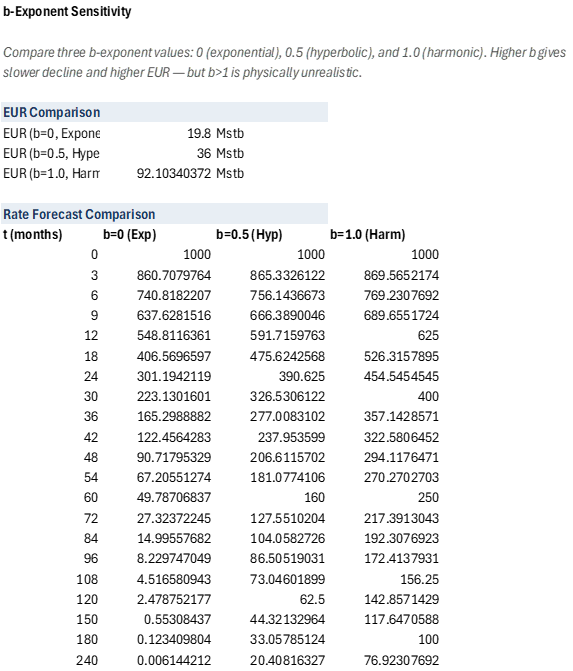
| 1 | b-Exponent Sensitivity | |||||
| 2 | Compare three b-exponent values: 0 (exponential), 0.5 (hyperbolic), and 1.0 (harmonic). Higher b gives slower decline and higher EUR — but b>1 is physically unrealistic. | |||||
| 3 | ||||||
| 4 | EUR Comparison | |||||
| 5 | EUR (b=0, Exponential) | 19.8 | Mstb | |||
| 6 | EUR (b=0.5, Hyperbolic) | 36 | Mstb | |||
| 7 | EUR (b=1.0, Harmonic) | 92.10340372 | Mstb | |||
| 8 | ||||||
| 9 | Rate Forecast Comparison | |||||
| 10 | t (months) | b=0 (Exp) | b=0.5 (Hyp) | b=1.0 (Harm) | ||
| 11 | 0 | 1000 | 1000 | 1000 | ||
| 12 | 3 | 860.7079764 | 865.3326122 | 869.5652174 | ||
| 13 | 6 | 740.8182207 | 756.1436673 | 769.2307692 | ||
| 14 | 9 | 637.6281516 | 666.3890046 | 689.6551724 | ||
| 15 | 12 | 548.8116361 | 591.7159763 | 625 | ||
| 16 | 18 | 406.5696597 | 475.6242568 | 526.3157895 | ||
| 17 | 24 | 301.1942119 | 390.625 | 454.5454545 | ||
| 18 | 30 | 223.1301601 | 326.5306122 | 400 | ||
| 19 | 36 | 165.2988882 | 277.0083102 | 357.1428571 | ||
| 20 | 42 | 122.4564283 | 237.953599 | 322.5806452 | ||
| 21 | 48 | 90.71795329 | 206.6115702 | 294.1176471 | ||
| 22 | 54 | 67.20551274 | 181.0774106 | 270.2702703 | ||
| 23 | 60 | 49.78706837 | 160 | 250 | ||
| 24 | 72 | 27.32372245 | 127.5510204 | 217.3913043 | ||
| 25 | 84 | 14.99557682 | 104.0582726 | 192.3076923 | ||
| 26 | 96 | 8.229747049 | 86.50519031 | 172.4137931 | ||
| 27 | 108 | 4.516580943 | 73.04601899 | 156.25 | ||
| 28 | 120 | 2.478752177 | 62.5 | 142.8571429 | ||
| 29 | 150 | 0.5530843701 | 44.32132964 | 117.6470588 | ||
| 30 | 180 | 0.1234098041 | 33.05785124 | 100 | ||
| 31 | 240 | 0.006144212353 | 20.40816327 | 76.92307692 | ||
| 32 | ||||||
| 33 | ||||||
| 34 | ||||||
| 35 | ||||||
| 36 | ||||||
| 37 | ||||||
| 38 | ||||||
| 39 | ||||||
| 40 | ||||||
| 41 | ||||||
| 42 | ||||||
| 43 | ||||||
| 44 | ||||||
| 45 | ||||||
| 46 | ||||||
| 47 | ||||||
| 48 | ||||||
| 49 | ||||||
| 50 |
| Name | Refers To | Comment |
|---|---|---|
| DCA_Di | Inputs!$B$6 | |
| DCA_Qecon | Inputs!$B$10 | |
| DCA_Qi | Inputs!$B$5 | |
| DCA_b | Inputs!$B$7 |
| Opens in | Needs the Petroleum Office add-in: its PO functions show #NAME? without it once Excel recalculates. |
| Functions used | PO.DCA.Arps.DPO.DCA.Arps.EURPO.DCA.Arps.ProdPO.DCA.Arps.RatePO.DCA.Arps.Time |
| File | DeclineFunctions.xlsx, 19 KB |
| Category | Production |
| For agents and tools | Structure (.json) · Descriptor (.md) |