Probabilistic Oil in Place by Monte Carlo
Description
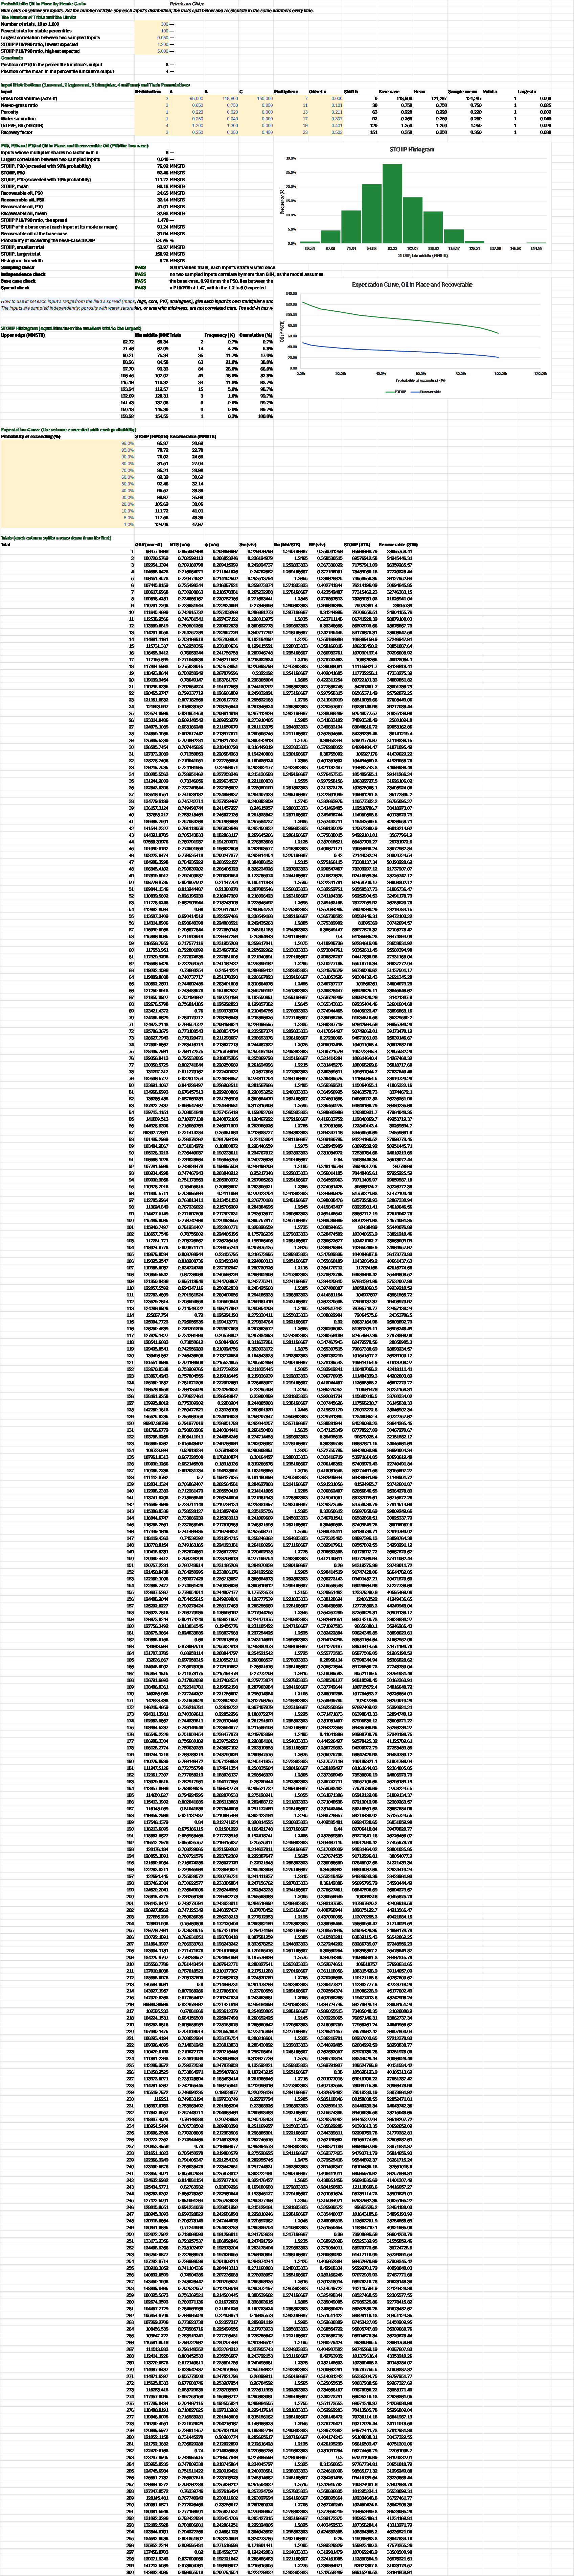
How much oil might the structure hold, low, mid and high, once each input's uncertainty is counted? You give each of six inputs, the gross rock volume, net-to-gross, porosity, water saturation, Bo and the recovery factor, a distribution, and set the number of trials. You read off the P90, P50, P10 and mean of the oil in place and of the recoverable oil, P90 being the low case, from a stratified sample that recalculates to the same numbers every time.
Parameters:
- Trials:
VM_n, a whole number from 10 to 1,000 - Limits: the fewest trials
VM_NMin, the largest correlation between sampled inputsVM_CorrMax, and the P10/P90 rangeVM_RatioMintoVM_RatioMax - Distributions: for each input, in the distribution table, its distribution (1 normal, 2 lognormal, 3 triangular, 4 uniform) and A, B and C (normal: mean, standard deviation; lognormal: mean and standard deviation of ln x; triangular: minimum, mode, maximum; uniform: minimum, maximum), and its permutation multiplier a and offset fraction c
How to use it: The ranges are made up for the example. Set each input's distribution from the field's own spread: the GRV from the low and high maps, NTG, porosity and Sw from the petrophysics across the wells, Bo from PVT, and the RF from analogues. Give each input its own multiplier and offset, and raise n to 1,000 for a final run.
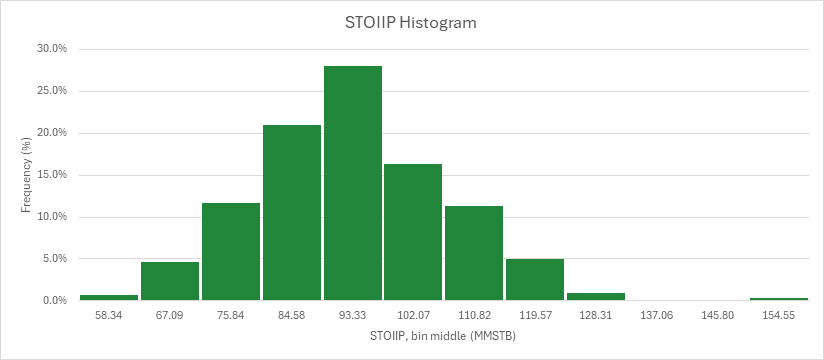
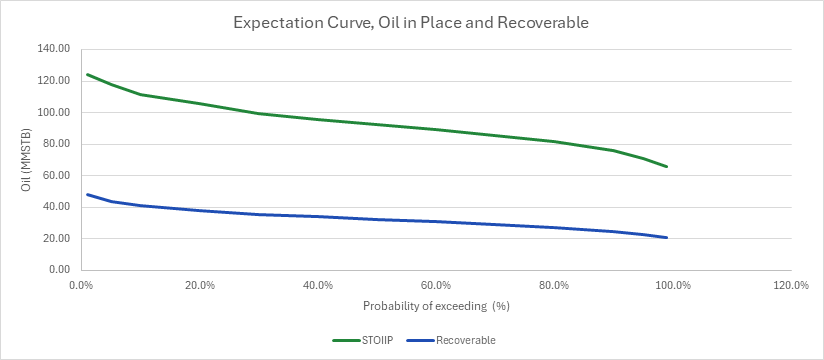
Each input is drawn from its own distribution by a deterministic stratified sampler, and STOIIP and the recoverable oil are computed trial by trial. A histogram and an expectation curve draw the outcome. There is no RAND or RANDARRAY. Each input's strata are shuffled by its own fixed permutation, so the sheet recalculates to the same numbers every time and its percentiles can be quoted and checked.
Each input column is one formula that spills n rows, and STOIIP and the recoverable oil are one formula each over the first n rows of those columns (TAKE(first:last, n)). There is no volatile OFFSET, so a saved sheet opens on its saved values without recalculating. The sheet writes the same few cells at any n, so n can go to 1,000 without the sheet growing.
Four checks give PASS, WARN or FAIL. The sampling check fails when n is over 1,000 or shares a factor with an input's multiplier, and warns when n is under the limit. The independence check warns when two sampled inputs correlate by more than the limit. The base-case check warns when the deterministic case lies outside the P90 to P10. The spread check warns when P10/P90 lies outside the range expected.
Method:
- Sampling. For input j, the shift is b_j = MOD(ROUND(c_j n), n), and trial i draws the stratum π(i) = MOD(a_j (i − 1) + b_j, n) + 1 at u = (π(i) − 0.5)/n. The input is x = F⁻¹(u), the inverse of its distribution. When a_j shares no factor with n, π visits every stratum once.
- Volumes. Trial i's STOIIP is 7758 GRV NTG φ (1 − Sw)/Bo and its recoverable oil STOIIP × RF.
- Percentiles. The percentiles are
PERCENTILE.INCat 0.1, 0.5 and 0.9: P90 is the 10th percentile, exceeded by 90% of the trials. The histogram bins the trials equally from the smallest to the largest. The expectation curve reads the volume exceeded with each probability p as the (1 − p) percentile. - Base case. The base case takes each input at its mode, mean or midpoint (e^A for a lognormal).
Example: The default case is the oil leg of the volumetrics family's synthetic field, the one the Volumetric Oil in Place sheet computes. The gross rock volume is triangular from 95,000 to 150,000 acre·ft about that sheet's 118,800. NTG is triangular from 0.65 to 0.85 about 0.75, and porosity normal at 0.22 ± 0.02. Sw is normal at 0.25 ± 0.04, Bo uniform from 1.20 to 1.30 bbl/STB, and the RF triangular from 25% to 45% about 35%. The multipliers are 7, 11, 13, 17, 19 and 23, with offsets of 0, 0.101, 0.211, 0.307, 0.401 and 0.503 of n, as the stratified sampler's notes give for the first six inputs. n is 300: below about 250 the lattice's columns begin to correlate (0.086 at n = 200), and at 300 the trial table stays short enough to read; the sheet is validated up to n = 1,000.
At n = 300 none of the six multipliers shares a factor with n, and the largest correlation between two sampled inputs is 0.040. STOIIP's P90, P50 and P10 are 76.02, 92.46 and 111.72 MMSTB, with a mean of 93.18 and a P10/P90 of 1.47, inside the 1.2 to 5 expected. The recoverable oil's are 24.65, 32.14 and 41.01 MMSTB, with a mean of 32.63. The base case, each input at its mode or mean, is the oil sheet's 91.24 MMSTB (31.94 recoverable): 0.99 times the P50, between the P90 and the P10, and exceeded by 53.7% of the trials. The mean lies above it because the gross rock volume's triangle leans high, its mean 121,267 acre·ft against its mode of 118,800. The trials run from 53.97 to 158.92 MMSTB. At n = 1,000 the percentiles move by less than 0.6%, to 75.61, 92.49 and 111.47 MMSTB (24.69, 32.21 and 41.06 recoverable), and the largest correlation falls to 0.016. At n = 200 the lattice's columns correlate by 0.086 and the independence check warns. At n = 50 the sampling check warns, and at n = 700, which 7 divides, it fails.
Functions used
None: the blueprint calculates with Excel's own functions.
Names (41)
| Name | Refers to | Comment |
|---|---|---|
PO.RES.MC.SampleLAMBDA |
=LAMBDA(Dist, Dist_A, Dist_B, Dist_C, n, Mult, Shift, IF(GCD(Mult, n)<>1, NA(), LET(u, (MOD(Mult*(SEQUENCE(n)-1)+Shift, n)+0.5)/n, IF(Dist=1, NORM.INV(u, Dist_A, Dist_B), IF(Dist=2, LOGNORM.INV(u, Dist_A, Dist_B), IF(Dist=3, IF(u<(Dist_B-Dist_A)/(Dist_C-Dist_A), Dist_A+SQRT(u*(Dist_C-Dist_A)*(Dist_B-Dist_A)), Dist_C-SQRT((1-u)*(Dist_C-Dist_A)*(Dist_C-Dist_B))), IF(Dist=4, Dist_A+u*(Dist_B-Dist_A), NA()))))))) |
Deterministic stratified (Latin-hypercube) sample of n values: Dist 1 normal, 2 lognormal, 3 triangular, 4 uniform; strata shuffled by MOD(Mult*(i-1)+Shift, n). Inputs independent. |
PO.RES.MC.PercentilesLAMBDA |
=LAMBDA(X, HSTACK(PERCENTILE.INC(X, 0.1), PERCENTILE.INC(X, 0.5), PERCENTILE.INC(X, 0.9), AVERAGE(X))) |
P90, P50, P10 (petroleum convention: P90 the low case, exceeded 90% of the time) and the mean of a column of outcomes; linear interpolation as PERCENTILE.INC. |
PO.RES.Vol.STOIIPLAMBDA |
=LAMBDA(GRV, NTG, Phi, Sw, Bo, 7758*GRV*NTG*Phi*(1-Sw)/Bo) |
Stock-tank oil initially in place, STB: 7758 x GRV (acre-ft) x NTG x porosity x (1 - Sw) / Bo (rb/STB). |
PO.RES.Vol.RecoverableLAMBDA |
=LAMBDA(InPlace, RF, IF(OR(RF<0, RF>1), NA(), InPlace*RF)) |
Recoverable volume: a volume in place (STOIIP or GIIP, any unit) x a recovery factor between 0 and 1; same unit as the volume in place. |
VM_n |
$B$4 |
Number of trials, 10 to 1,000 |
VM_NMin |
$B$5 |
Fewest trials for stable percentiles |
VM_CorrMax |
$B$6 |
Largest correlation between two sampled inputs |
VM_RatioMin |
$B$7 |
STOIIP P10/P90 ratio, lowest expected |
VM_RatioMax |
$B$8 |
STOIIP P10/P90 ratio, highest expected |
VM_Inputs |
$B$4:$B$8 |
The number of trials, the fewest for stable percentiles, the largest correlation between sampled inputs, and the range of P10/P90 ratios expected |
VM_P10Pos |
$B$10 |
Position of P10 in the percentile function's output |
VM_MeanPos |
$B$11 |
Position of the mean in the percentile function's output |
VM_Distributions |
$A$15:$M$20 |
Each input's distribution, A (mean, mean of ln, min), B (sd, sd of ln, mode, max), C (triangular max), permutation multiplier and offset, then its shift, base case, mean, sample mean, multiplier check and largest correlation |
VM_Valid |
$B$23 |
Inputs whose multiplier shares no factor with n |
VM_MaxCorr |
$B$24 |
Largest correlation between two sampled inputs |
VM_P90 |
$B$25 |
STOIIP, P90 (exceeded with 90% probability), MMSTB |
VM_P50 |
$B$26 |
STOIIP, P50, MMSTB |
VM_P10 |
$B$27 |
STOIIP, P10 (exceeded with 10% probability), MMSTB |
VM_Mean |
$B$28 |
STOIIP, mean, MMSTB |
VM_RecP90 |
$B$29 |
Recoverable oil, P90, MMSTB |
VM_RecP50 |
$B$30 |
Recoverable oil, P50, MMSTB |
VM_RecP10 |
$B$31 |
Recoverable oil, P10, MMSTB |
VM_RecMean |
$B$32 |
Recoverable oil, mean, MMSTB |
VM_Ratio |
$B$33 |
STOIIP P10/P90 ratio, the spread |
VM_Base |
$B$34 |
STOIIP of the base case (each input at its mode or mean), MMSTB |
VM_BaseRec |
$B$35 |
Recoverable oil of the base case, MMSTB |
VM_PBase |
$B$36 |
Probability of exceeding the base-case STOIIP, % |
VM_Min |
$B$37 |
STOIIP, smallest trial, MMSTB |
VM_Max |
$B$38 |
STOIIP, largest trial, MMSTB |
VM_BinW |
$B$39 |
Histogram bin width, MMSTB |
VM_SampleCheck |
$B$40 |
Sampling check verdict |
VM_SampleCheckNote |
$C$40 |
Sampling check comment |
VM_IndependenceCheck |
$B$41 |
Independence check verdict |
VM_IndependenceCheckNote |
$C$41 |
Independence check comment |
VM_BaseCheck |
$B$42 |
Base case check verdict |
VM_BaseCheckNote |
$C$42 |
Base case check comment |
VM_SpreadCheck |
$B$43 |
Spread check verdict |
VM_SpreadCheckNote |
$C$43 |
Spread check comment |
VM_Results |
$B$23:$B$43 |
The multiplier count, the largest input correlation, STOIIP and recoverable P90, P50, P10 and mean, the P10/P90 ratio, the base case and its exceedance probability, the smallest and largest trial, the bin width and four checks |
VM_Histogram |
$A$51:$E$62 |
Each STOIIP bin's upper edge and middle, its count of trials, its frequency and the cumulative frequency |
VM_Curve |
$A$66:$C$78 |
Probabilities of exceeding, and the STOIIP and recoverable oil exceeded with each |
Details
| Inserts | 82 rows × 13 columns |
| Category | Reservoir Engineering |
| For agents and tools | Descriptor (.md) |