Shale Volume from Gamma Ray
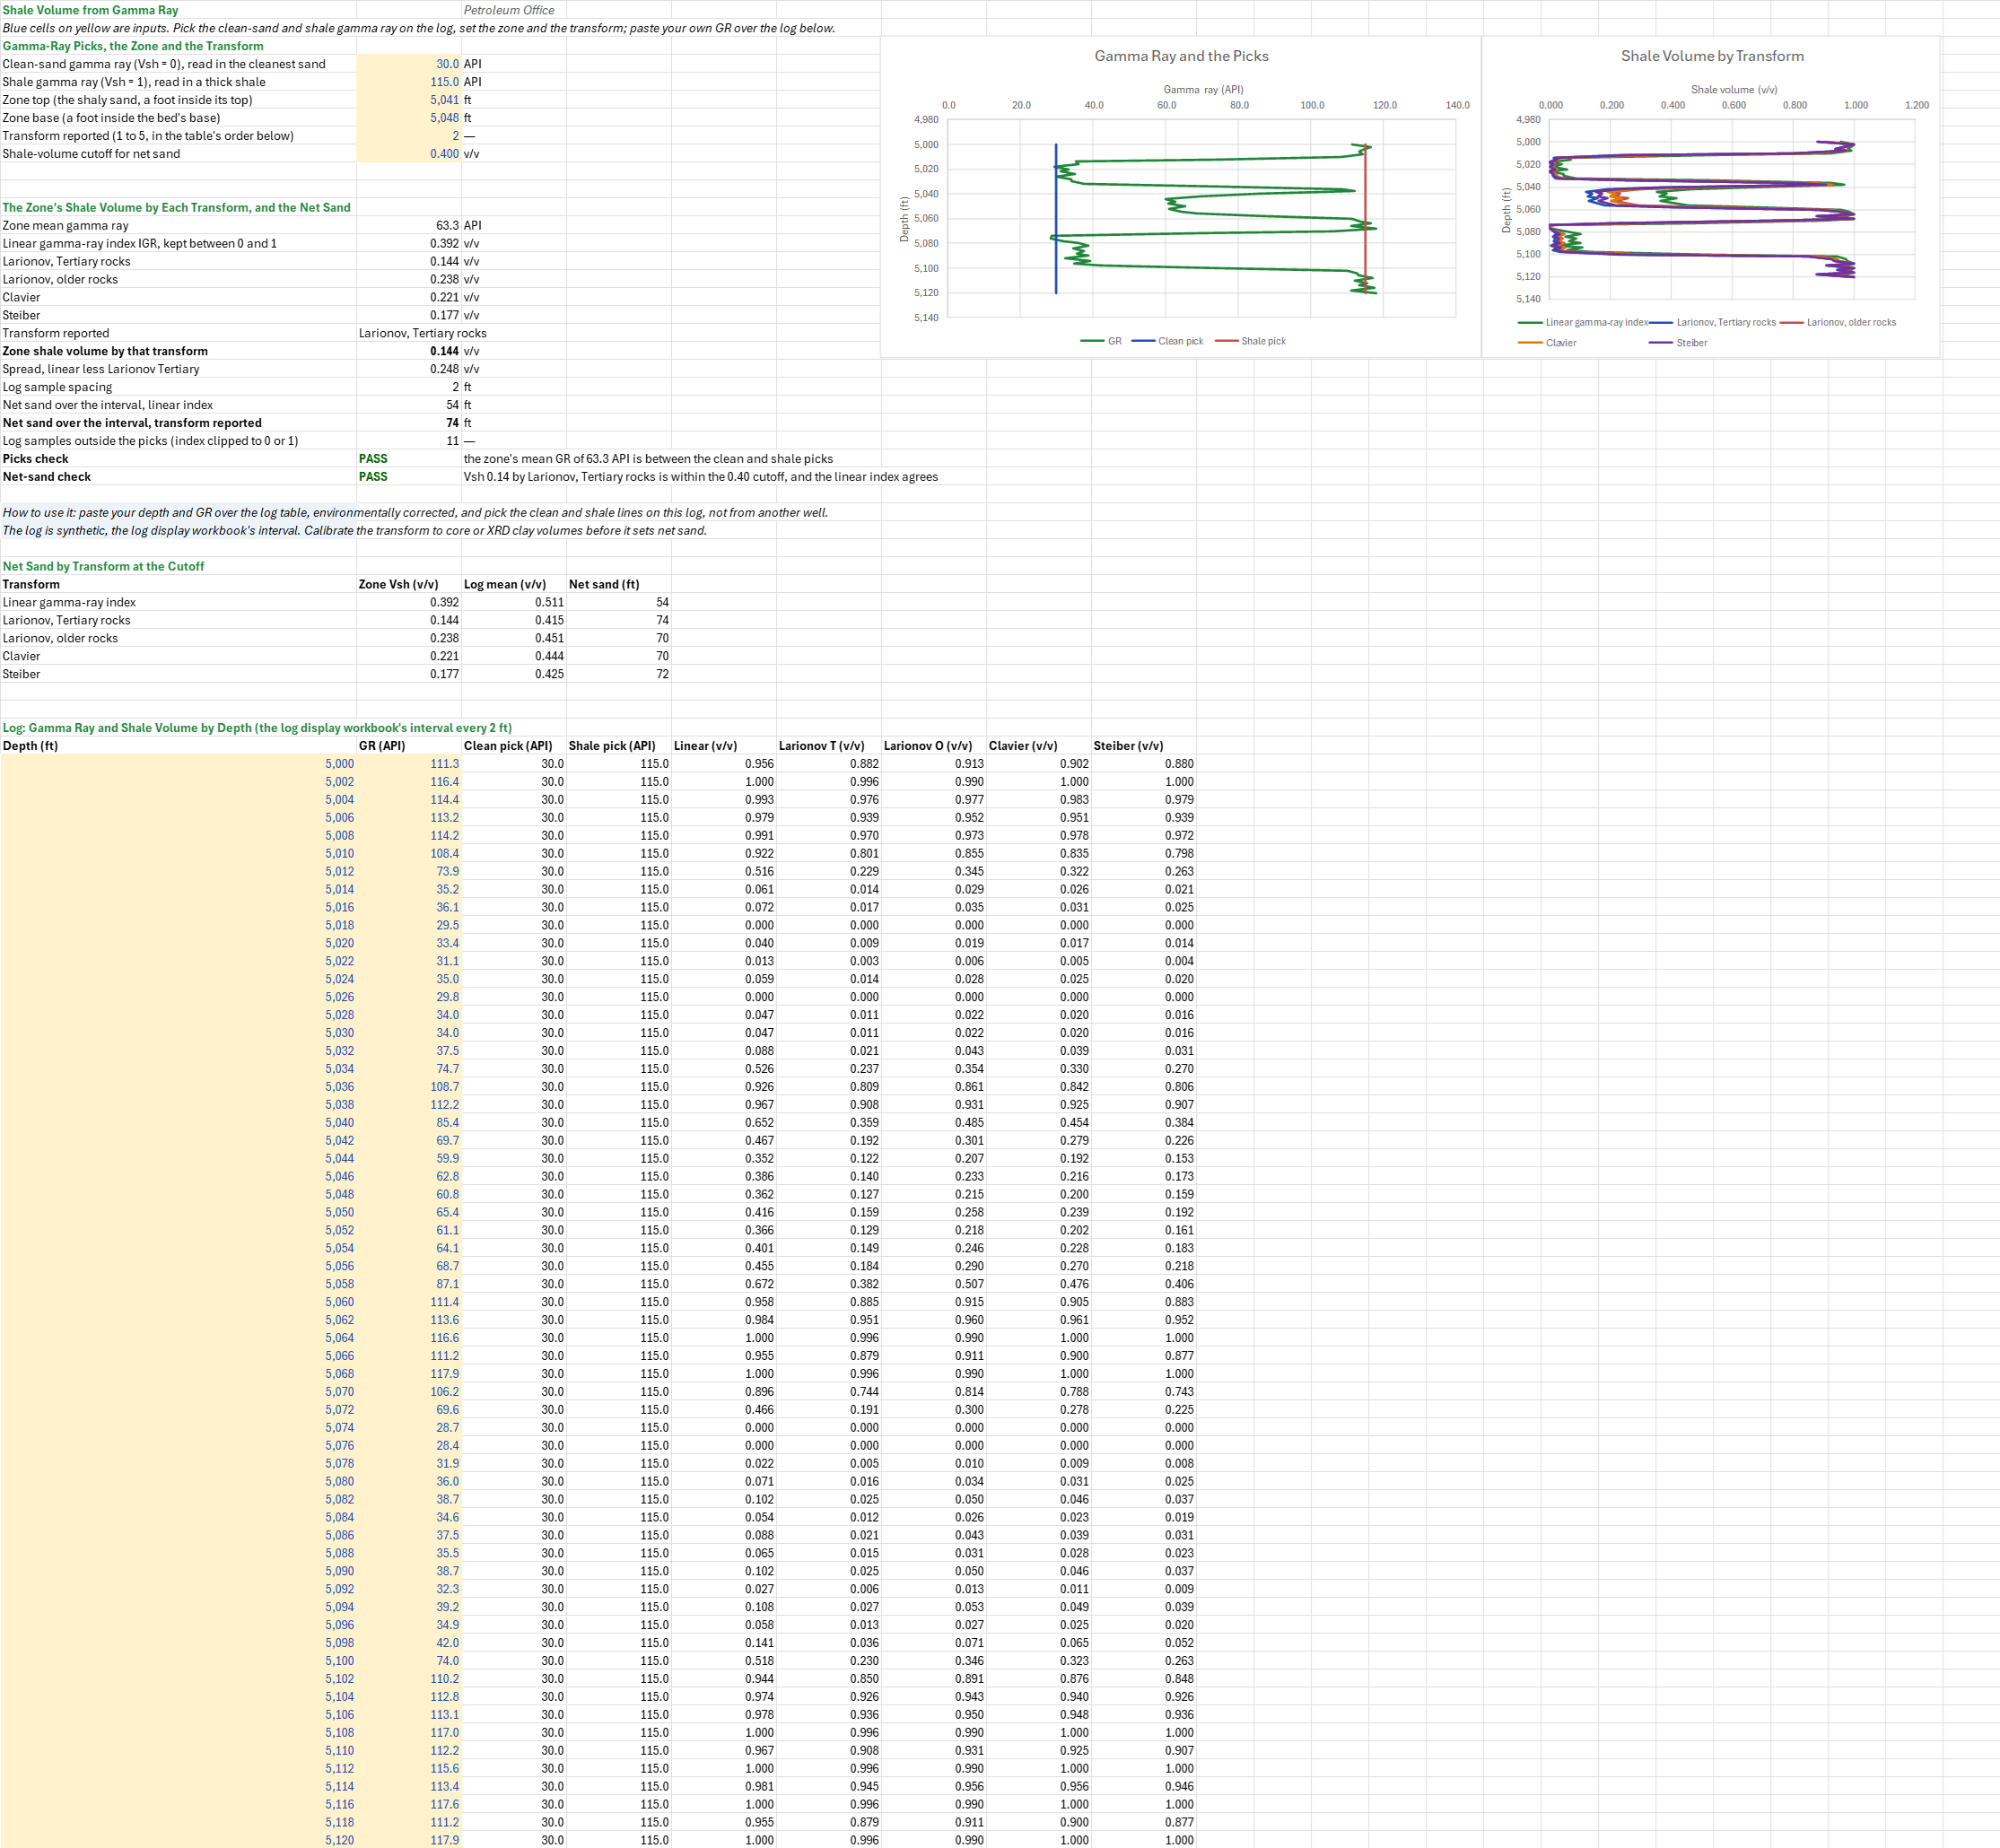
Description
How much shale is in the sand, and does the answer depend on the transform? You enter a clean-sand and a shale gamma-ray pick, a zone, the transform to report and the net-sand cutoff, over a gamma-ray log. You read off the shale volume at every depth and for the zone's mean gamma ray by the linear gamma-ray index and the Larionov (Tertiary and older rocks), Clavier and Steiber transforms, and the net sand each transform makes at the cutoff.
Parameters:
- Picks: the clean-sand gamma ray
VS_GRcland the shale gamma rayVS_GRsh(API) - Zone: its top
VS_ZTopand baseVS_ZBase(ft) - Transform:
VS_Method, 1 linear, 2 Larionov Tertiary, 3 Larionov older, 4 Clavier, 5 Steiber - Cutoff: the shale-volume cutoff for net sand
VS_VshCut(v/v) - Log: depth and GR in the log table, every 2 ft
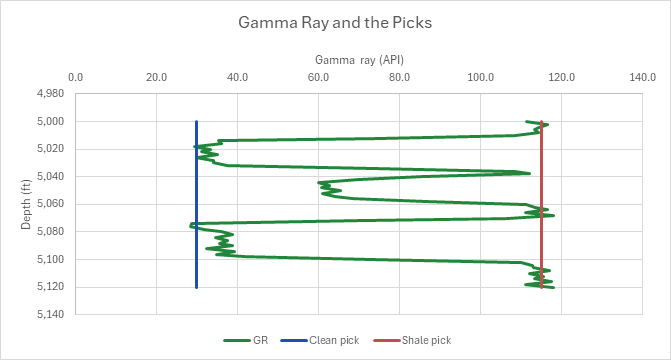
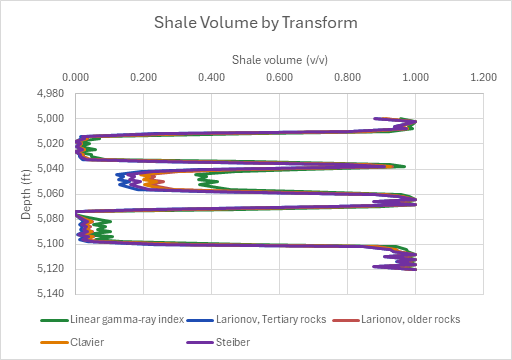
How to use it: The log is synthetic. Paste your depth and gamma ray over the log table, environmentally corrected for hole size and mud weight. Pick the clean and shale lines on this log, in its cleanest sand and a thick shale, not from another well. Calibrate the transform to core or XRD clay volumes before it sets net sand. A log track draws the five shale volumes against depth, beside a gamma-ray track with the two picks, and a table counts the net sand each transform makes at the shale-volume cutoff, which is where the choice of transform shows.
Method: The sheet reads shale volume between two picks: a clean-sand line, where Vsh is 0, and a shale line, where it is 1. The linear gamma-ray index IGR comes first, and four nonlinear transforms then read less shale from the same index.
- Index. IGR = (GR − GRcl) / (GRsh − GRcl), kept between 0 and 1; that clipped index is the linear shale volume.
- Transforms. Larionov for Tertiary rocks: Vsh = 0.083 (2^(3.7 IGR) − 1). Larionov for older rocks: Vsh = 0.33 (2^(2 IGR) − 1). Clavier: Vsh = 1.7 − √(3.38 − (IGR + 0.7)²). Steiber: Vsh = IGR / (3 − 2 IGR). All four read less shale than the index between 0 and 1, and all meet it at both ends.
- Zone and net sand. The zone's mean gamma ray is the mean of the log's samples between its top and base, and the sheet reports the transform you choose for it. Each sample stands for one sample spacing of rock, so the net sand of a transform is the count of samples at or below the cutoff times the spacing.
- Checks. Two checks give PASS, WARN or FAIL. The picks check fails when the zone's mean gamma ray is not between the picks. The net-sand check fails when the reported shale volume is above the cutoff, and warns when the reported transform passes the zone but the linear index does not.
Example: The default case is the Well-Log Display workbook's synthetic interval, 5,000 to 5,120 ft, sampled every 2 ft. It is a sand–shale sequence: shale to 5,012 ft, a clean oil sand to 5,034 ft, shale, a shaly sand from 5,040 ft with its oil–water contact at 5,049 ft, shale from 5,058 ft, a tight streak from 5,072 ft, a clean water sand from 5,077 ft and shale from 5,100 ft. The picks are the workbook's: 30 API clean, 115 API shale. The zone is the shaly sand a foot inside its top and base, 5,041 to 5,048 ft, so the shoulder beds stay out of its mean. The rocks are taken as Tertiary, so Larionov's Tertiary transform is reported, against the workbook's 0.40 cutoff.
The four samples from 5,042 to 5,048 ft read 69.7, 59.9, 62.8 and 60.8 API, a mean of 63.3 API. The index is (63.3 − 30) / 85 = 0.392. Larionov's Tertiary transform reads 0.083 (2^1.450 − 1) = 0.144. The older-rock transform reads 0.238, Clavier 0.221 and Steiber 0.392 / 2.216 = 0.177. The reported 0.144 is within the 0.40 cutoff, and so is the linear 0.392, so both checks pass. The choice still matters over the whole log: at the 0.40 cutoff the linear index makes 54 ft of net sand and Larionov's Tertiary transform 74 ft, because the shoulder samples it reads as sand the index reads as shale. Eleven samples sit outside the picks and are clipped. Report the linear index and the zone's Vsh is 0.392, still within the cutoff. Tighten the cutoff to 0.30 and Larionov passes the zone while the linear index does not: the check warns. At a 0.10 cutoff even Larionov fails it. Pick the shale line at 60 API and the zone's mean is above it: the picks check fails.
Functions used
None: the blueprint calculates with Excel's own functions.
Names (32)
| Name | Refers to | Comment |
|---|---|---|
PO.PP.Vsh.GammaRayIndexLAMBDA |
=LAMBDA(GR, GR_cl, GR_sh, (GR-GR_cl)/(GR_sh-GR_cl)) |
Linear gamma-ray shale index, IGR = (GR - GRclean) / (GRshale - GRclean). |
PO.PP.Vsh.Larionov.TertiaryLAMBDA |
=LAMBDA(IGR, 0.083*(2^(3.7*IGR)-1)) |
Larionov (1969) shale volume for Tertiary rocks, from the gamma-ray index. |
PO.PP.Vsh.Larionov.OlderLAMBDA |
=LAMBDA(IGR, 0.33*(2^(2*IGR)-1)) |
Larionov (1969) shale volume for older consolidated rocks, from the gamma-ray index. |
PO.PP.Vsh.ClavierLAMBDA |
=LAMBDA(IGR, 1.7-SQRT(3.38-(IGR+0.7)^2)) |
Clavier et al. (1971) shale volume from the gamma-ray index, Vsh = 1.7 - sqrt(3.38 - (IGR + 0.7)^2). |
PO.PP.Vsh.SteiberLAMBDA |
=LAMBDA(IGR, IGR/(3-2*IGR)) |
Steiber (1970) shale volume from the gamma-ray index, Vsh = IGR / (3 - 2 IGR). |
VS_GRcl |
$B$4 |
Clean-sand gamma ray (Vsh = 0), read in the cleanest sand, API |
VS_GRsh |
$B$5 |
Shale gamma ray (Vsh = 1), read in a thick shale, API |
VS_ZTop |
$B$6 |
Zone top (the shaly sand, a foot inside its top), ft |
VS_ZBase |
$B$7 |
Zone base (a foot inside the bed's base), ft |
VS_Method |
$B$8 |
Transform reported (1 to 5, in the table's order below) |
VS_VshCut |
$B$9 |
Shale-volume cutoff for net sand, v/v |
VS_Inputs |
$B$4:$B$9 |
The clean-sand and shale gamma-ray picks, the zone's top and base, the transform reported and the net-sand cutoff |
VS_ZoneGR |
$B$13 |
Zone mean gamma ray, API |
VS_IGR |
$B$14 |
Linear gamma-ray index IGR, kept between 0 and 1, v/v |
VS_LarT |
$B$15 |
Larionov, Tertiary rocks, v/v |
VS_LarO |
$B$16 |
Larionov, older rocks, v/v |
VS_Clav |
$B$17 |
Clavier, v/v |
VS_Stb |
$B$18 |
Steiber, v/v |
VS_MethodWords |
$B$19 |
Transform reported |
VS_Vsh |
$B$20 |
Zone shale volume by that transform, v/v |
VS_Spread |
$B$21 |
Spread, linear less Larionov Tertiary, v/v |
VS_Step |
$B$22 |
Log sample spacing, ft |
VS_NetLin |
$B$23 |
Net sand over the interval, linear index, ft |
VS_Net |
$B$24 |
Net sand over the interval, transform reported, ft |
VS_Clipped |
$B$25 |
Log samples outside the picks (index clipped to 0 or 1) |
VS_PickCheck |
$B$26 |
Picks check verdict |
VS_PickCheckNote |
$C$26 |
Picks check comment |
VS_CutCheck |
$B$27 |
Net-sand check verdict |
VS_CutCheckNote |
$C$27 |
Net-sand check comment |
VS_Results |
$B$13:$B$27 |
The zone's mean gamma ray, its shale volume by each transform and by the one reported, the spread, the net sand by the linear index and by that transform, the clipped samples and the two checks |
VS_Methods |
$A$34:$D$38 |
Each transform's shale volume in the zone, its mean over the interval and the net sand it makes at the cutoff |
VS_Curve |
$A$43:$I$103 |
Each depth's gamma ray, the two picks, and the shale volume by the linear index and the four transforms |
Details
| Inserts | 103 rows × 9 columns |
| Category | Petrophysics |
| For agents and tools | Descriptor (.md) |