Gas Well Liquid Loading
Description
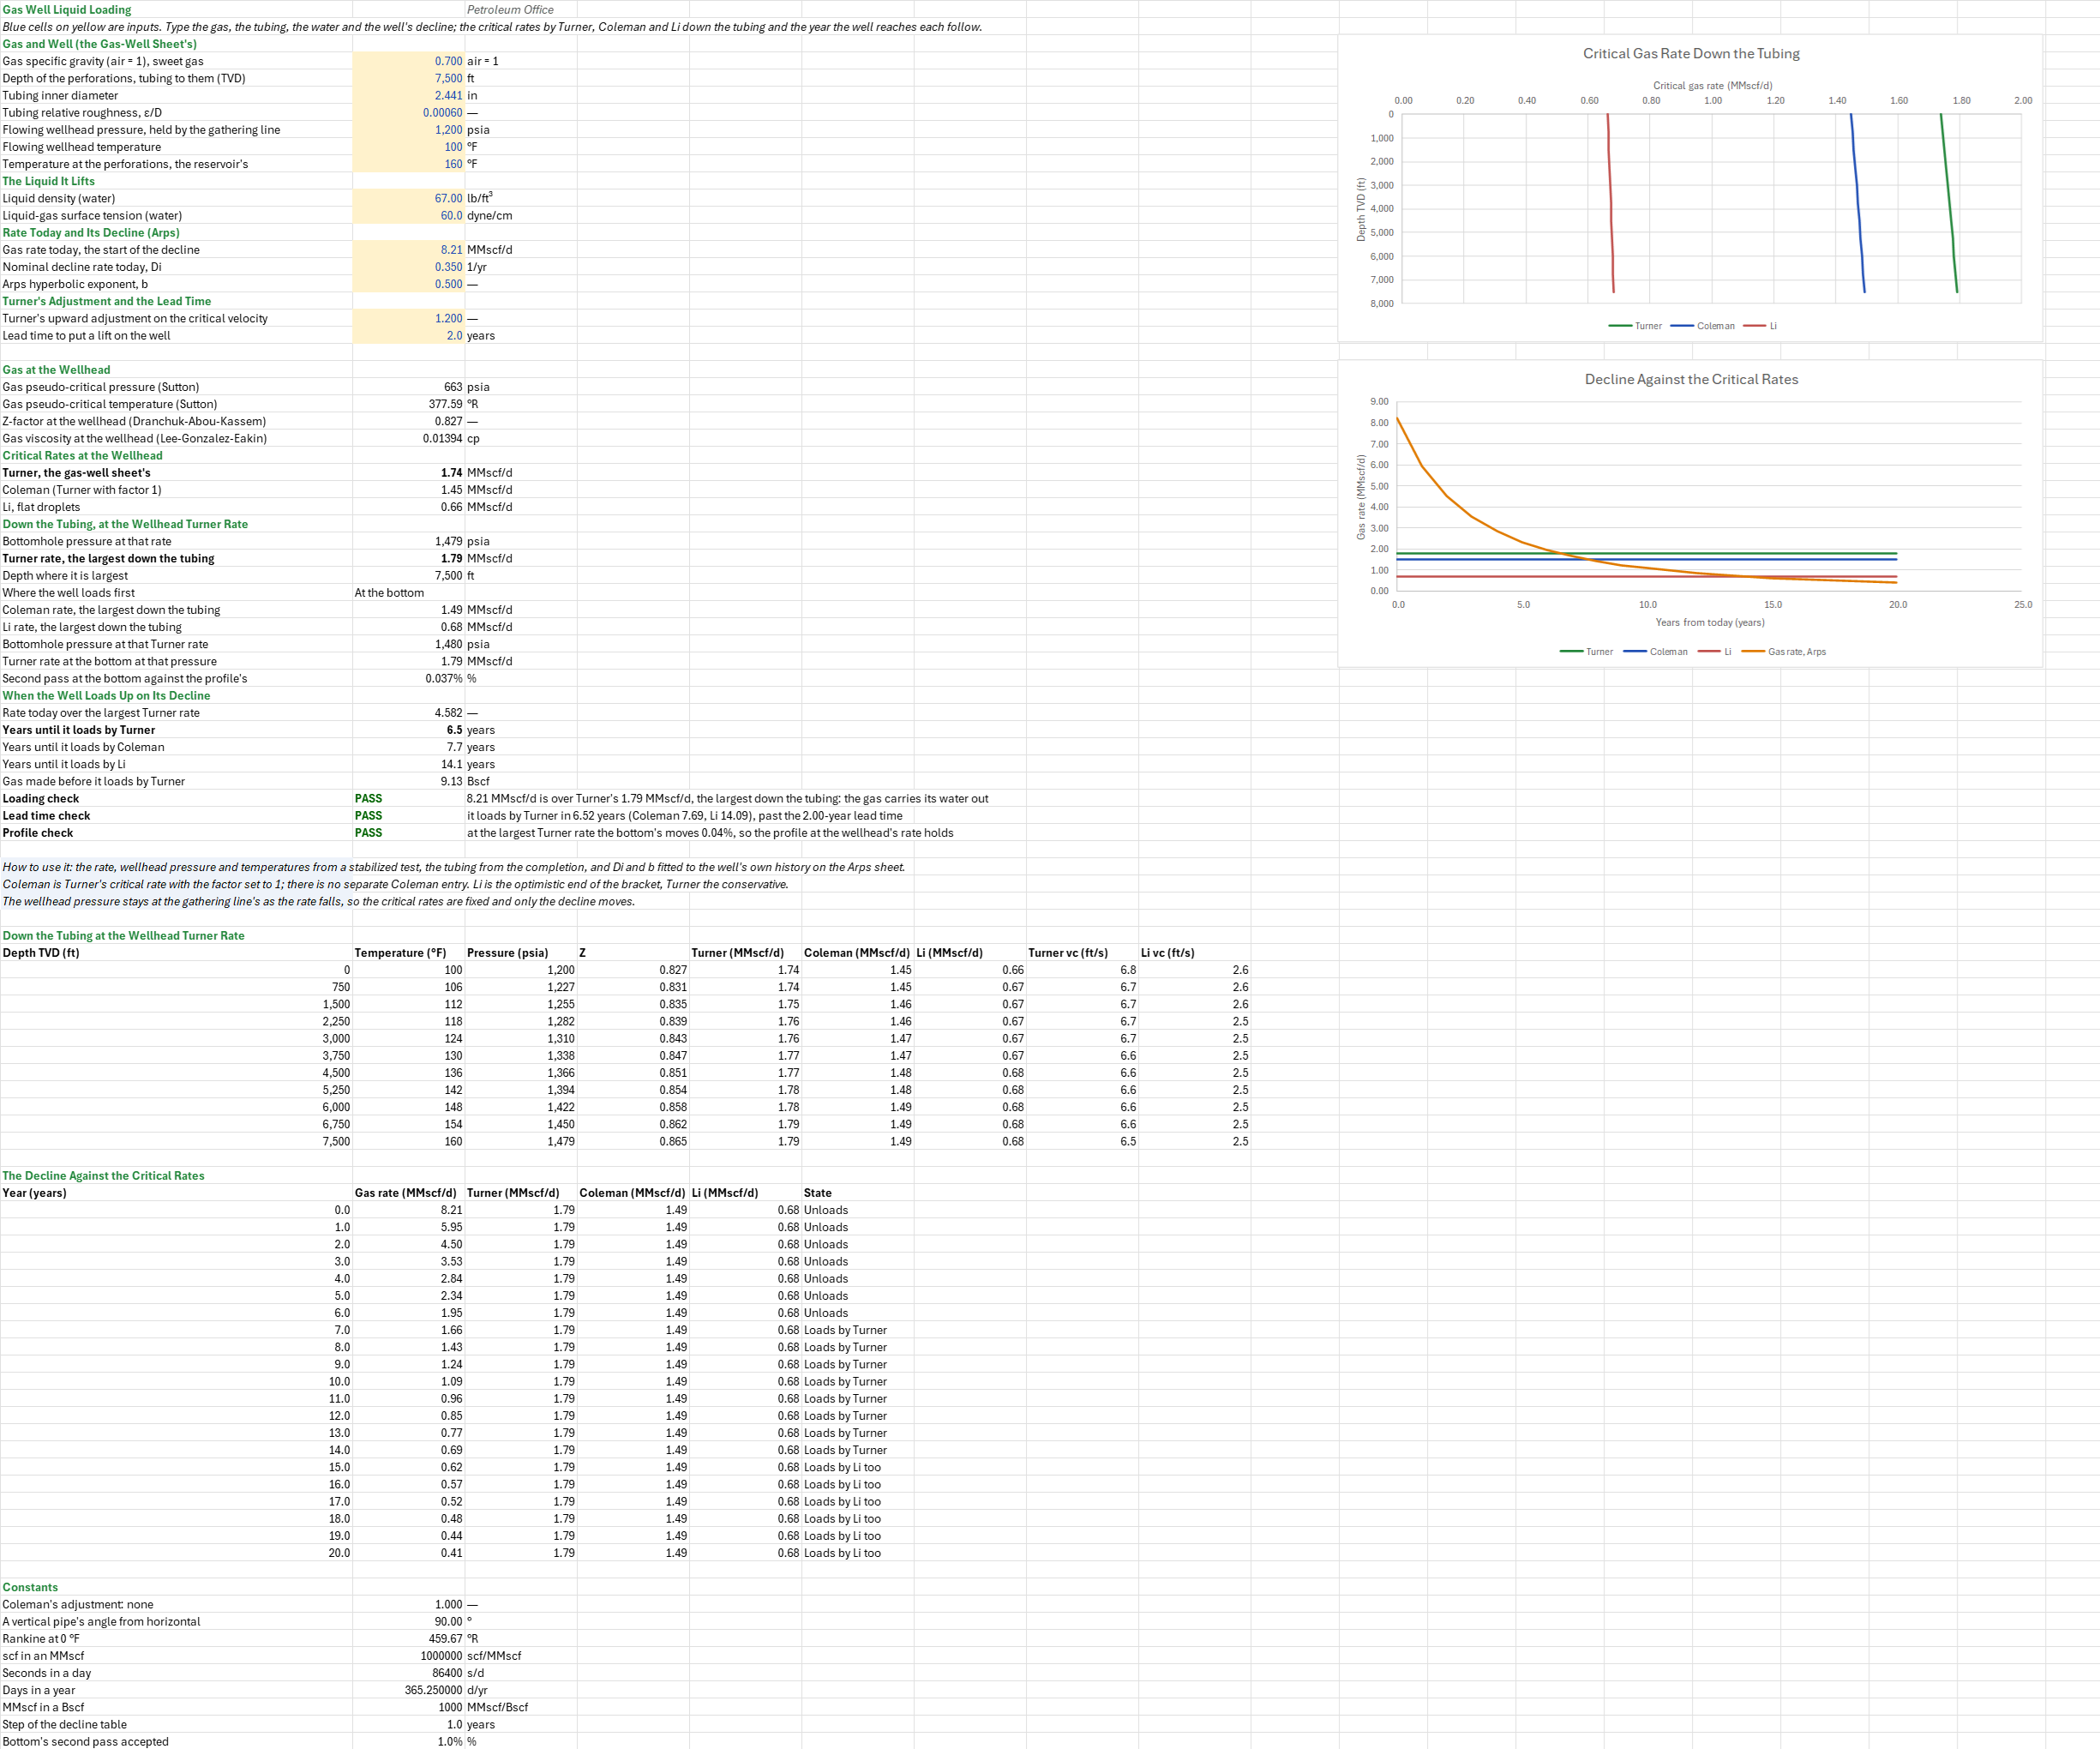
Where in the tubing does a gas well start to load with water, at what rate by each of the common droplet models, and in which year will its decline take it there? You enter the gas, the tubing, the wellhead pressure and temperatures, the liquid it lifts, today's rate and its Arps decline. You read off the Turner, Coleman and Li critical rates at the wellhead and down the tubing, where the well loads first, the years until it falls to each rate, and the gas it makes before it loads.
Parameters:
- Gas and well: the gas gravity
VLL_SGg(air = 1), the depth of the perforationsVLL_TVD(ft), the tubing's inner diameterVLL_ID(in) and relative roughnessVLL_Rough, the flowing wellhead pressureVLL_Pwh(psia), and the wellhead and bottomhole temperaturesVLL_TwhandVLL_Tbh(°F) - The liquid it lifts: its density
VLL_RhoL(lb/ft³) and surface tension against the gasVLL_IFT(dyne/cm) - Rate today and its decline: the gas rate
VLL_Qg(MMscf/d), the nominal declineVLL_Di(1/yr) and Arps's exponentVLL_b - Limits: Turner's upward adjustment
VLL_TurnerF(1.2) and the lead time to put a lift on the wellVLL_Lead(years)
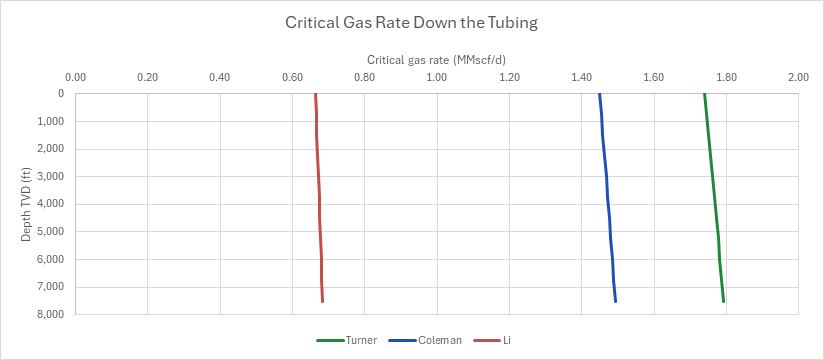
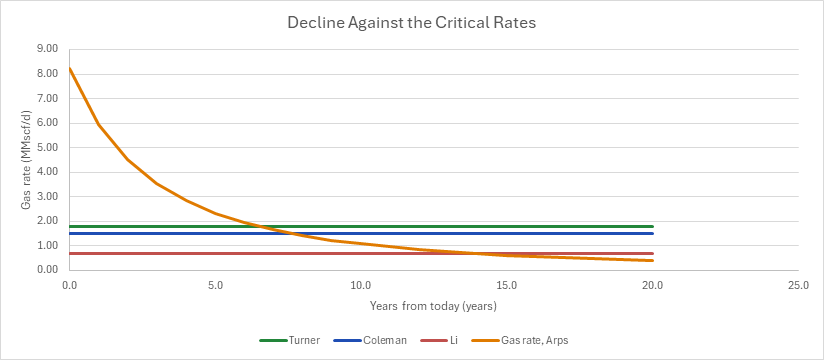
How to use it: Take the rate, wellhead pressure and temperatures from a stabilized test, the tubing from the completion, and Di and b from an Arps fit to the well's own rate history (the Arps Decline Forecast sheet). Take condensate's density and surface tension (45 lb/ft³, 20 dyne/cm) only when the well makes no water. The Gas Well Tubing Performance sheet reads Turner's critical rate at the wellhead; this sheet starts from that rate and sets Coleman's beside it, Turner's equation without the 20 % adjustment (the same LAMBDA with its factor set to 1; there is no separate Coleman entry), and Li's flat-droplet rate. It then follows the tubing down from the wellhead to the perforations in ten steps at the wellhead's Turner rate: the temperature, the pressure by the single-phase gas equation in two passes, Z, the three critical rates and Turner's and Li's critical velocities at each depth. The largest critical rate down the tubing decides when the well loads, and the sheet says where it is. A second pass at the bottom, at that larger rate, shows whether the profile at the wellhead's rate was close enough. The well's Arps decline from today's rate gives the years until it falls to each critical rate, and the gas it makes before it loads by Turner. Two charts draw the critical rates against depth and the decline against them. Three checks read the loading today, the time left against the lead time for a lift, and the profile's second pass.
Method: Turner's critical rate is qc = 3.06·p·vt·A/(T·Z) MMscf/d with vt = F·1.593·σ^¼·(ρL − ρg)^¼/ρg^½ ft/s, Z by Dranchuk-Abou-Kassem at Sutton's pseudo-criticals; F = 1.2 is Turner's, and F = 1 is Coleman's. Li's is the same with 0.72907 in place of F·1.593. Down the tubing the temperature is linear from the wellhead's to the bottom's. At each depth the pressure is the single-phase gas equation from the wellhead pressure over that length at the mean temperature, first with Z and μg at the wellhead, then at the mean of the wellhead pressure and the first pass (μg by Lee-Gonzalez-Eakin), at the wellhead Turner rate: the rate at which the wellhead would just load. The critical rates are read at each depth's pressure and temperature, and the critical velocity is the gas's in-situ velocity at that rate (Bg from Z). The largest of each column is the rate the well has to keep; at the larger rate the bottom's pressure moves, and the sheet's second pass there shows by how much. The decline is Arps's, q = qi/(1 + b·Di·t)^(1/b); the years to a critical rate qc are ((qi/qc)^b − 1)/(b·Di) (ln(qi/qc)/Di at b = 0), and the gas made to then is Arps's cumulative in MMscf/d·yr, times 365.25 d/yr.
Example: The default case is the Gas Well Tubing Performance sheet's: the gas-inflow family's reference well, a vertical gas well on 640 acres (re = 2,980 ft, rw = 0.354 ft) in 40 ft of 8 mD sand, perforated over its top 20 ft, producing a 0.7 gravity sweet gas from a 3,000 psia reservoir at 160 °F, with a skin of 2 from a buildup. It has 2-7/8-in tubing (2.441 in ID) completed to its perforations at 7,500 ft TVD (relative roughness 0.0006) and flows to 1,200 psia and 100 °F at the wellhead against the gathering line, making water (Turner's water: 67 lb/ft³, 60 dyne/cm). Today it makes the four-point test's third rate, 8,210 Mscf/d. Its decline is an assumption, stated, not fitted: Arps hyperbolic with b = 0.5, the exponent Fetkovich et al. (1996) give for a gas well in boundary-dominated flow against a low backpressure, and a nominal 0.35 a year. A lift takes two years to put on the well. At the wellhead's 1,200 psia and 100 °F, Z = 0.8271 and Turner's rate is 1.739 MMscf/d, the gas-well sheet's; Coleman's is 1.739/1.2 = 1.449 and Li's 1.449 × 0.72907/1.593 = 0.663. At 1.739 MMscf/d the gas column is nearly static: the pressure rises to 1,479.0 psia at 7,500 ft, where the gas at 160 °F is denser (Z = 0.8653), and Turner's rate there is 1.792 MMscf/d, 3.0 % above the wellhead's. So the well loads first at the bottom. Coleman's largest is 1.493 and Li's 0.683, also at the bottom. Turner's critical velocity falls from 6.76 ft/s at the wellhead to 6.54 at the bottom. At 1.792 MMscf/d the bottom's pressure is 1,480.1 psia and its Turner rate moves 0.04 %, so the profile holds. Today's 8.21 MMscf/d is 4.58 times that rate. On the decline it falls to 1.792 MMscf/d in ((8.21/1.792)^0.5 − 1)/(0.5 × 0.35) = 6.52 years, to Coleman's in 7.69 and to Li's in 14.09, after 9.13 Bscf: the well has six and a half years before it needs a lift, more than the two-year lead time.
Functions used
PO.PVT.Ppc.BySutton(SG_gas)
Calculates pseudo-critical pressure of hydrocarbon gas using Sutton (1985) correlation, [psi].
PO.PVT.Tpc.BySutton(SG_gas)
Calculates pseudo-critical temperature of hydrocarbon gas using Sutton (1985) correlation, [degR].
PO.PVT.Z.ByDAK(Ppr, Tpr)
Calculates gas compressibility factor (Z) using Dranchuk and Abou-Kassem (1975) equation of state, [dimensionless].
PO.PVT.Ug.ByLGE(Z, SG_gas, P, T_degR)
Calculates gas viscosity using Lee, Gonzales and Eakin (1966) correlation, [cP].
PO.VFP.Gas.Pin(Qg, P_out, T_degF, SG_gas, Ug, Z, pipe_ID, pipe_length, pipe_roughness, pipe_angle)
Calculates inlet pipe pressure for single phase pipe flow of gas (compressible fluid), [psi].
PO.DCA.Arps.Time(Qi, Di, b, Q_econ)
Time to reach an economic rate limit for Arps decline, {T}. Returns the time when the production rate falls to the specified economic limit.
PO.DCA.Arps.Prod(Qi, Di, b, time)
Calculates cumulative production using Arps (1945) decline curve, {L3}. Units of volume {L3} and time {T} must be consistent. Use b=0 for exponential, 0<b<1 for hyperbolic, b=1 for harmonic.
PO.FA.Erosion.Vmix(Qg, QL, ID)
Calculates mixture velocity in pipe, [ft/s].
PO.PVT.Bg.ByDefinition(P, T_degR, Z)
Calculates gas formation volume factor, [rcf/scf].
PO.DCA.Arps.Rate(Qi, Di, b, time)
Calculates rate using Arps (1945) decline curve, {L3/T}. Units of volume {L3} and time {T} must be consistent. Use b=0 for exponential, 0<b<1 for hyperbolic, b=1 for harmonic.
PO.PVT.Rho.Gas.ByDefinition(P, T_degR, SG_gas, Z)
Calculates gas density, [g/cm3].
Names (56)
| Name | Refers to | Comment |
|---|---|---|
PO.PE.Loading.TurnerRateLAMBDA |
=LAMBDA(p, t, sg_g, tubing_id, sigma, rho_l, factor, IF(OR(p<=0, t<=-459.67, sg_g<=0, tubing_id<=0, sigma<=0, rho_l<=0, factor<=0), NA(), LET(tr, t+459.67, z, PO.PVT.Z.ByDAK(p/PO.PVT.Ppc.BySutton(sg_g), tr/PO.PVT.Tpc.BySutton(sg_g)), rho_g, PO.PVT.Rho.Gas.ByDefinition(p, tr, sg_g, z)*62.428, IF(rho_l<=rho_g, NA(), 3.06*p*factor*1.593*sigma^0.25*(rho_l-rho_g)^0.25/rho_g^0.5*PI()*tubing_id^2/576/(tr*z))))) |
Turner critical gas rate to unload liquid, MMscf/d: p (psia) and t (°F) where it is read, usually the wellhead, gas gravity sg_g, tubing_id (in), the liquid's sigma (dyne/cm) and rho_l (lb/ft³), and factor (1.2 Turner, 1 Coleman). |
PO.PE.Loading.LiRateLAMBDA |
=LAMBDA(p_psia, t_degF, sg_gas, tubingID_in, sigma_dyncm, rhoL_lbft3, IF(OR(p_psia<=0, t_degF<=-459.67, sg_gas<=0, tubingID_in<=0, sigma_dyncm<=0, rhoL_lbft3<=0), NA(), LET(tr, t_degF+459.67, z, PO.PVT.Z.ByDAK(p_psia/PO.PVT.Ppc.BySutton(sg_gas), tr/PO.PVT.Tpc.BySutton(sg_gas)), rho_g, PO.PVT.Rho.Gas.ByDefinition(p_psia, tr, sg_gas, z)*62.428, IF(rhoL_lbft3<=rho_g, NA(), 3.06*p_psia*0.72907*sigma_dyncm^0.25*(rhoL_lbft3-rho_g)^0.25/rho_g^0.5*PI()*tubingID_in^2/576/(tr*z))))) |
Li critical gas rate to unload liquid (flat-droplet model), MMscf/d: p_psia and t_degF where it is read, gas gravity sg_gas, tubingID_in, the liquid's sigma_dyncm and rhoL_lbft3. Same order as PO.PE.Loading.TurnerRate. |
VLL_SGg |
$B$4 |
Gas specific gravity (air = 1), sweet gas, air = 1 |
VLL_TVD |
$B$5 |
Depth of the perforations, tubing to them (TVD), ft |
VLL_ID |
$B$6 |
Tubing inner diameter, in |
VLL_Rough |
$B$7 |
Tubing relative roughness, ε/D |
VLL_Pwh |
$B$8 |
Flowing wellhead pressure, held by the gathering line, psia |
VLL_Twh |
$B$9 |
Flowing wellhead temperature, °F |
VLL_Tbh |
$B$10 |
Temperature at the perforations, the reservoir's, °F |
VLL_RhoL |
$B$12 |
Liquid density (water), lb/ft³ |
VLL_IFT |
$B$13 |
Liquid-gas surface tension (water), dyne/cm |
VLL_Qg |
$B$15 |
Gas rate today, the start of the decline, MMscf/d |
VLL_Di |
$B$16 |
Nominal decline rate today, Di, 1/yr |
VLL_b |
$B$17 |
Arps hyperbolic exponent, b |
VLL_TurnerF |
$B$19 |
Turner's upward adjustment on the critical velocity |
VLL_Lead |
$B$20 |
Lead time to put a lift on the well, years |
VLL_Inputs |
$B$4:$B$20 |
The gas gravity, the tubing, the wellhead pressure and temperatures, the liquid's density and surface tension, the rate today, its Arps decline, Turner's adjustment and the lead time for a lift |
VLL_Ppc |
$B$23 |
Gas pseudo-critical pressure (Sutton), psia |
VLL_Tpc |
$B$24 |
Gas pseudo-critical temperature (Sutton), °R |
VLL_Zwh |
$B$25 |
Z-factor at the wellhead (Dranchuk-Abou-Kassem) |
VLL_Ugwh |
$B$26 |
Gas viscosity at the wellhead (Lee-Gonzalez-Eakin), cp |
VLL_QcWh |
$B$28 |
Turner, the gas-well sheet's, MMscf/d |
VLL_QcWhC |
$B$29 |
Coleman (Turner with factor 1), MMscf/d |
VLL_QcWhLi |
$B$30 |
Li, flat droplets, MMscf/d |
VLL_Pbh |
$B$32 |
Bottomhole pressure at that rate, psia |
VLL_QcT |
$B$33 |
Turner rate, the largest down the tubing, MMscf/d |
VLL_ZGov |
$B$34 |
Depth where it is largest, ft |
VLL_Where |
$B$35 |
Where the well loads first |
VLL_QcC |
$B$36 |
Coleman rate, the largest down the tubing, MMscf/d |
VLL_QcLi |
$B$37 |
Li rate, the largest down the tubing, MMscf/d |
VLL_PbhGov |
$B$38 |
Bottomhole pressure at that Turner rate, psia |
VLL_QcBh2 |
$B$39 |
Turner rate at the bottom at that pressure, MMscf/d |
VLL_PassErr |
$B$40 |
Second pass at the bottom against the profile's, % |
VLL_QRatio |
$B$42 |
Rate today over the largest Turner rate |
VLL_tT |
$B$43 |
Years until it loads by Turner, years |
VLL_tC |
$B$44 |
Years until it loads by Coleman, years |
VLL_tLi |
$B$45 |
Years until it loads by Li, years |
VLL_GpT |
$B$46 |
Gas made before it loads by Turner, Bscf |
VLL_LoadCheck |
$B$47 |
Loading check verdict |
VLL_LoadCheckNote |
$C$47 |
Loading check comment |
VLL_LeadCheck |
$B$48 |
Lead time check verdict |
VLL_LeadCheckNote |
$C$48 |
Lead time check comment |
VLL_PassCheck |
$B$49 |
Profile check verdict |
VLL_PassCheckNote |
$C$49 |
Profile check comment |
VLL_Results |
$B$23:$B$49 |
The gas at the wellhead, Turner's, Coleman's and Li's critical rates there and the largest of each down the tubing, the bottom's second pass, the years until the decline reaches each, the gas made before it loads, and the three checks |
VLL_Profile |
$A$57:$I$67 |
Ten steps from the wellhead to the perforations at the wellhead Turner rate: the temperature, the pressure in two passes, Z, Turner's, Coleman's and Li's critical rates, and Turner's and Li's critical velocities |
VLL_Decline |
$A$71:$F$91 |
Twenty years of the Arps decline from today's rate against the largest Turner, Coleman and Li rates down the tubing, and whether the well unloads |
VLL_Coleman |
$B$94 |
Coleman's adjustment: none |
VLL_Vert |
$B$95 |
A vertical pipe's angle from horizontal, ° |
VLL_R0 |
$B$96 |
Rankine at 0 °F, °R |
VLL_Scf |
$B$97 |
scf in an MMscf, scf/MMscf |
VLL_Sec |
$B$98 |
Seconds in a day, s/d |
VLL_DaysYr |
$B$99 |
Days in a year, d/yr |
VLL_MMB |
$B$100 |
MMscf in a Bscf, MMscf/Bscf |
VLL_Step |
$B$101 |
Step of the decline table, years |
VLL_PassTol |
$B$102 |
Bottom's second pass accepted, % |
Details
| Inserts | 102 rows × 9 columns |
| Category | Vertical Flow Performance |
| For agents and tools | Descriptor (.md) |