PVT Correlation Match Against the Lab
Description
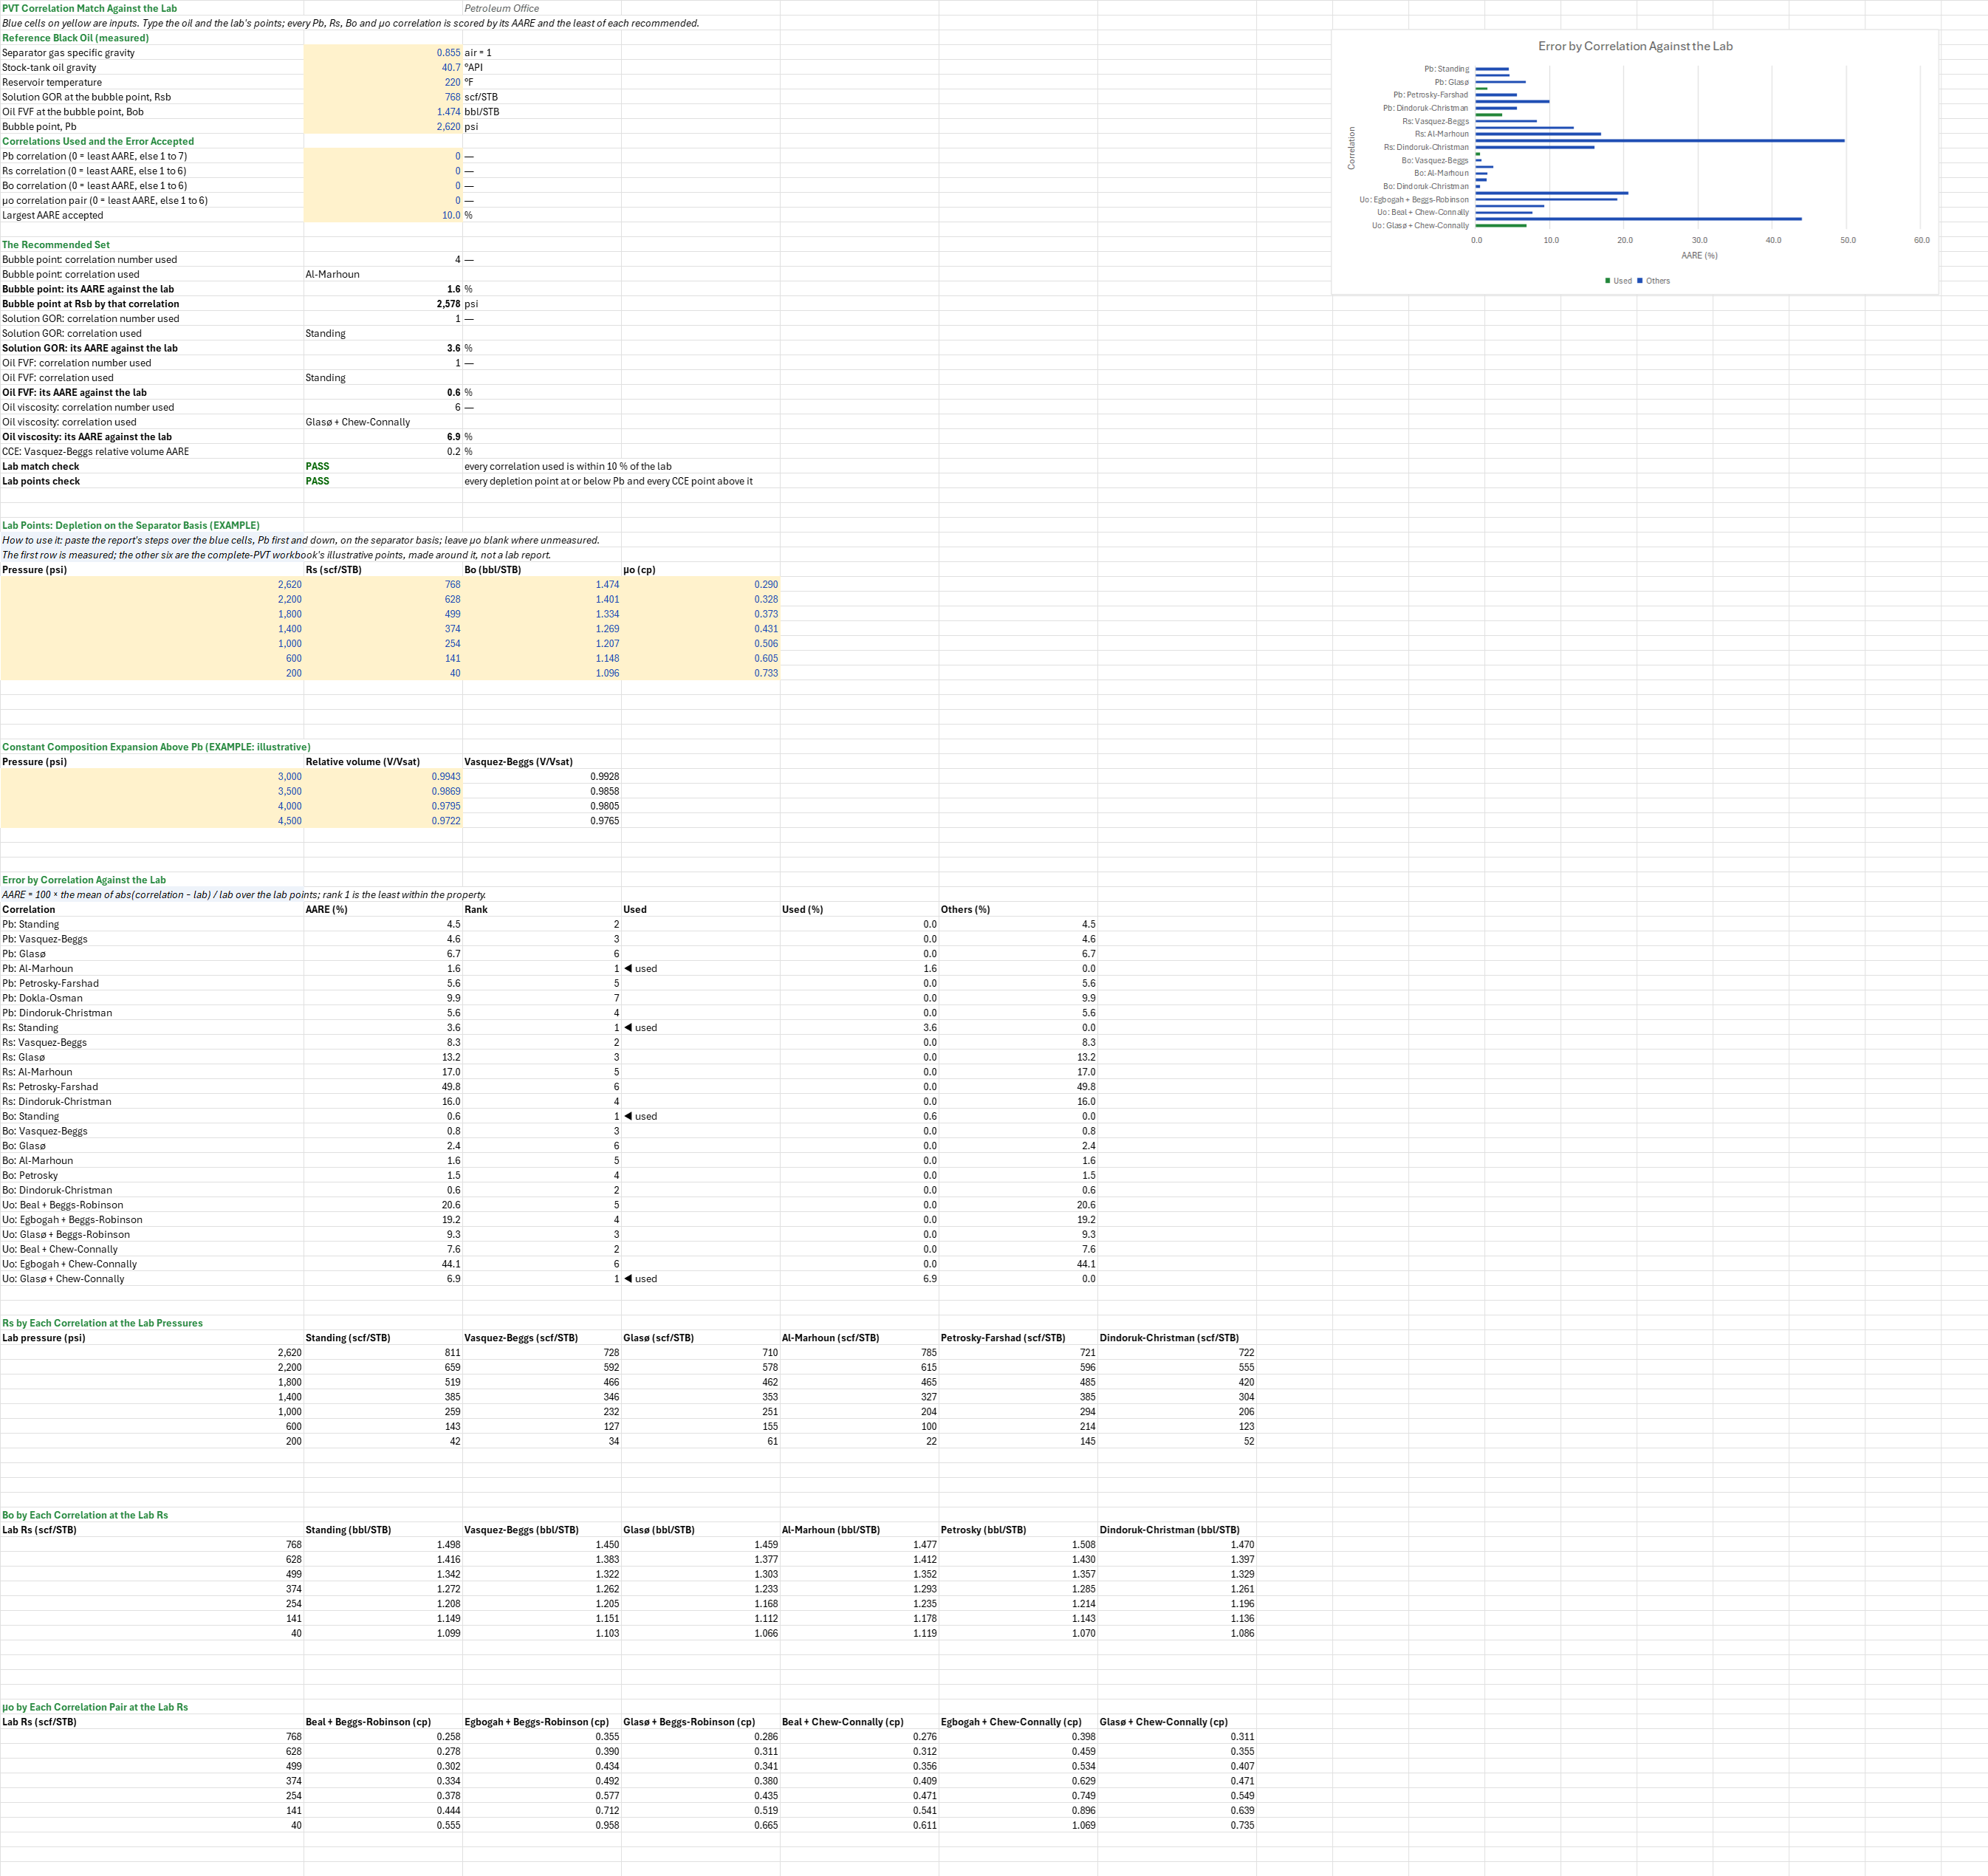
Which black-oil correlations describe this oil? You enter the oil's measured gravities, temperature, Rsb, Bob and bubble point, the lab's depletion points and its CCE above the bubble point. The sheet scores every bubble-point, solution-GOR, oil-FVF and oil-viscosity correlation against the lab by its average absolute relative error (AARE). You read off each correlation's AARE and rank, and the one recommended for each property: the least AARE, unless you type a number to use another.
Parameters:
- The oil (measured): separator gas gravity
PCM_SGg, stock-tank gravityPCM_API, reservoir temperaturePCM_T, RsbPCM_Rsb, BobPCM_LabBoband the bubble pointPCM_LabPb - Correlations used:
PCM_PbUse(1 to 7),PCM_RsUse,PCM_BoUseandPCM_UoUse(1 to 6), each 0 for the least AARE; and the largest AARE acceptedPCM_AareMax - Lab points: the depletion table on the separator basis (
PCM_LabP,PCM_LabRs,PCM_LabBo,PCM_LabUo, ten rows) and the CCE above Pb (PCM_CceP,PCM_CceV, six rows)
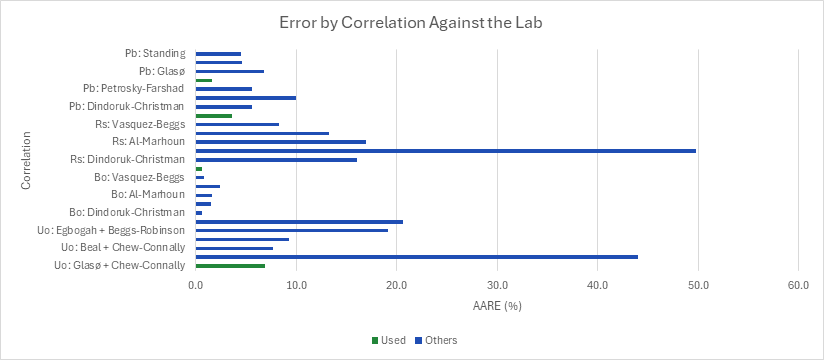
How to use it: Paste the report's depletion steps on the separator basis (convert a DL's Bod and Rsd first; the PVT Lab Report QC sheet does) and its CCE points above Pb over the blue cells, Pb first and down, and leave μo blank where it wasn't measured. Use the separator test's gas gravity and Rsb and the CCE's bubble point. A chart shows every correlation's error, the ones used set apart. The sheet is the Complete PVT Study workbook's Correlation Match sheet on one sheet; the Black-Oil Simulator Tables sheet takes its picks.
Method:
- Correlations, in the order the numbers pick them: bubble point by Standing, Vasquez-Beggs, Glasø, Al-Marhoun, Petrosky-Farshad, Dokla-Osman and Dindoruk-Christman; Rs by the same less Dokla-Osman; Bo by Standing, Vasquez-Beggs, Glasø, Al-Marhoun, Petrosky and Dindoruk-Christman; and μo by six pairs of a dead-oil correlation (Beal, Egbogah, Glasø) and a live-oil one (Beggs-Robinson, Chew-Connally), Beggs-Robinson's three first.
- AARE. 100 × (1/n) Σ |xcorr − xlab| / xlab over the n lab points that have a value; blanks are skipped.
- Grids. The bubble point is scored at the lab's Rsb against the measured Pb, one point per correlation. Each Rs correlation is scored at each depletion pressure against the measured Rs. Each Bo correlation and each μo pair is scored at each depletion point's measured Rs against the measured Bo and μo, so neither carries the Rs correlation's error.
- Pick. The least AARE of each property, or the correlation typed by number; its name, AARE and, for Pb, the bubble point it gives at Rsb.
- CCE. Vasquez-Beggs' undersaturated compressibility Co at Rsb integrated from the lab Pb, as the relative volume Bo/Bob, against each CCE point above Pb.
- Checks.
- Lab match: a FAIL for a correlation number outside its list, a WARN when a correlation used misses the lab by more than the largest AARE accepted.
- Lab points: every depletion point at or below Pb and every CCE point above it (a FAIL otherwise), and no Rs or Bo above its bubble-point value.
Example: The example is the PVT family's reference black oil, Ahmed's oil 2: 40.7 °API, a 0.855 gravity separator gas (100 psig, 75 °F), 220 °F, Rsb 768 scf/STB, a measured bubble point of 2,620 psi and Bob of 1.474 bbl/STB. Those are measured. The other six depletion points, the viscosities and the four CCE points are the Complete PVT Study workbook's illustrative example, made around them and not a lab report: Rs on a power law through the bubble point, Rsb (p/Pb)^1.15; Bo linear in Rs from 1.075 at Rs = 0 to Bob; μo with its fluidity linear in Rs from 0.80 cp dead to 0.29 cp at Pb; and the relative volume at a constant 15 × 10⁻⁶ 1/psi.
Al-Marhoun's bubble point is the closest, 2,578 psi against the lab's 2,620 (AARE 1.60 %), ahead of Standing (4.47 %) and Vasquez-Beggs (4.58 %), with Dokla-Osman the farthest (9.93 %). Standing is the best Rs (3.56 %, Petrosky-Farshad the worst at 49.8 %) and the best Bo (0.57 %, Dindoruk-Christman next at 0.63 %). Glasø's dead oil with Chew-Connally is the best viscosity pair (6.87 %), Beal with Beggs-Robinson 20.6 %. Vasquez-Beggs misses the CCE by 0.20 %. Every correlation used is within 10 %. Typing 2,500 psi for the lab bubble point moves the pick to Standing (2,502.9 psi, 0.12 %), and the lab points check fails, since the 2,620 psi depletion point is now above Pb. Typing 1 for Pb and 1 for μo uses Standing (4.47 %) and Beal with Beggs-Robinson (20.6 %), and the match check warns.
Functions used
PO.PVT.Pb.ByStanding(SG_gas, API, Rs, T_degF)
Calculates oil bubble point pressure using Standing (1947) correlation, [psi].
PO.PVT.Pb.ByVasquezBeggs(SG_gas, API, Rs, T_degF)
Calculates oil bubble point pressure using Vasquez and Beggs (1980) correlation, [psi].
PO.PVT.Pb.ByGlaso(SG_gas, API, Rs, T_degF)
Calculates oil bubble point pressure using Glaso (1980) correlation, [psi].
PO.PVT.Pb.ByAlMarhoun(SG_gas, API, Rs, T_degF)
Calculates oil bubble point pressure using Al-Marhoun (1988) correlation, [psi].
PO.PVT.Pb.ByPetroskyFarshad(SG_gas, API, Rs, T_degF)
Calculates oil bubble point pressure using Petrosky and Farshad (1990) correlation, [psi].
PO.PVT.Pb.ByDoklaOsman(SG_gas, API, Rs, T_degF)
Calculates oil bubble point pressure using Dokla and Osman (1992) correlation, [psi].
PO.PVT.Pb.ByDindorukChristman(SG_gas, API, Rs, T_degF)
Calculates oil bubble point pressure using Dindoruk and Christman (2001) correlation, [psi].
PO.PVT.Bo.UnSat.ByDefinition(Bob, Co, Pb, P)
Calculates oil formation volume factor for undersaturated oil, P > Pb, [bbl/STB].
PO.PVT.Co.UnSat.ByVasquezBeggs(Rsb, SG_gas, API, T_degF, P)
Calculates oil compressibility using Vasquez and Beggs (1980) correlation, P > Pb, [1/psi].
PO.PVT.Rs.ByStanding(SG_gas, API, P, T_degF)
Calculates solution gas-oil ratio using Standing correlation (1947), the exact inverse of Standing Pb, P <= Pb, [SCF/STB].
PO.PVT.Rs.ByVasquezBeggs(SG_gas, API, P, T_degF)
Calculates solution gas-oil ratio using Vasquez and Beggs (1980) correlation, P <= Pb, [SCF/STB].
PO.PVT.Rs.ByGlaso(SG_gas, API, P, T_degF)
Calculates solution gas-oil ratio using Glaso (1980) correlation, P <= Pb, [SCF/STB].
PO.PVT.Rs.ByAlMarhoun(SG_gas, API, P, T_degF)
Calculates solution gas-oil ratio using Al-Marhoun (1988) correlation, P <= Pb, [SCF/STB].
PO.PVT.Rs.ByPetroskyFarshad(SG_gas, API, P, T_degF)
Calculates solution gas-oil ratio using Petrosky and Farshad (1993) correlation, P <= Pb, [SCF/STB].
PO.PVT.Rs.ByDindorukChristman(SG_gas, API, P, T_degF)
Calculates solution gas-oil ratio using Dindoruk and Christman (2001) correlation, P <= Pb, [SCF/STB].
PO.PVT.Bo.Sat.ByStanding(SG_gas, API, Rs, T_degF)
Calculates oil formation volume factor using Standing (1947) correlation, P <= Pb, [bbl/STB].
PO.PVT.Bo.Sat.ByVasquezBeggs(SG_gas, API, Rs, T_degF)
Calculates oil formation volume factor using Vasquez and Beggs (1980) correlation, P <= Pb, [bbl/STB].
PO.PVT.Bo.Sat.ByGlaso(SG_gas, API, Rs, T_degF)
Calculates oil formation volume factor using Glaso (1980) correlation, P <= Pb, [bbl/STB].
PO.PVT.Bo.Sat.ByAlMarhoun(SG_gas, API, Rs, T_degF)
Calculates oil formation volume factor using Al-Marhoun (1988) correlation, P <= Pb, [bbl/STB].
PO.PVT.Bo.Sat.ByPetrosky(SG_gas, API, Rs, T_degF)
Calculates oil formation volume factor using Petrosky (1990) correlation, P <= Pb, [bbl/STB].
PO.PVT.Bo.Sat.ByDindorukChristman(SG_gas, API, Rs, T_degF)
Calculates oil formation volume factor using Dindoruk and Christman (2001) correlation, P <= Pb, [bbl/STB].
PO.PVT.Uo.Sat.ByBeggsRobinson(Rs, Uo_dead)
Calculates oil viscosity with solution gas using Beggs and Robinson (1975) correlation, P <= Pb, [cP].
PO.PVT.Uo.Dead.ByBeal(API, T_degF)
Calculates dead oil viscosity using Beal (1946) correlation. Standing's curve fit of Beal's graphical correlation. Best performer per Fotias (2022), [cP].
PO.PVT.Uo.Dead.ByEgbogah(API, T_degF)
Calculates dead oil viscosity using Egbogah (1983) correlation, [cP].
PO.PVT.Uo.Dead.ByGlaso(API, T_degF)
Calculates dead oil viscosity using Glaso (1980) correlation. Developed for North Sea crude oils, [cP].
PO.PVT.Uo.Sat.ByChewConnally(Rs, Uo_dead)
Calculates oil viscosity with solution gas using Chew and Connally (1959) correlation, P <= Pb, [cP].
Names (48)
| Name | Refers to | Comment |
|---|---|---|
PO.Stats.AARELAMBDA |
=LAMBDA(observed, computed, LET(use, ISNUMBER(observed) * ISNUMBER(computed) * (IFERROR(observed, 0) <> 0), k, SUM(use), IF(k = 0, NA(), 100 * SUM(use * IFERROR(ABS((computed - observed) / observed), 0)) / k))) |
Average absolute relative error, in percent, of computed values against observed ones: 100 x mean of abs(computed - observed) / abs(observed) over the pairs where both are numbers and observed is not 0. |
PCM_SGg |
$B$4 |
Separator gas specific gravity, air = 1 |
PCM_API |
$B$5 |
Stock-tank oil gravity, °API |
PCM_T |
$B$6 |
Reservoir temperature, °F |
PCM_Rsb |
$B$7 |
Solution GOR at the bubble point, Rsb, scf/STB |
PCM_LabBob |
$B$8 |
Oil FVF at the bubble point, Bob, bbl/STB |
PCM_LabPb |
$B$9 |
Bubble point, Pb, psi |
PCM_PbUse |
$B$11 |
Pb correlation (0 = least AARE, else 1 to 7) |
PCM_RsUse |
$B$12 |
Rs correlation (0 = least AARE, else 1 to 6) |
PCM_BoUse |
$B$13 |
Bo correlation (0 = least AARE, else 1 to 6) |
PCM_UoUse |
$B$14 |
μo correlation pair (0 = least AARE, else 1 to 6) |
PCM_AareMax |
$B$15 |
Largest AARE accepted, % |
PCM_Inputs |
$B$4:$B$15 |
The oil's gas and stock-tank gravities, temperature, Rsb, Bob and bubble point, the correlation used for Pb, Rs, Bo and μo (0 for the least AARE), and the largest AARE accepted |
PCM_LabP |
$A$40:$A$49 |
Lab depletion pressures, psi |
PCM_LabRs |
$B$40:$B$49 |
Lab Rs, scf/STB |
PCM_LabBo |
$C$40:$C$49 |
Lab Bo, bbl/STB |
PCM_LabUo |
$D$40:$D$49 |
Lab μo, cp |
PCM_CceP |
$A$53:$A$58 |
CCE pressures, psi |
PCM_CceV |
$B$53:$B$58 |
CCE relative volume, V/Vsat |
PCM_CceCalc |
$C$53:$C$58 |
Vasquez-Beggs relative volume, V/Vsat |
PCM_PbSet |
$B$18 |
Bubble point: correlation number used |
PCM_PbName |
$B$19 |
Bubble point: correlation used |
PCM_PbErr |
$B$20 |
Bubble point: its AARE against the lab, % |
PCM_PbCalc |
$B$21 |
Bubble point at Rsb by that correlation, psi |
PCM_RsSet |
$B$22 |
Solution GOR: correlation number used |
PCM_RsName |
$B$23 |
Solution GOR: correlation used |
PCM_RsErr |
$B$24 |
Solution GOR: its AARE against the lab, % |
PCM_BoSet |
$B$25 |
Oil FVF: correlation number used |
PCM_BoName |
$B$26 |
Oil FVF: correlation used |
PCM_BoErr |
$B$27 |
Oil FVF: its AARE against the lab, % |
PCM_UoSet |
$B$28 |
Oil viscosity: correlation number used |
PCM_UoName |
$B$29 |
Oil viscosity: correlation used |
PCM_UoErr |
$B$30 |
Oil viscosity: its AARE against the lab, % |
PCM_CceErr |
$B$31 |
CCE: Vasquez-Beggs relative volume AARE, % |
PCM_MatchCheck |
$B$32 |
Lab match check verdict |
PCM_MatchCheckNote |
$C$32 |
Lab match check comment |
PCM_LabCheck |
$B$33 |
Lab points check verdict |
PCM_LabCheckNote |
$C$33 |
Lab points check comment |
PCM_Results |
$B$18:$B$33 |
For Pb, Rs, Bo and μo: the correlation number used, its name and its AARE, and the bubble point it gives at Rsb; the Vasquez-Beggs CCE error; the lab match and lab points checks |
PCM_Curve |
$A$63:$F$87 |
Each correlation's AARE against the lab, its rank within the property, and whether it is used, split for the chart |
PCM_PbAare |
$B$63:$B$69 |
Pb correlations' AARE, % |
PCM_PbNames |
$A$63:$A$69 |
Pb correlations, in table order |
PCM_RsAare |
$B$70:$B$75 |
Rs correlations' AARE, % |
PCM_RsNames |
$A$70:$A$75 |
Rs correlations, in table order |
PCM_BoAare |
$B$76:$B$81 |
Bo correlations' AARE, % |
PCM_BoNames |
$A$76:$A$81 |
Bo correlations, in table order |
PCM_UoAare |
$B$82:$B$87 |
Uo correlations' AARE, % |
PCM_UoNames |
$A$82:$A$87 |
Uo correlations, in table order |
Details
| Inserts | 127 rows × 7 columns |
| Category | PVT Properties |
| For agents and tools | Descriptor (.md) |