Black-Oil Simulator Tables
Description
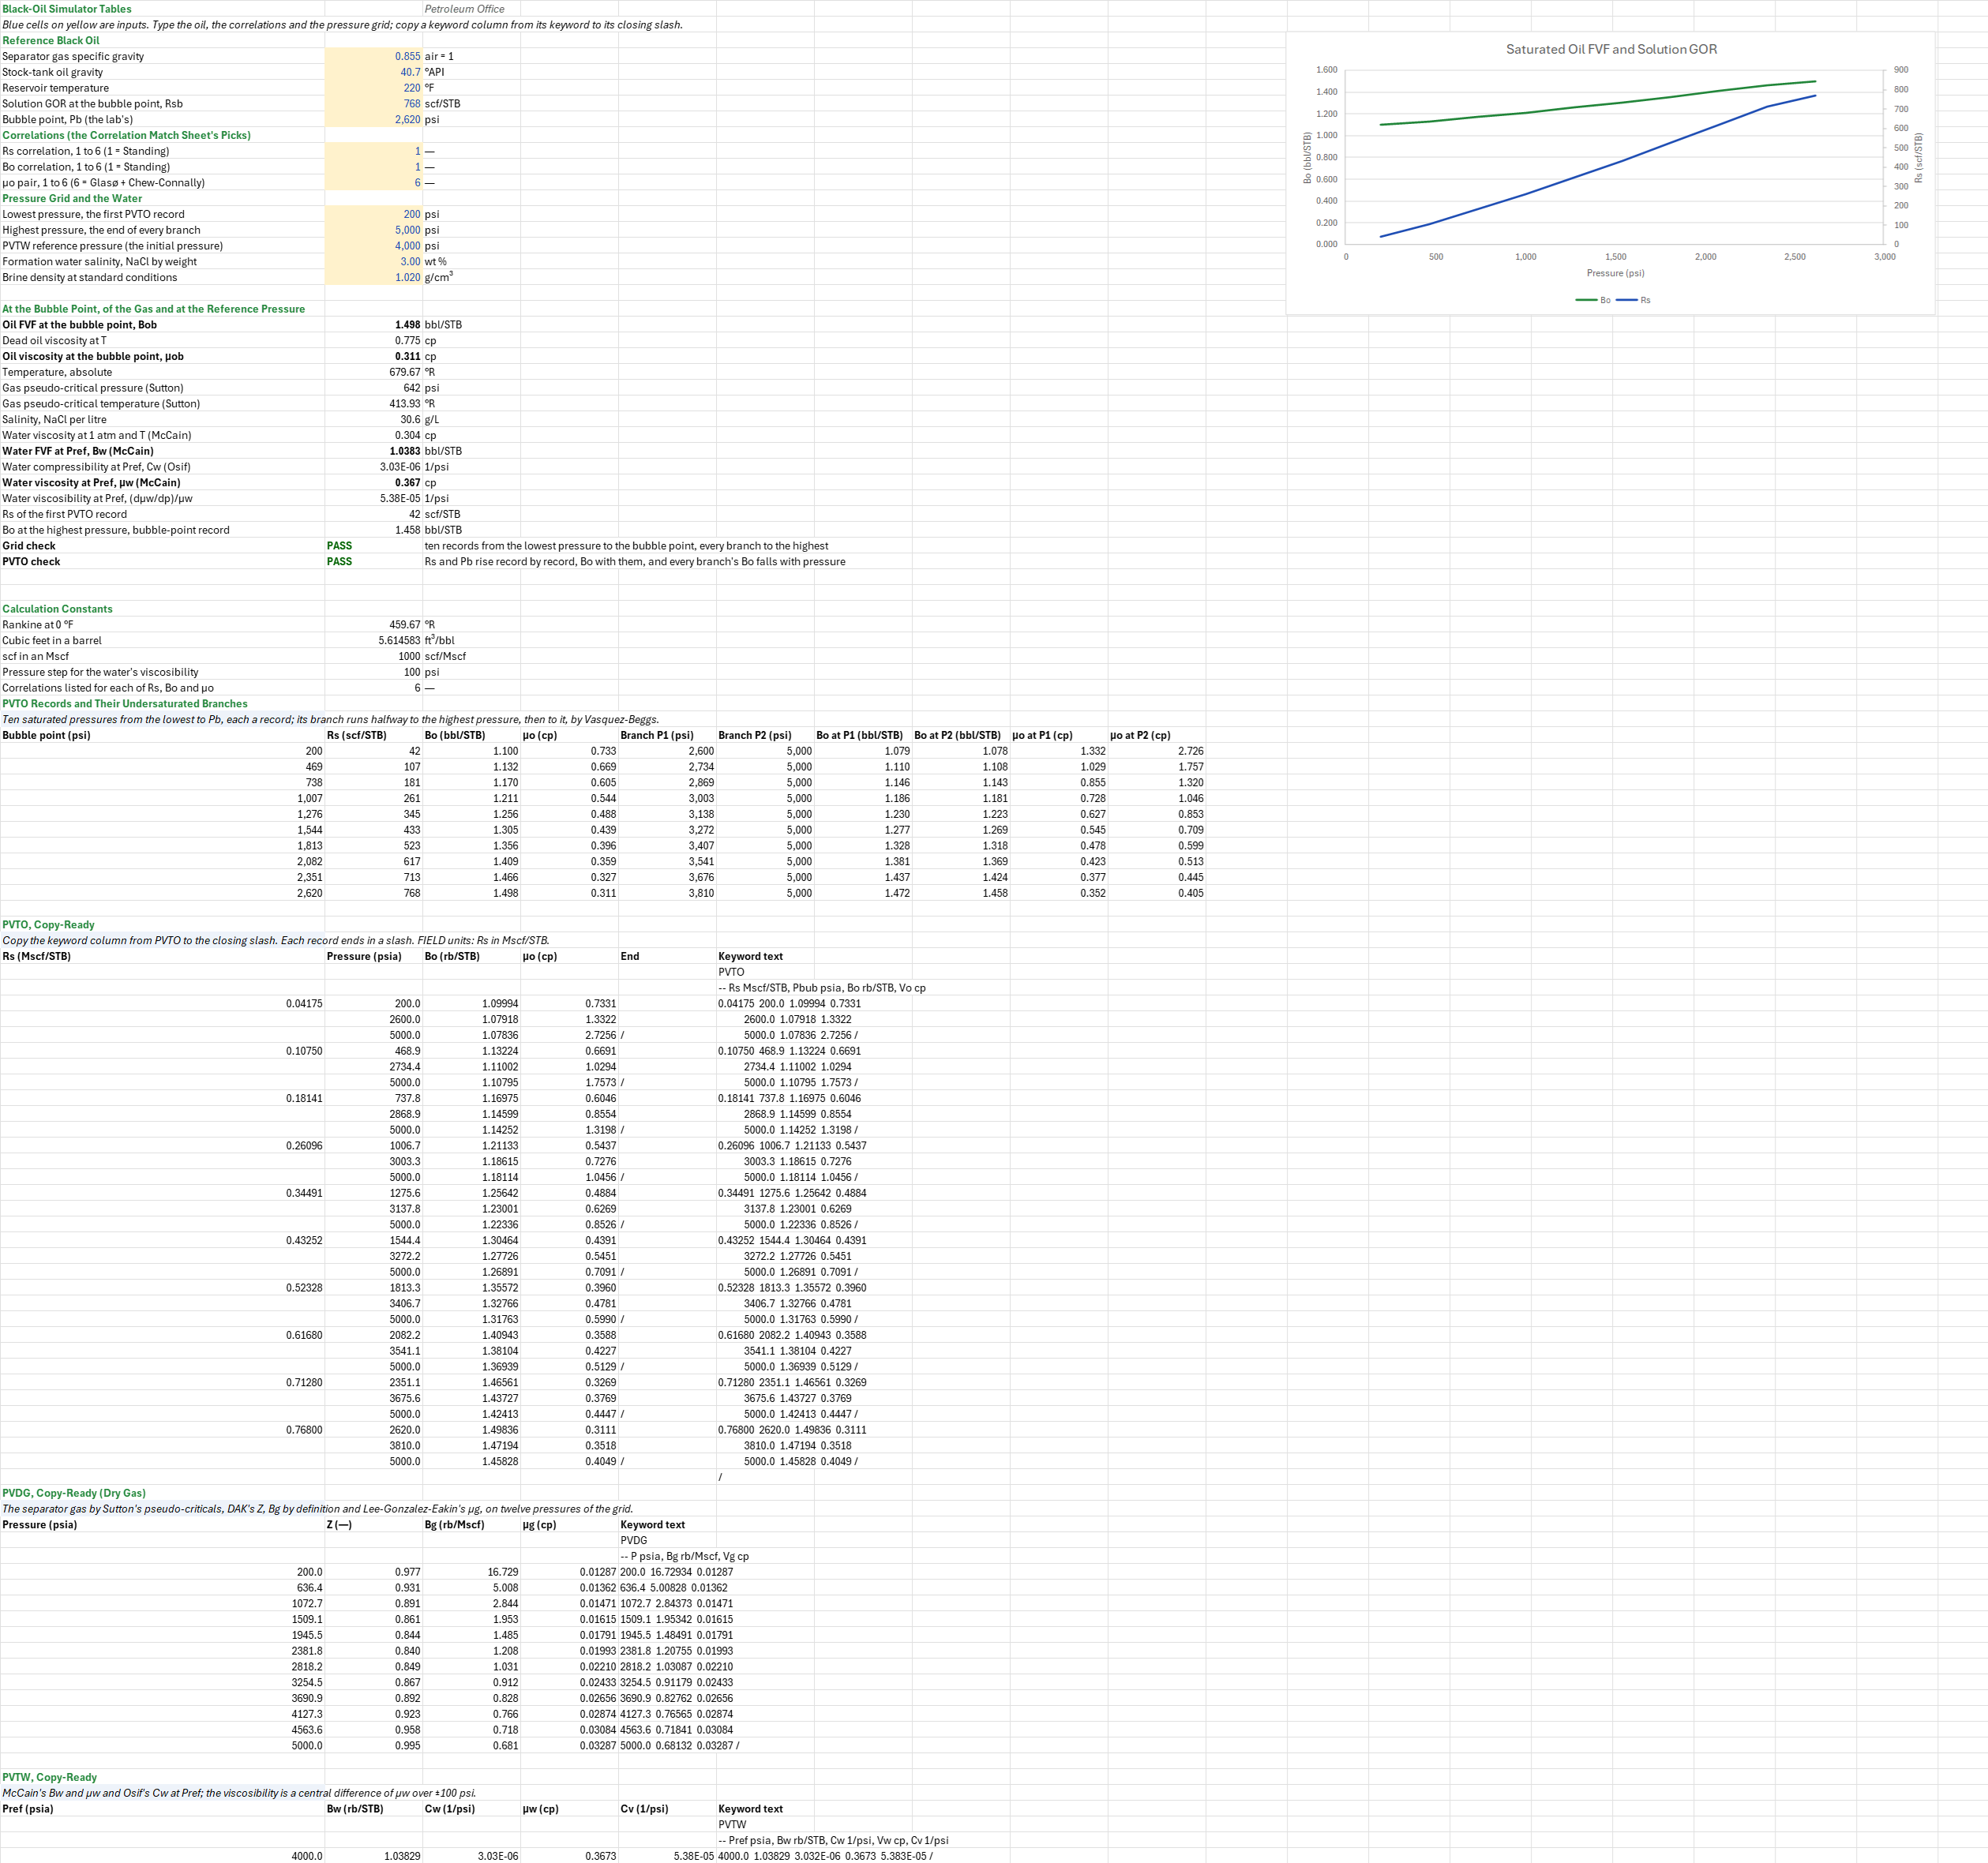
What PVTO, PVDG and PVTW tables does a simulator deck need for this oil? You enter the separator gas and stock-tank gravities, the temperature, Rsb and the lab bubble point, pick the Rs, Bo and oil-viscosity correlations by number, and set the pressure grid and the water's salinity. You read off ten saturated PVTO records up to the bubble point, each with an undersaturated branch, PVDG on twelve pressures and PVTW at a reference pressure, each as a keyword column to paste into an Eclipse or OPM Flow deck's PROPS section.
Parameters:
- The oil: separator gas gravity
BOT_SGg, stock-tank gravityBOT_API, reservoir temperatureBOT_T, RsbBOT_Rsband the bubble pointBOT_Pb(the lab's) - Correlations:
BOT_RsCorrandBOT_BoCorr(1 Standing, 2 Vasquez-Beggs, 3 Glasø, 4 Al-Marhoun, 5 Petrosky-Farshad or Petrosky, 6 Dindoruk-Christman) and the μo pairBOT_UoCorr(1 Beal, 2 Egbogah or 3 Glasø dead oil with Beggs-Robinson; 4 to 6 the same with Chew-Connally) - Grid and water: the lowest pressure
BOT_Pmin(the first record) and the highestBOT_Pmax(the end of every branch), the PVTW reference pressureBOT_Pref, and the water's NaCl salinityBOT_Saland brine densityBOT_BrineDen
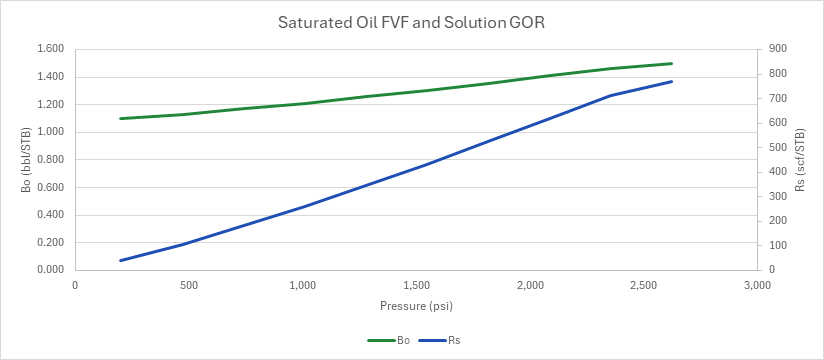
How to use it: Type the oil from the separator test and the CCE's bubble point, the correlations the PVT Correlation Match Against the Lab sheet picks against the report, the deck's pressure range and the initial reservoir pressure for PVTW. Copy a keyword column from its keyword line to its closing slash. To use the lab's own table instead, paste its Rs, Bo and μo over the record columns. A check confirms that the records' Rs and bubble point rise down the table, Bo with them, and that every branch's Bo falls with pressure; a chart draws the saturated Bo and Rs against pressure. The sheet is the Complete PVT Study workbook's Simulator Tables sheet on one sheet, with the correlations typed by number rather than picked against the lab.
Method:
- Records. Ten pressures from the lowest pressure to Pb in equal steps; at each, Rs by the chosen correlation, held at most Rsb (the bubble-point record takes Rsb itself), and the saturated Bo and μo by the chosen correlations at that Rs.
- Branches. Each record's branch runs halfway from its bubble point to the highest pressure, then to it. Along it Bo = Bob·exp(−Co·(p − Pb)), the undersaturated Bo by definition, with Vasquez-Beggs' Co at the record's Rs, and μo by Vasquez-Beggs' undersaturated viscosity from the record's own.
- PVTO. The PVTO table function lays the records and their branches out as the keyword wants them: each record's Rs (in Mscf/STB), bubble point, Bo and μo, then its branch lines with the Rs field empty, a slash closing each record. One INDEX a cell, and the keyword column joins each line's fields.
- PVDG. Sutton's pseudo-criticals of the separator gas, DAK's Z, Bg by definition in rb/Mscf, and Lee-Gonzalez-Eakin's μg, on twelve pressures from the lowest pressure to the highest.
- PVTW. McCain's Bw and μw (through μw at 1 atm) and Osif's Cw at the reference pressure; the viscosibility (dμw/dp)/μw is a central difference of McCain's μw over ±100 psi.
- Checks. Grid: a FAIL for a correlation number outside 1 to 6, a lowest pressure not below Pb or a highest not above it. PVTO: the records' Rs and bubble point rise, the saturated Bo rises with them, and every branch's Bo falls as the pressure rises.
Example: The defaults are the PVT family's reference black oil, Ahmed's oil 2: 40.7 °API, a 0.855 gravity separator gas (100 psig, 75 °F), 220 °F, Rsb 768 scf/STB and a measured bubble point of 2,620 psi, with the correlation-match sheet's recommended set (Standing's Rs and Bo, Glasø's dead oil with Chew-Connally), on the Complete PVT Study workbook's grid: 200 to 5,000 psi, PVTW at 4,000 psi, 3 wt % brine of 1.02 g/cm³.
The saturated Bob by Standing is 1.49836 bbl/STB and μob 0.3111 cp (Glasø's dead oil 0.7750 cp). PVTO runs from 0.04175 Mscf/STB at 200.0 psi (Bo 1.09994, μo 0.7331 cp) to 0.76800 at 2,620.0 psi (1.49836, 0.3111), the last branch at 3,810.0 psi (1.47194, 0.3518) and 5,000.0 psi (1.45828, 0.4049); line for line the workbook's PVTO. PVDG runs from Bg 16.72934 rb/Mscf and μg 0.01287 cp at 200.0 psi to 0.68132 and 0.03287 at 5,000.0 psi. PVTW at 4,000 psi reads Bw 1.03829 rb/STB, Cw 3.032 × 10⁻⁶ 1/psi, μw 0.3673 cp and Cv 5.383 × 10⁻⁵ 1/psi. Typing 2 for Bo uses Vasquez-Beggs, with Bob 1.45026.
Functions used
PO.PVT.Bo.Sat.ByStanding(SG_gas, API, Rs, T_degF)
Calculates oil formation volume factor using Standing (1947) correlation, P <= Pb, [bbl/STB].
PO.PVT.Bo.Sat.ByVasquezBeggs(SG_gas, API, Rs, T_degF)
Calculates oil formation volume factor using Vasquez and Beggs (1980) correlation, P <= Pb, [bbl/STB].
PO.PVT.Bo.Sat.ByGlaso(SG_gas, API, Rs, T_degF)
Calculates oil formation volume factor using Glaso (1980) correlation, P <= Pb, [bbl/STB].
PO.PVT.Bo.Sat.ByAlMarhoun(SG_gas, API, Rs, T_degF)
Calculates oil formation volume factor using Al-Marhoun (1988) correlation, P <= Pb, [bbl/STB].
PO.PVT.Bo.Sat.ByPetrosky(SG_gas, API, Rs, T_degF)
Calculates oil formation volume factor using Petrosky (1990) correlation, P <= Pb, [bbl/STB].
PO.PVT.Bo.Sat.ByDindorukChristman(SG_gas, API, Rs, T_degF)
Calculates oil formation volume factor using Dindoruk and Christman (2001) correlation, P <= Pb, [bbl/STB].
PO.PVT.Uo.Dead.ByBeal(API, T_degF)
Calculates dead oil viscosity using Beal (1946) correlation. Standing's curve fit of Beal's graphical correlation. Best performer per Fotias (2022), [cP].
PO.PVT.Uo.Dead.ByEgbogah(API, T_degF)
Calculates dead oil viscosity using Egbogah (1983) correlation, [cP].
PO.PVT.Uo.Dead.ByGlaso(API, T_degF)
Calculates dead oil viscosity using Glaso (1980) correlation. Developed for North Sea crude oils, [cP].
PO.PVT.Uo.Sat.ByBeggsRobinson(Rs, Uo_dead)
Calculates oil viscosity with solution gas using Beggs and Robinson (1975) correlation, P <= Pb, [cP].
PO.PVT.Uo.Sat.ByChewConnally(Rs, Uo_dead)
Calculates oil viscosity with solution gas using Chew and Connally (1959) correlation, P <= Pb, [cP].
PO.PVT.Ppc.BySutton(SG_gas)
Calculates pseudo-critical pressure of hydrocarbon gas using Sutton (1985) correlation, [psi].
PO.PVT.Tpc.BySutton(SG_gas)
Calculates pseudo-critical temperature of hydrocarbon gas using Sutton (1985) correlation, [degR].
PO.PVT.Salinity.Gl.FromPct(salinity_pct, density)
Converts water salinity from percent by weight to grams NaCl per liter, [g/L].
PO.PVT.Uw.1Atm.ByMcCain(T_degF, salinity_pct)
Calculates water viscosity at atmospheric pressure and reservoir temperature using McCain correlation, [cP].
PO.PVT.Bw.ByMcCain(P, T_degF)
Calculates water formation volume factor using McCain correlation, [bbl/STB].
PO.PVT.Cw.UnSat.ByOsif(P, T_degF, salinity_gl)
Calculates water compressibility for undersaturated conditions using Osif correlation, P >= Pb, [1/psi].
PO.PVT.Uw.ByMcCain(P, Uw_1atm)
Calculates water viscosity using McCain correlation, [cP].
PO.PVT.Rs.ByStanding(SG_gas, API, P, T_degF)
Calculates solution gas-oil ratio using Standing correlation (1947), the exact inverse of Standing Pb, P <= Pb, [SCF/STB].
PO.PVT.Rs.ByVasquezBeggs(SG_gas, API, P, T_degF)
Calculates solution gas-oil ratio using Vasquez and Beggs (1980) correlation, P <= Pb, [SCF/STB].
PO.PVT.Rs.ByGlaso(SG_gas, API, P, T_degF)
Calculates solution gas-oil ratio using Glaso (1980) correlation, P <= Pb, [SCF/STB].
PO.PVT.Rs.ByAlMarhoun(SG_gas, API, P, T_degF)
Calculates solution gas-oil ratio using Al-Marhoun (1988) correlation, P <= Pb, [SCF/STB].
PO.PVT.Rs.ByPetroskyFarshad(SG_gas, API, P, T_degF)
Calculates solution gas-oil ratio using Petrosky and Farshad (1993) correlation, P <= Pb, [SCF/STB].
PO.PVT.Rs.ByDindorukChristman(SG_gas, API, P, T_degF)
Calculates solution gas-oil ratio using Dindoruk and Christman (2001) correlation, P <= Pb, [SCF/STB].
PO.PVT.Bo.UnSat.ByDefinition(Bob, Co, Pb, P)
Calculates oil formation volume factor for undersaturated oil, P > Pb, [bbl/STB].
PO.PVT.Co.UnSat.ByVasquezBeggs(Rsb, SG_gas, API, T_degF, P)
Calculates oil compressibility using Vasquez and Beggs (1980) correlation, P > Pb, [1/psi].
PO.PVT.Uo.UnSat.ByVasquezBeggs(P, Pb, Uob)
Calculates oil viscosity for undersaturated conditions using Vasquez and Beggs (1980) correlation, P > Pb, [cP].
PO.PVT.Z.ByDAK(Ppr, Tpr)
Calculates gas compressibility factor (Z) using Dranchuk and Abou-Kassem (1975) equation of state, [dimensionless].
PO.PVT.Bg.ByDefinition(P, T_degR, Z)
Calculates gas formation volume factor, [rcf/scf].
PO.PVT.Ug.ByLGE(Z, SG_gas, P, T_degR)
Calculates gas viscosity using Lee, Gonzales and Eakin (1966) correlation, [cP].
Names (50)
| Name | Refers to | Comment |
|---|---|---|
PO.PVT.Table.PVTOLAMBDA |
=LAMBDA(Rs, Pb, Bo, Uo, Pu, Bou, Uou, LET(n, ROWS(Rs), m, COLUMNS(Pu), w, m + 1, MAKEARRAY(n * w, 5, LAMBDA(line, col, LET(i, INT((line - 1) / w) + 1, j, MOD(line - 1, w), more, IF(j = m, FALSE, ISNUMBER(INDEX(Pu, i, j + 1))), IF(j = 0, CHOOSE(col, INDEX(Rs, i) / 1000, INDEX(Pb, i), INDEX(Bo, i), INDEX(Uo, i), IF(more, "", "/")), IF(ISNUMBER(INDEX(Pu, i, j)), CHOOSE(col, "", INDEX(Pu, i, j), INDEX(Bou, i, j), INDEX(Uou, i, j), IF(more, "", "/")), ""))))))) |
Eclipse PVTO records in field units from saturated rows (Rs scf/STB, Pb psia, Bo rb/STB, uo cp) and undersaturated branches (P, Bo, uo, a row per record): Rs in Mscf/STB, P, Bo, uo and "/" at each record's end, padded with "". |
BOT_SGg |
$B$4 |
Separator gas specific gravity, air = 1 |
BOT_API |
$B$5 |
Stock-tank oil gravity, °API |
BOT_T |
$B$6 |
Reservoir temperature, °F |
BOT_Rsb |
$B$7 |
Solution GOR at the bubble point, Rsb, scf/STB |
BOT_Pb |
$B$8 |
Bubble point, Pb (the lab's), psi |
BOT_RsCorr |
$B$10 |
Rs correlation, 1 to 6 (1 = Standing) |
BOT_BoCorr |
$B$11 |
Bo correlation, 1 to 6 (1 = Standing) |
BOT_UoCorr |
$B$12 |
μo pair, 1 to 6 (6 = Glasø + Chew-Connally) |
BOT_Pmin |
$B$14 |
Lowest pressure, the first PVTO record, psi |
BOT_Pmax |
$B$15 |
Highest pressure, the end of every branch, psi |
BOT_Pref |
$B$16 |
PVTW reference pressure (the initial pressure), psi |
BOT_Sal |
$B$17 |
Formation water salinity, NaCl by weight, wt % |
BOT_BrineDen |
$B$18 |
Brine density at standard conditions, g/cm³ |
BOT_Inputs |
$B$4:$B$18 |
The oil's gas and stock-tank gravities, temperature, Rsb and bubble point; the Rs, Bo and μo correlations; the lowest and highest pressure, the PVTW reference pressure, and the water's salinity and density |
BOT_R0 |
$B$40 |
Rankine at 0 °F, °R |
BOT_Ft3Bbl |
$B$41 |
Cubic feet in a barrel, ft³/bbl |
BOT_Mscf |
$B$42 |
scf in an Mscf, scf/Mscf |
BOT_dPv |
$B$43 |
Pressure step for the water's viscosibility, psi |
BOT_Corrs |
$B$44 |
Correlations listed for each of Rs, Bo and μo |
BOT_Bob |
$B$21 |
Oil FVF at the bubble point, Bob, bbl/STB |
BOT_Uod |
$B$22 |
Dead oil viscosity at T, cp |
BOT_Uob |
$B$23 |
Oil viscosity at the bubble point, μob, cp |
BOT_TR |
$B$24 |
Temperature, absolute, °R |
BOT_Ppc |
$B$25 |
Gas pseudo-critical pressure (Sutton), psi |
BOT_Tpc |
$B$26 |
Gas pseudo-critical temperature (Sutton), °R |
BOT_SalGL |
$B$27 |
Salinity, NaCl per litre, g/L |
BOT_Uw1 |
$B$28 |
Water viscosity at 1 atm and T (McCain), cp |
BOT_BwRef |
$B$29 |
Water FVF at Pref, Bw (McCain), bbl/STB |
BOT_CwRef |
$B$30 |
Water compressibility at Pref, Cw (Osif), 1/psi |
BOT_UwRef |
$B$31 |
Water viscosity at Pref, μw (McCain), cp |
BOT_CvRef |
$B$32 |
Water viscosibility at Pref, (dμw/dp)/μw, 1/psi |
BOT_RsFirst |
$B$33 |
Rs of the first PVTO record, scf/STB |
BOT_BoLast |
$B$34 |
Bo at the highest pressure, bubble-point record, bbl/STB |
BOT_GridCheck |
$B$35 |
Grid check verdict |
BOT_GridCheckNote |
$C$35 |
Grid check comment |
BOT_PvtoCheck |
$B$36 |
PVTO check verdict |
BOT_PvtoCheckNote |
$C$36 |
PVTO check comment |
BOT_Results |
$B$21:$B$36 |
Bob, μod and μob by the chosen correlations; the absolute temperature and the gas's pseudo-criticals; the water's salinity, μw at 1 atm, and Bw, Cw, μw and viscosibility at Pref; the first record's Rs and the last branch's Bo; the grid and PVTO checks |
BOT_Curve |
$A$48:$J$57 |
Each PVTO record's bubble point, Rs, Bo and μo, and its branch's two pressures with Bo and μo at each |
BOT_SatP |
$A$48:$A$57 |
The records' bubble points, psi |
BOT_SatRs |
$B$48:$B$57 |
The records' Rs, scf/STB |
BOT_SatBo |
$C$48:$C$57 |
The records' saturated Bo, bbl/STB |
BOT_SatUo |
$D$48:$D$57 |
The records' saturated μo, cp |
BOT_BrP |
$E$48:$F$57 |
Branch pressures, psi |
BOT_BrBo |
$G$48:$H$57 |
Branch Bo, bbl/STB |
BOT_BrUo |
$I$48:$J$57 |
Branch μo, cp |
BOT_PvtoText |
$F$62:$F$94 |
PVTO keyword text, copy-ready |
BOT_PvdgText |
$E$98:$E$111 |
PVDG keyword text, copy-ready |
BOT_PvtwText |
$F$116:$F$118 |
PVTW keyword text, copy-ready |
Details
| Inserts | 118 rows × 10 columns |
| Category | PVT Properties |
| For agents and tools | Descriptor (.md) |