Multilayer Oil IPR With Crossflow at Shut-In
Description
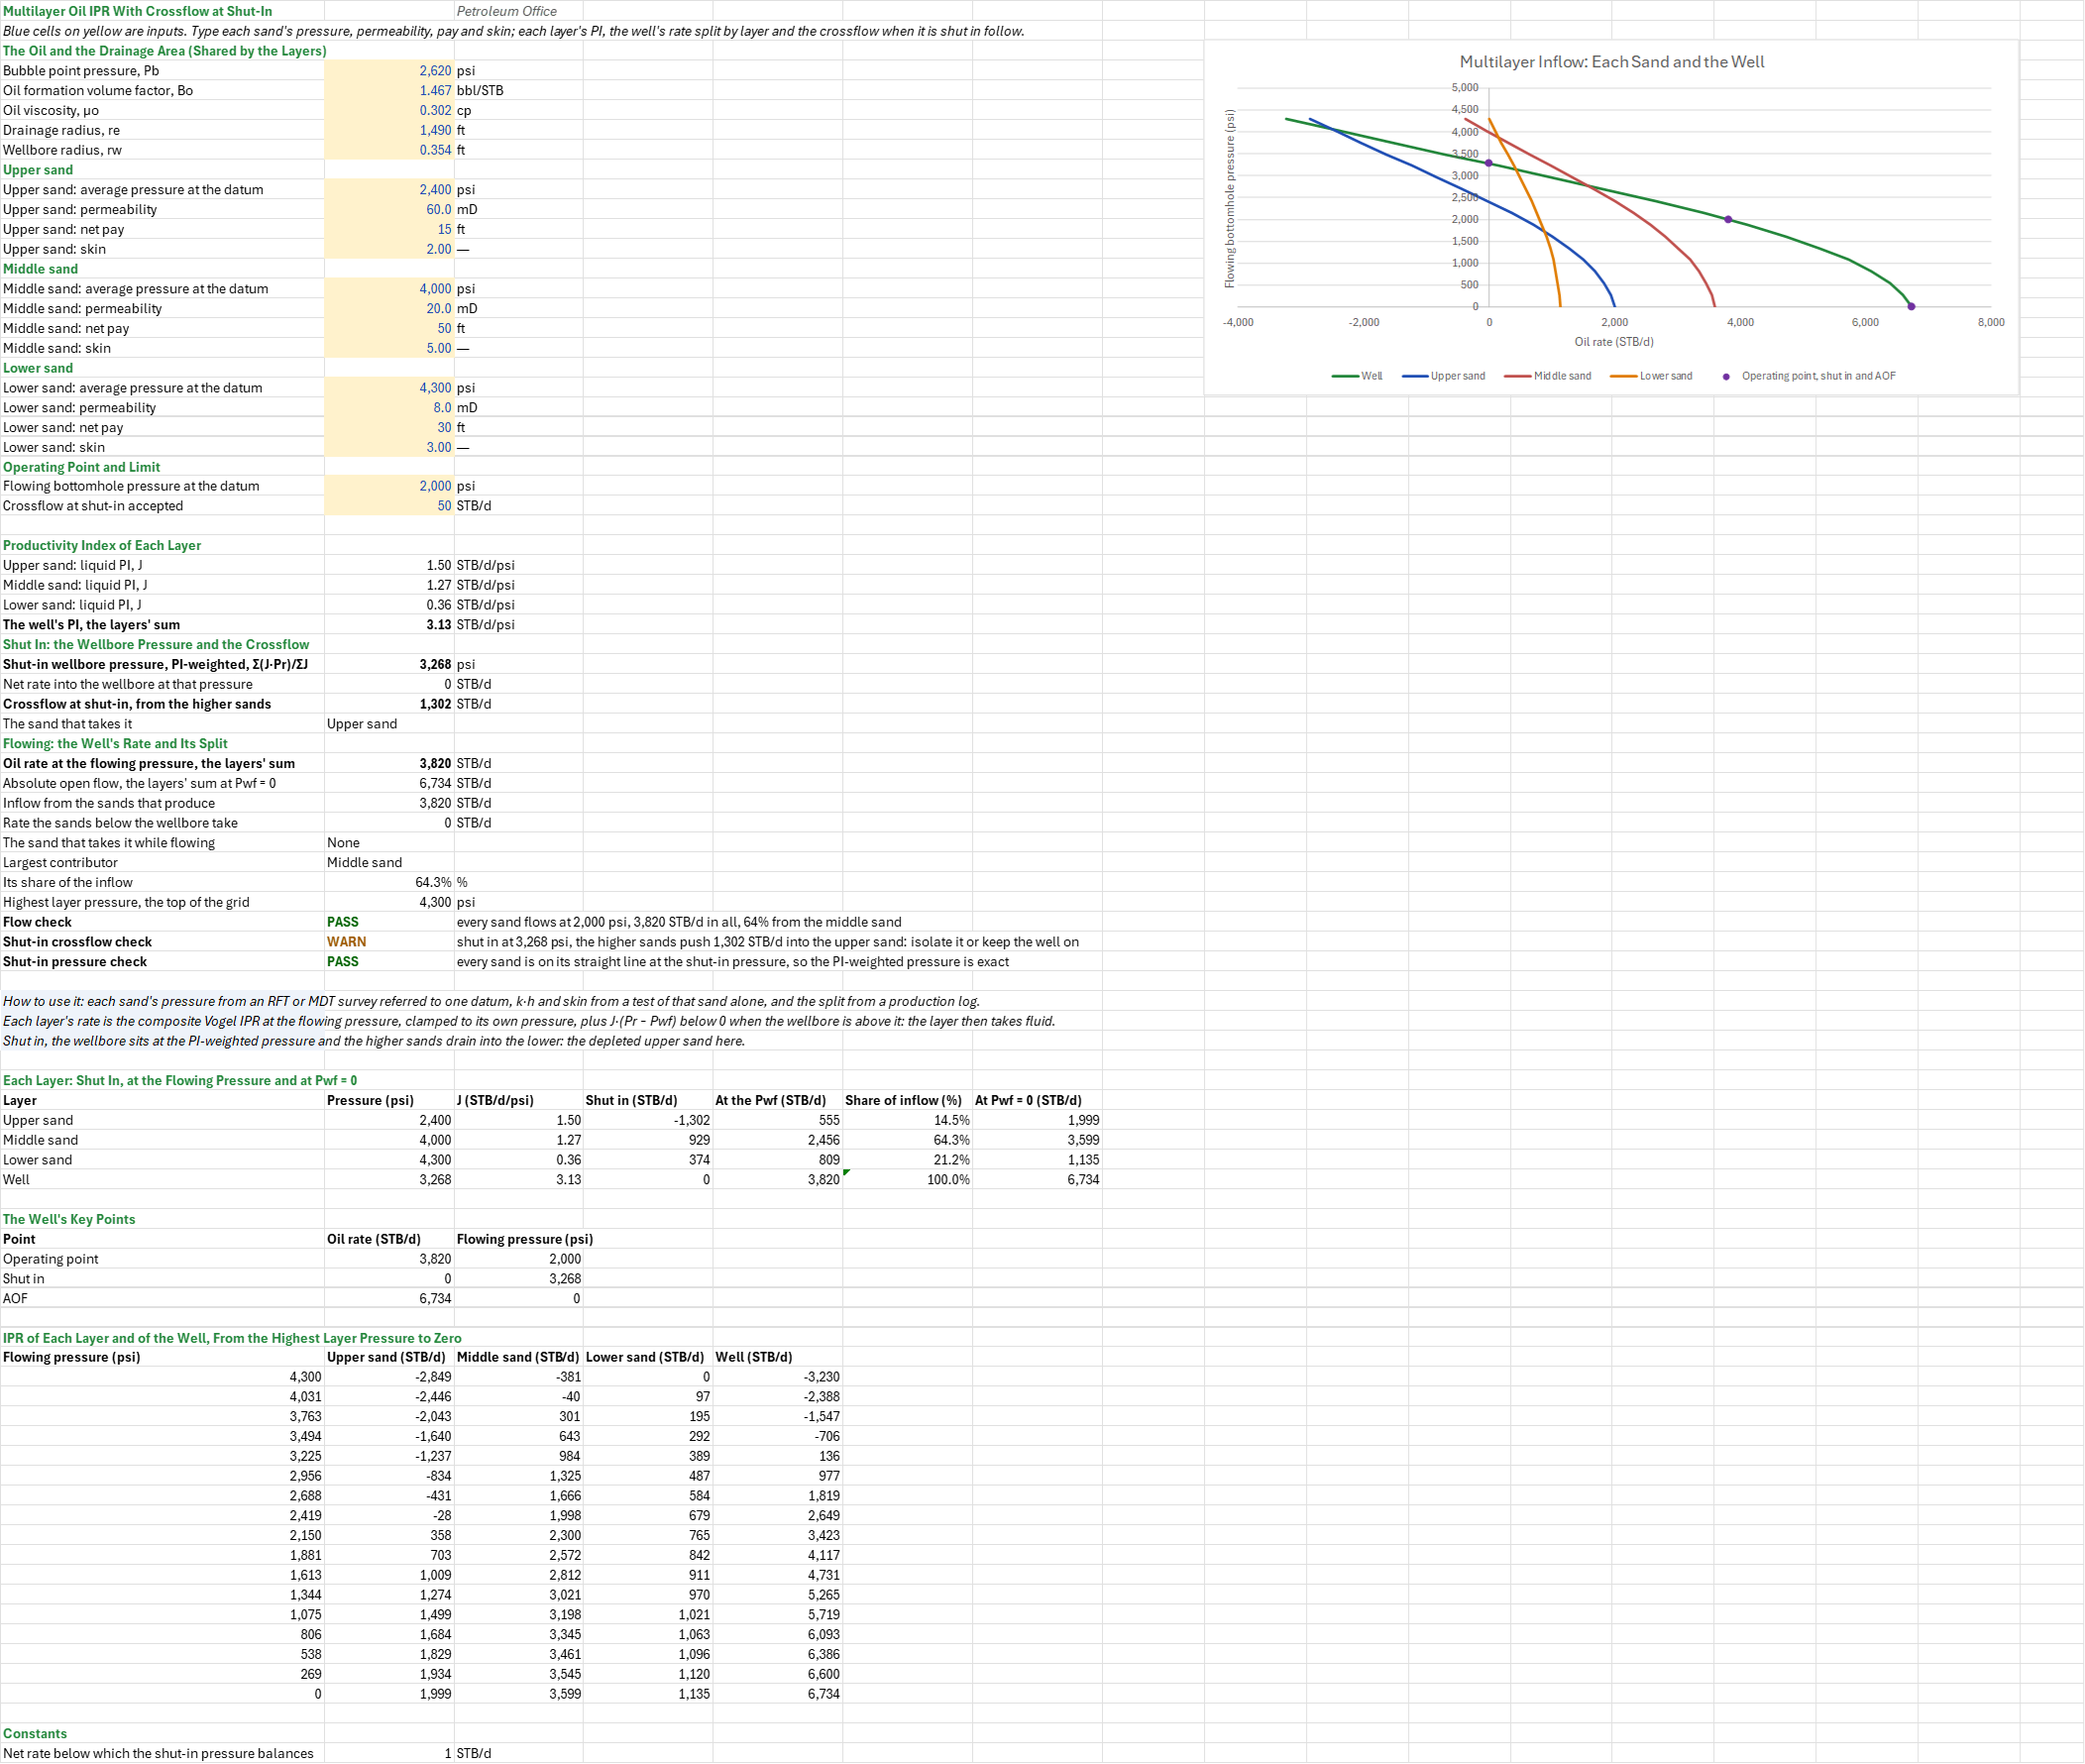
How much oil does a well commingling three sands make at its flowing pressure, how much comes from each sand, and what happens between them when it is shut in? You enter the oil and drainage area the sands share, each sand's pressure, permeability, net pay and skin, and the flowing pressure. You read off each sand's productivity index and rate, the well's rate, AOF and split by sand, the PI-weighted shut-in pressure, and the crossflow from the higher sands into the lower one.
Parameters:
- The oil and the drainage area, shared by the sands: the bubble point
IML_Pb(psi), BoIML_Bo(bbl/STB), μoIML_Uo(cp), and the drainage and wellbore radiiIML_reandIML_rw(ft) - Each sand (upper
U, middleM, lowerL): its average pressure at the datumIML_PrU,IML_PrM,IML_PrL(psi), permeabilityIML_kU… (mD), net payIML_hU… (ft) and skinIML_sU… - Operating point and limit: the flowing bottomhole pressure at the datum
IML_PwfOp(psi) and the crossflow accepted at shut-inIML_XfTol(STB/d)
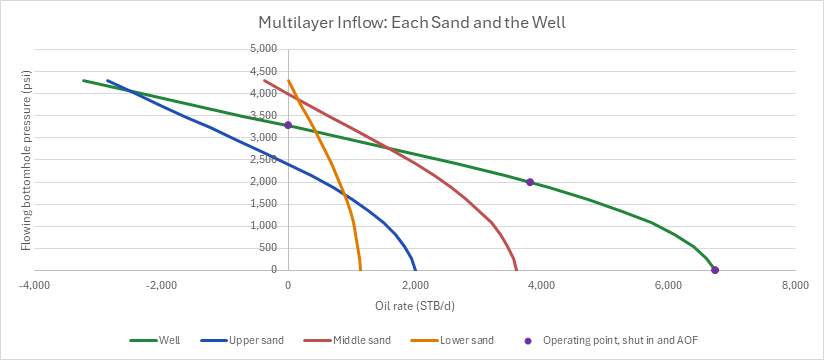
How to use it: Take each sand's pressure from a formation-tester survey (RFT or MDT) referred to one datum, its k·h and skin from a test of that sand alone (or a layered test), the oil's properties from the PVT report, and check the split against a production log. Where the sands hold different oils, their own Bo and μo change their PIs; the sheet takes one oil. A chart draws each sand's IPR and the well's, with the operating point, the shut-in pressure and the AOF. Three checks read the flow at the operating pressure, the crossflow at shut-in and whether the PI-weighted shut-in pressure balances.
Method: Each sand has its own pressure and its own productivity index, from its permeability, net pay and skin: the radial pseudosteady-state one, J = k·h/(141.2·Bo·μo·(ln(re/rw) − 0.75 + s)). At a common flowing pressure Pwf, each sand's rate is the composite IPR at MIN(Pwf, Pr): J·(Pr − Pwf) down to Pb, then Vogel's curve with its AOF at J·Pb/1.8 below it, or Vogel's curve alone from Pr when the sand is at or below its bubble point. The composite rate function stops at Pwf = Pr, so the sheet clamps the flowing pressure to the sand's and adds J·MIN(0, Pr − Pwf): a sand whose pressure is below the wellbore's doesn't produce, it takes fluid at its PI, the injectivity of a liquid-filled layer. The sheet adds the three rates in its own cells for the well's rate and the AOF, and each sand's share is its rate over the inflow from the sands that produce. Shut in, the wellbore pressure is where the three rates sum to zero; while every sand is on its straight part there, that is the PI-weighted pressure Σ(J·Pr)/ΣJ, and the sheet takes it and shows the net rate left at it. The higher sands then push oil into the lower one: the crossflow is the sum of the positive rates there, and the sand that takes it is the one with the most negative. The grid steps the flowing pressure from the highest sand pressure to zero in sixteen steps.
Example: The middle sand is the oil-inflow family's reference sand, the one the Composite Oil IPR, Fetkovich Oil IPR Fitted to a Multi-Rate Test, Klins-Clark Oil IPR, Productivity Index and Flow Efficiency and Skin Sensitivity of the IPR sheets start from: a vertical oil well on 160 acres (re = 1,490 ft, rw = 0.354 ft) in 50 ft of 20 mD sand, producing the reference black oil (Ahmed's oil 2, Pb = 2,620 psi, Bo = 1.467 rb/STB and μo = 0.302 cp at 4,000 psi) from a 4,000 psi reservoir, with a total skin of 5 from a buildup. The well also opens two more sands of the same oil in the same drainage area: an upper sand, 15 ft of 60 mD with a skin of 2, depleted to 2,400 psi by an offset producer, below its bubble point; and a lower sand, 30 ft of 8 mD with a skin of 3, at 4,300 psi. The pressures are referred to one datum, the mid-perforations. The well flows at 2,000 psi, and 50 STB/d of crossflow at shut-in is accepted.
ln(1,490/0.354) − 0.75 = 7.595, and 141.2 × 1.467 × 0.302 = 62.556, so the sands' PIs are 900/(62.556 × 9.595) = 1.4994 (upper), 1,000/(62.556 × 12.595) = 1.2692 (middle, the reference sand's) and 240/(62.556 × 10.595) = 0.36211 STB/d/psi (lower): 3.1307 in all. Shut in, the wellbore sits at (1.4994 × 2,400 + 1.2692 × 4,000 + 0.36211 × 4,300)/3.1307 = 3,268.4 psi, above the bubble point, so the PI-weighted pressure is exact (net 0). There the middle sand pushes 928.6 and the lower 373.6 STB/d into the upper sand, 1,302.1 STB/d of crossflow: the shut-in check warns. At 2,000 psi every sand flows. The upper sand, below its bubble point, is on Vogel's curve from 2,400 psi: 1,999.2 × (1 − 0.2 × 0.8333 − 0.8 × 0.6944) = 555.3 STB/d. The middle sand makes 1.2692 × 1,380 = 1,751.5 STB/d on its straight line to 2,620 psi and 1,847.4 × 0.3812 = 704.1 on Vogel's curve below, 2,455.6; the lower 608.3 + 200.9 = 809.2. The well makes 3,820.2 STB/d: 14.5 %, 64.3 % and 21.2 % from the three sands. The AOF is 6,733.5 STB/d.
Functions used
PO.IPR.VW.PSS.PI(K, h, Bl, Ul, Re, Rw, S)
Calculates pseudosteady state productivity index for vertical well, [bbl/(psi.d)].
PO.IPR.VW.PSS.Rate.ByVogel(J, P_average, Pwf, Pb)
Calculates Vogel inflow performance for pseudosteady state flow, [bbl/d].
Names (53)
| Name | Refers to | Comment |
|---|---|---|
IML_Pb |
$B$4 |
Bubble point pressure, Pb, psi |
IML_Bo |
$B$5 |
Oil formation volume factor, Bo, bbl/STB |
IML_Uo |
$B$6 |
Oil viscosity, μo, cp |
IML_re |
$B$7 |
Drainage radius, re, ft |
IML_rw |
$B$8 |
Wellbore radius, rw, ft |
IML_PrU |
$B$10 |
Upper sand: average pressure at the datum, psi |
IML_kU |
$B$11 |
Upper sand: permeability, mD |
IML_hU |
$B$12 |
Upper sand: net pay, ft |
IML_sU |
$B$13 |
Upper sand: skin |
IML_PrM |
$B$15 |
Middle sand: average pressure at the datum, psi |
IML_kM |
$B$16 |
Middle sand: permeability, mD |
IML_hM |
$B$17 |
Middle sand: net pay, ft |
IML_sM |
$B$18 |
Middle sand: skin |
IML_PrL |
$B$20 |
Lower sand: average pressure at the datum, psi |
IML_kL |
$B$21 |
Lower sand: permeability, mD |
IML_hL |
$B$22 |
Lower sand: net pay, ft |
IML_sL |
$B$23 |
Lower sand: skin |
IML_PwfOp |
$B$25 |
Flowing bottomhole pressure at the datum, psi |
IML_XfTol |
$B$26 |
Crossflow at shut-in accepted, STB/d |
IML_Inputs |
$B$4:$B$26 |
The oil's bubble point, Bo and viscosity, the drainage and wellbore radii, each sand's pressure, permeability, net pay and skin, the flowing pressure and the crossflow accepted at shut-in |
IML_JU |
$B$29 |
Upper sand: liquid PI, J, STB/d/psi |
IML_JM |
$B$30 |
Middle sand: liquid PI, J, STB/d/psi |
IML_JL |
$B$31 |
Lower sand: liquid PI, J, STB/d/psi |
IML_J |
$B$32 |
The well's PI, the layers' sum, STB/d/psi |
IML_Pws |
$B$34 |
Shut-in wellbore pressure, PI-weighted, Σ(J·Pr)/ΣJ, psi |
IML_NetWs |
$B$35 |
Net rate into the wellbore at that pressure, STB/d |
IML_Xf |
$B$36 |
Crossflow at shut-in, from the higher sands, STB/d |
IML_Thief |
$B$37 |
The sand that takes it |
IML_q |
$B$39 |
Oil rate at the flowing pressure, the layers' sum, STB/d |
IML_AOF |
$B$40 |
Absolute open flow, the layers' sum at Pwf = 0, STB/d |
IML_Gross |
$B$41 |
Inflow from the sands that produce, STB/d |
IML_Take |
$B$42 |
Rate the sands below the wellbore take, STB/d |
IML_Taker |
$B$43 |
The sand that takes it while flowing |
IML_Top |
$B$44 |
Largest contributor |
IML_TopShare |
$B$45 |
Its share of the inflow, % |
IML_PrMax |
$B$46 |
Highest layer pressure, the top of the grid, psi |
IML_FlowCheck |
$B$47 |
Flow check verdict |
IML_FlowCheckNote |
$C$47 |
Flow check comment |
IML_XfCheck |
$B$48 |
Shut-in crossflow check verdict |
IML_XfCheckNote |
$C$48 |
Shut-in crossflow check comment |
IML_WsCheck |
$B$49 |
Shut-in pressure check verdict |
IML_WsCheckNote |
$C$49 |
Shut-in pressure check comment |
IML_Results |
$B$29:$B$49 |
Each layer's PI and the well's, the PI-weighted shut-in pressure, the crossflow at shut-in and the sand that takes it, the well's rate, AOF and inflow, the rate the sands take while flowing, the largest contributor, and the three checks |
IML_Layers |
$A$57:$G$60 |
Each sand's pressure and PI, its rate shut in (negative: it takes fluid), at the flowing pressure and its share, and at Pwf = 0, with the well's totals |
IML_qWsU |
$D$57 |
Upper sand: rate with the well shut in, STB/d (negative: it takes fluid) |
IML_qU |
$E$57 |
Upper sand: rate at the flowing pressure, STB/d |
IML_qWsM |
$D$58 |
Middle sand: rate with the well shut in, STB/d (negative: it takes fluid) |
IML_qM |
$E$58 |
Middle sand: rate at the flowing pressure, STB/d |
IML_qWsL |
$D$59 |
Lower sand: rate with the well shut in, STB/d (negative: it takes fluid) |
IML_qL |
$E$59 |
Lower sand: rate at the flowing pressure, STB/d |
IML_Points |
$A$64:$C$66 |
The operating point, the shut-in pressure and the AOF, the chart's markers |
IML_Curve |
$A$70:$E$86 |
The flowing pressure in sixteen steps from the highest layer pressure to zero, each layer's rate (negative: it takes fluid) and the well's |
IML_NetTol |
$B$89 |
Net rate below which the shut-in pressure balances, STB/d |
Details
| Inserts | 89 rows × 7 columns |
| Category | Inflow Performance Relationship |
| For agents and tools | Descriptor (.md) |