Fracture Pump Schedule (Nolte Pad and Proppant Ramp)
Description
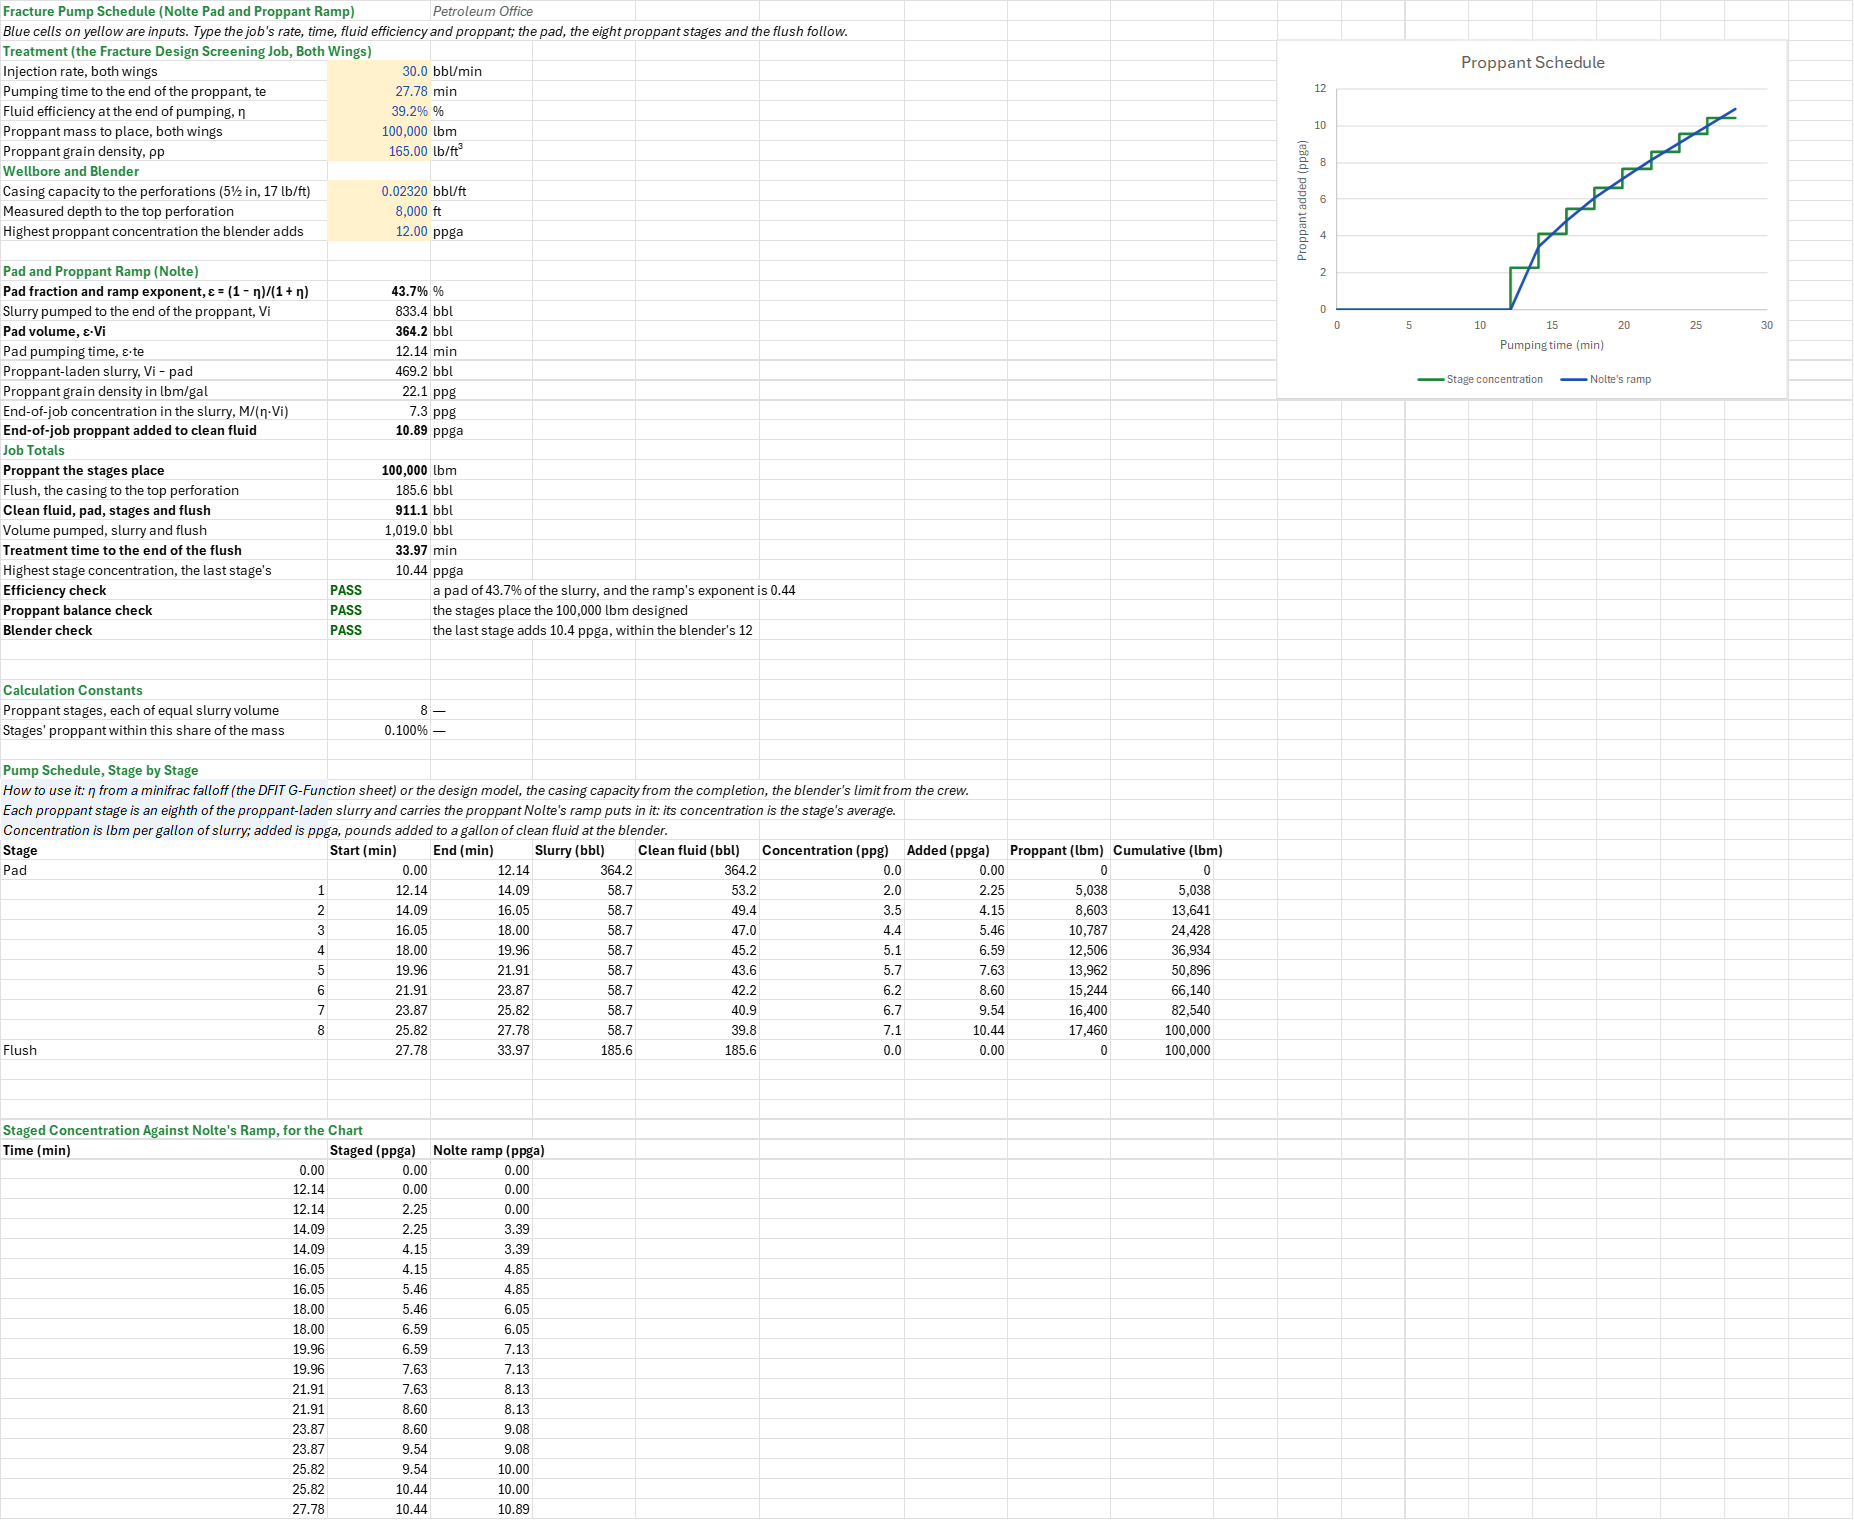
What does the crew pump to place a fracture design's proppant: how much pad, how many pounds at what concentration in each stage, how much clean fluid, and for how long? You enter the injection rate, the pumping time, the fluid efficiency, the proppant mass and grain density, the casing volume to flush and the blender's limit. You read off Nolte's pad, eight proppant stages with each one's start and end time, slurry, clean fluid, concentration and proppant, the flush, the job totals and the treatment time.
Parameters:
- Treatment: the injection rate for both wings
FSC_Q, the pumping time to the end of the proppantFSC_Te, the fluid efficiency at the end of pumpingFSC_Eta, the proppant massFSC_Massand its grain densityFSC_RhoP - Wellbore and blender: the casing capacity
FSC_Capand measured depthFSC_Mdto the top perforation, for the flush, and the highest concentration the blender addsFSC_MaxConc
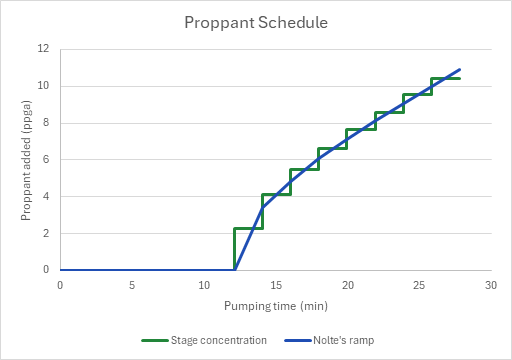
How to use it: Take the efficiency from a minifrac falloff (the DFIT G-Function Analysis sheet's, scaled to the main treatment's fluid) or from the design model, the pumping time from the length the design needs, the casing capacity from the completion, and the blender's limit from the crew. The fluid efficiency fixes the pad by Nolte's rule, and the same number is the exponent of his proppant ramp, which leaves the whole created length propped at a uniform concentration when pumping ends. The sheet cuts the ramp into eight stages of equal slurry volume, each carrying exactly the proppant the ramp puts in it, and adds the flush. The stage table gives each stage's concentration both in the slurry and added at the blender. Check that the fluid efficiency lies above 0 and at most 100 %, that the stages place the proppant designed, and that the last stage's concentration is within the blender's limit. A chart draws the staged concentration over the continuous ramp. A schedule with more stages has more rows of the same formulas, each an equal share of the slurry.
Method: The slurry pumped is Vi = q·te, of which the pad is ε·Vi with ε = (1 − η)/(1 + η), pumped in ε·te. The fracture holds η·Vi at the end, so the end-of-job concentration in the slurry is ce = M/(η·Vi), in pounds per gallon of slurry, and at the blender ca = ce/(1 − ce/ρp) pounds added per gallon of clean fluid, ρp in lbm/gal. Nolte's ramp gives the slurry concentration c(x) = ce·x^ε at a share x of the proppant-laden slurry Vs = Vi − ε·Vi. A stage from x0 to x1 carries ce·Vs·(x1^(1+ε) − x0^(1+ε))/(1 + ε) of proppant, and its concentration is that over its slurry volume. The stages add up to ce·Vs/(1 + ε) = M exactly, because (1 − ε)/(1 + ε) = η. Each stage's clean fluid is its slurry less the proppant's absolute volume, and each stage takes its slurry volume over the rate. The flush is the casing volume to the top perforation, pumped at the same rate.
Example: The default is the job the Fracture Design Screening sheet sizes, both wings: 30 bbl/min for 27.78 min, a fluid efficiency of 39.18 % and 100,000 lbm of 20/40 sand (165 lb/ft³), flushed through 8,000 ft of 5½ in, 17 lb/ft casing (0.0232 bbl/ft) with a blender that adds up to 12 ppga. The Fracture Geometry Models Compared sheet gives the same efficiency for this job on PKN.
η = 39.18 % gives ε = 0.6082/1.3918 = 0.4370. Of the 833.4 bbl of slurry, 364.2 bbl is pad, pumped in 12.14 min, and 469.2 bbl carries the sand, 58.65 bbl to each of the eight stages. The fracture holds 0.3918 × 833.4 = 326.5 bbl at the end, so the job ends at 7.29 lbm per gallon of slurry, 10.89 ppga at the blender. Stage 1 averages 2.25 ppga (5,038 lbm) and stage 8 10.44 ppga (17,460 lbm), and the eight place the 100,000 lbm. With the 185.6 bbl flush the job pumps 1,019 bbl, 911.1 bbl of it clean fluid, in 33.97 min. The last stage's 10.44 ppga is within the blender's 12.
Functions used
PO.UnitConverter(value, unit_from, unit_to)
Converts value from one unit to another.
Names (35)
| Name | Refers to | Comment |
|---|---|---|
PO.FRAC.Design.PadFractionLAMBDA |
=LAMBDA(eta, IF(OR(eta<=0, eta>1), NA(), (1-eta)/(1+eta))) |
Nolte's pad fraction of the slurry volume, ε = (1 − η)/(1 + η), from the fluid efficiency η; also the exponent of the proppant ramp. #N/A outside 0 < η ≤ 1. |
FSC_Q |
$B$4 |
Injection rate, both wings, bbl/min |
FSC_Te |
$B$5 |
Pumping time to the end of the proppant, te, min |
FSC_Eta |
$B$6 |
Fluid efficiency at the end of pumping, η, % |
FSC_Mass |
$B$7 |
Proppant mass to place, both wings, lbm |
FSC_RhoP |
$B$8 |
Proppant grain density, ρp, lb/ft³ |
FSC_Cap |
$B$10 |
Casing capacity to the perforations (5½ in, 17 lb/ft), bbl/ft |
FSC_Md |
$B$11 |
Measured depth to the top perforation, ft |
FSC_MaxConc |
$B$12 |
Highest proppant concentration the blender adds, ppga |
FSC_Inputs |
$B$4:$B$12 |
The job's rate, pumping time, fluid efficiency and proppant, the casing volume to flush, and the blender's limit |
FSC_Eps |
$B$15 |
Pad fraction and ramp exponent, ε = (1 − η)/(1 + η), % |
FSC_Vi |
$B$16 |
Slurry pumped to the end of the proppant, Vi, bbl |
FSC_PadVol |
$B$17 |
Pad volume, ε·Vi, bbl |
FSC_PadTime |
$B$18 |
Pad pumping time, ε·te, min |
FSC_SandVol |
$B$19 |
Proppant-laden slurry, Vi − pad, bbl |
FSC_RhoPGal |
$B$20 |
Proppant grain density in lbm/gal, ppg |
FSC_Ce |
$B$21 |
End-of-job concentration in the slurry, M/(η·Vi), ppg |
FSC_CaEnd |
$B$22 |
End-of-job proppant added to clean fluid, ppga |
FSC_Placed |
$B$24 |
Proppant the stages place, lbm |
FSC_Flush |
$B$25 |
Flush, the casing to the top perforation, bbl |
FSC_Fluid |
$B$26 |
Clean fluid, pad, stages and flush, bbl |
FSC_Pumped |
$B$27 |
Volume pumped, slurry and flush, bbl |
FSC_Time |
$B$28 |
Treatment time to the end of the flush, min |
FSC_MaxStage |
$B$29 |
Highest stage concentration, the last stage's, ppga |
FSC_EtaCheck |
$B$30 |
Efficiency check verdict |
FSC_EtaCheckNote |
$C$30 |
Efficiency check comment |
FSC_BalanceCheck |
$B$31 |
Proppant balance check verdict |
FSC_BalanceCheckNote |
$C$31 |
Proppant balance check comment |
FSC_BlenderCheck |
$B$32 |
Blender check verdict |
FSC_BlenderCheckNote |
$C$32 |
Blender check comment |
FSC_Results |
$B$15:$B$32 |
The pad and the ramp's end concentration, the job totals and treatment time, and the three checks |
FSC_N |
$B$36 |
Proppant stages, each of equal slurry volume |
FSC_BalTol |
$B$37 |
Stages' proppant within this share of the mass |
FSC_Stages |
$A$44:$I$53 |
The pad, the eight proppant stages and the flush: start, end, slurry, clean fluid, concentration, proppant added and placed |
FSC_Ramp |
$A$59:$C$76 |
Each stage's start and end time, its concentration added, and Nolte's continuous ramp at those times |
Details
| Inserts | 76 rows × 9 columns |
| Category | Hydraulic Fracturing |
| For agents and tools | Descriptor (.md) |