Spline Interpolation — PVT Table Application
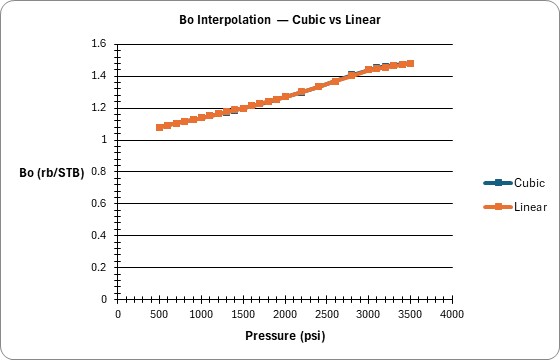
Demonstrates cubic and linear spline interpolation on a real petroleum engineering problem: interpolating Bo (oil formation volume factor) between lab measurement pressures. Shows where cubic interpolation matters most — at high-curvature regions of the PVT curve.
Spline Interpolation
Excel workbook
Inputs
Named cells you can edit — every result recalculates from them.
| Name | Description | Default | Unit |
|---|---|---|---|
QueryP |
Query Pressure | 1750 | psi |
2 sheets, shown with the values the file opens with
| A | B | C | D | E | F | |
|---|---|---|---|---|---|---|
| 1 | PVT Lab Data — Oil Formation Volume Factor | |||||
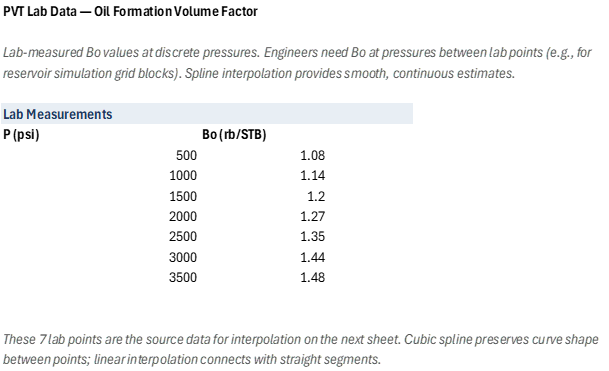
| 2 | Lab-measured Bo values at discrete pressures. Engineers need Bo at pressures between lab points (e.g., for reservoir simulation grid blocks). Spline interpolation provides smooth, continuous estimates. | |||||
| 3 | ||||||
| 4 | Lab Measurements | |||||
| 5 | P (psi) | Bo (rb/STB) | ||||
| 6 | 500 | 1.08 | ||||
| 7 | 1000 | 1.14 | ||||
| 8 | 1500 | 1.2 | ||||
| 9 | 2000 | 1.27 | ||||
| 10 | 2500 | 1.35 | ||||
| 11 | 3000 | 1.44 | ||||
| 12 | 3500 | 1.48 | ||||
| 13 | ||||||
| 14 | These 7 lab points are the source data for interpolation on the next sheet. Cubic spline preserves curve shape between points; linear interpolation connects with straight segments. |
| A | B | C | D | E | F | |
|---|---|---|---|---|---|---|
| 1 | Cubic vs Linear Interpolation of Bo | |||||
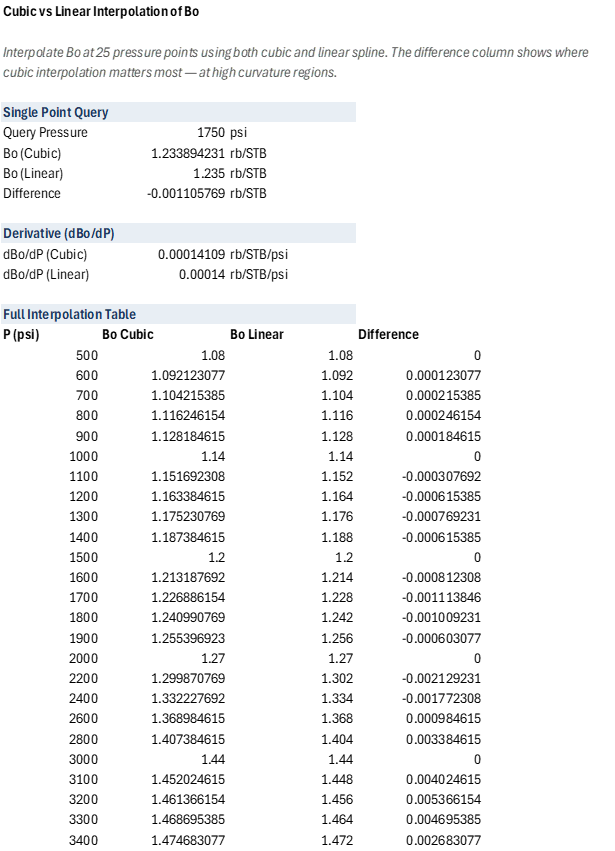
| 2 | Interpolate Bo at 25 pressure points using both cubic and linear spline. The difference column shows where cubic interpolation matters most — at high curvature regions. | |||||
| 3 | ||||||
| 4 | Single Point Query | |||||
| 5 | Query Pressure | 1750 | psi | |||
| 6 | Bo (Cubic) | 1.233894231 | rb/STB | |||
| 7 | Bo (Linear) | 1.235 | rb/STB | |||
| 8 | Difference | -0.001105769231 | rb/STB | |||
| 9 | ||||||
| 10 | Derivative (dBo/dP) | |||||
| 11 | dBo/dP (Cubic) | 0.0001410897436 | rb/STB/psi | |||
| 12 | dBo/dP (Linear) | 0.00014 | rb/STB/psi | |||
| 13 | ||||||
| 14 | Full Interpolation Table | |||||
| 15 | P (psi) | Bo Cubic | Bo Linear | Difference | ||
| 16 | 500 | 1.08 | 1.08 | 0 | ||
| 17 | 600 | 1.092123077 | 1.092 | 0.0001230769231 | ||
| 18 | 700 | 1.104215385 | 1.104 | 0.0002153846154 | ||
| 19 | 800 | 1.116246154 | 1.116 | 0.0002461538462 | ||
| 20 | 900 | 1.128184615 | 1.128 | 0.0001846153846 | ||
| 21 | 1000 | 1.14 | 1.14 | 0 | ||
| 22 | 1100 | 1.151692308 | 1.152 | -0.0003076923077 | ||
| 23 | 1200 | 1.163384615 | 1.164 | -0.0006153846154 | ||
| 24 | 1300 | 1.175230769 | 1.176 | -0.0007692307692 | ||
| 25 | 1400 | 1.187384615 | 1.188 | -0.0006153846154 | ||
| 26 | 1500 | 1.2 | 1.2 | 0 | ||
| 27 | 1600 | 1.213187692 | 1.214 | -0.0008123076923 | ||
| 28 | 1700 | 1.226886154 | 1.228 | -0.001113846154 | ||
| 29 | 1800 | 1.240990769 | 1.242 | -0.001009230769 | ||
| 30 | 1900 | 1.255396923 | 1.256 | -0.0006030769231 | ||
| 31 | 2000 | 1.27 | 1.27 | 0 | ||
| 32 | 2200 | 1.299870769 | 1.302 | -0.002129230769 | ||
| 33 | 2400 | 1.332227692 | 1.334 | -0.001772307692 | ||
| 34 | 2600 | 1.368984615 | 1.368 | 0.0009846153846 | ||
| 35 | 2800 | 1.407384615 | 1.404 | 0.003384615385 | ||
| 36 | 3000 | 1.44 | 1.44 | 0 | ||
| 37 | 3100 | 1.452024615 | 1.448 | 0.004024615385 | ||
| 38 | 3200 | 1.461366154 | 1.456 | 0.005366153846 | ||
| 39 | 3300 | 1.468695385 | 1.464 | 0.004695384615 | ||
| 40 | 3400 | 1.474683077 | 1.472 | 0.002683076923 | ||
| 41 | 3500 | 1.48 | 1.48 | 0 | ||
| 42 | ||||||
| 43 | ||||||
| 44 | ||||||
| 45 | ||||||
| 46 | ||||||
| 47 | ||||||
| 48 | ||||||
| 49 | ||||||
| 50 | ||||||
| 51 | ||||||
| 52 | ||||||
| 53 | ||||||
| 54 | ||||||
| 55 | ||||||
| 56 | ||||||
| 57 | ||||||
| 58 | ||||||
| 59 | ||||||
| 60 |
| Name | Refers To | Comment |
|---|---|---|
| QueryP | Interpolation!$B$5 |
| Opens in | Needs the Petroleum Office add-in: its PO functions show #NAME? without it once Excel recalculates. |
| Functions used | PO.Spline.Cubic.DiffPO.Spline.Cubic.InterpPO.Spline.Linear.DiffPO.Spline.Linear.Interp |
| File | SplineFunctions.xlsx, 11 KB |
| Category | Reservoir |
| For agents and tools | Structure (.json) · Descriptor (.md) |