PVT Lab Report QC
Description
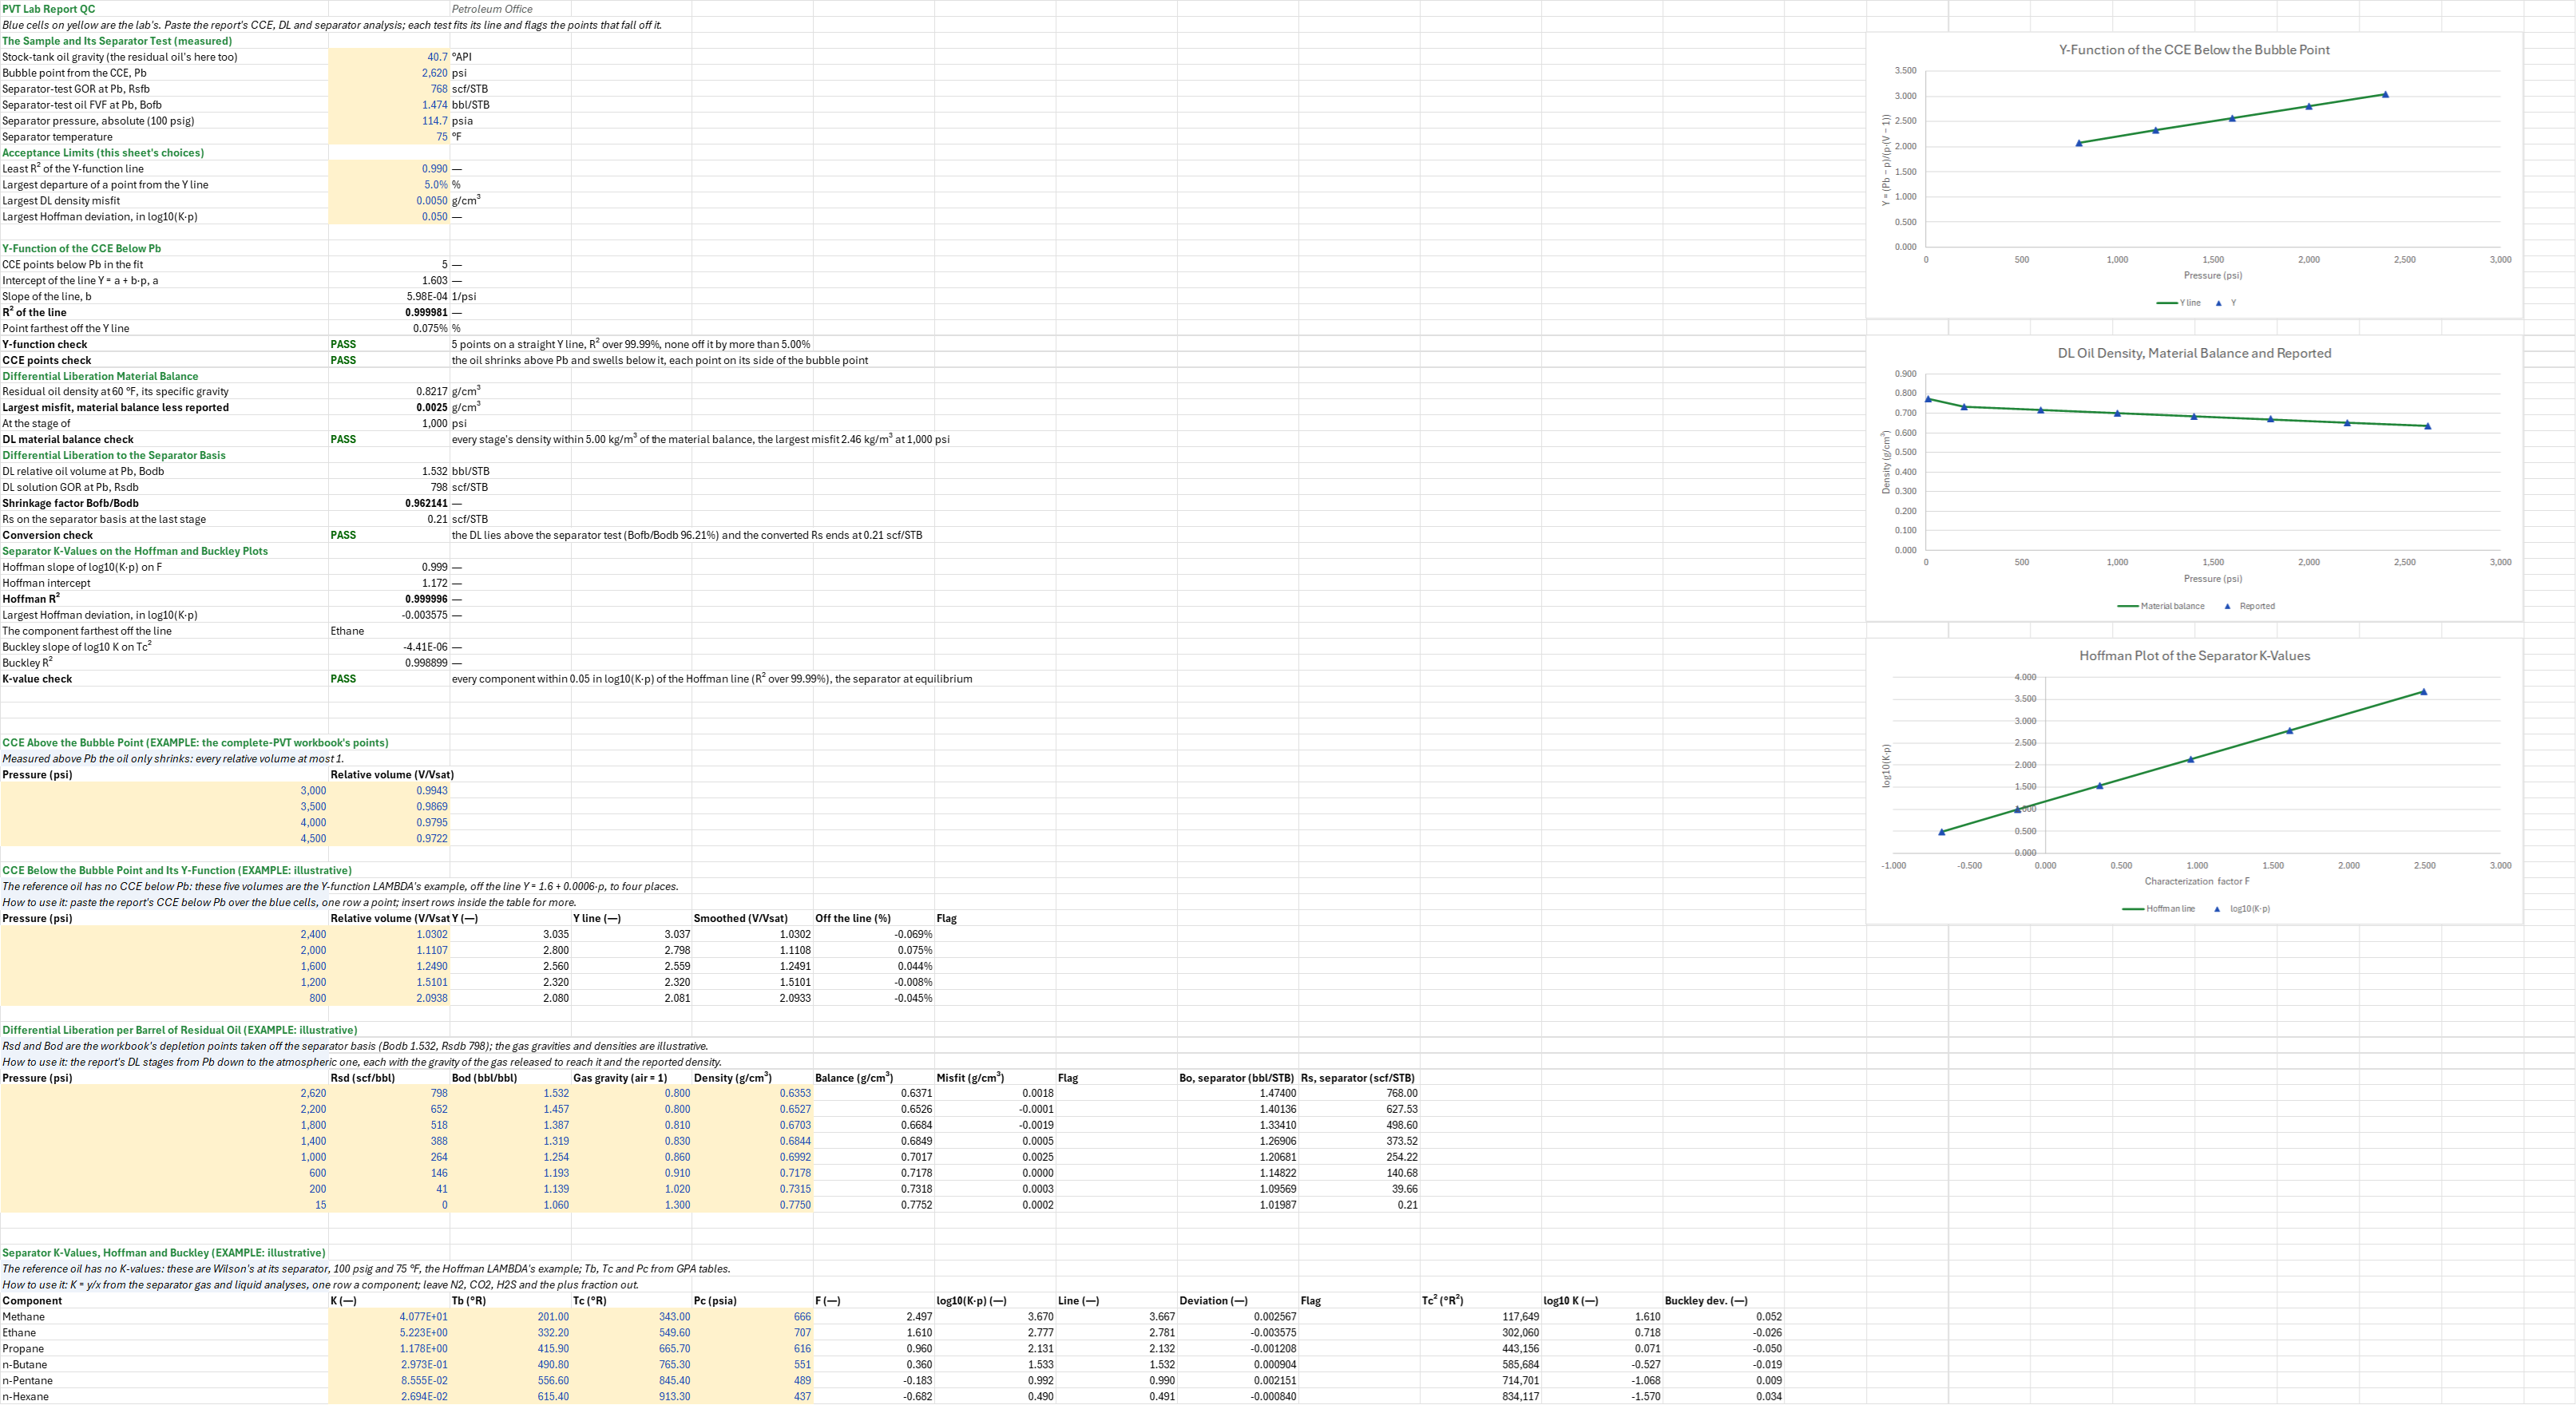
Is the PVT report fit to build a black-oil table from? You enter the sample's gravity, bubble point and separator test, and paste the report's CCE, differential liberation (DL) and separator K-values. The sheet runs the four standard consistency tests on the one sample: Standing's Y-function, the DL material balance, the Hoffman-Crump-Hocott plot and Buckley's plot. You read off each test's line and fit, every point that falls off its line, and the DL converted to the separator basis.
Parameters:
- The sample: the stock-tank gravity
LQC_API(the residual oil's here too), the CCE bubble pointLQC_Pb, the separator test's GORLQC_Rsfband FVFLQC_Bofbat Pb, and the separator's pressureLQC_SepP(psia) and temperatureLQC_SepT - Acceptance limits (this sheet's choices): the least R² of the Y line
LQC_R2Min, the largest departure of a point from itLQC_YTol, the largest DL density misfitLQC_RhoTol(g/cm³), and the largest Hoffman deviationLQC_DevMaxin log10(K·p) - Tables: the CCE above Pb (
LQC_AboveP,LQC_AboveV) and below it (LQC_CceP,LQC_CceV); the DL stages (LQC_DlP,LQC_DlRsd,LQC_DlBod, the gravity of the gas released to reach eachLQC_DlGg, and the reported densityLQC_DlRho); the separator components (LQC_Comp,LQC_K,LQC_Tb,LQC_Tc,LQC_Pc)
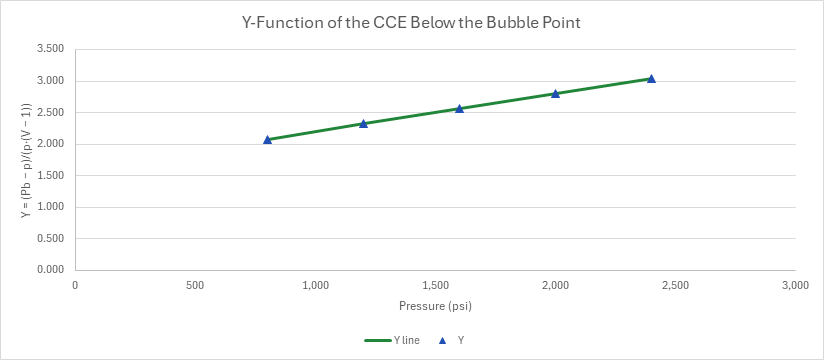
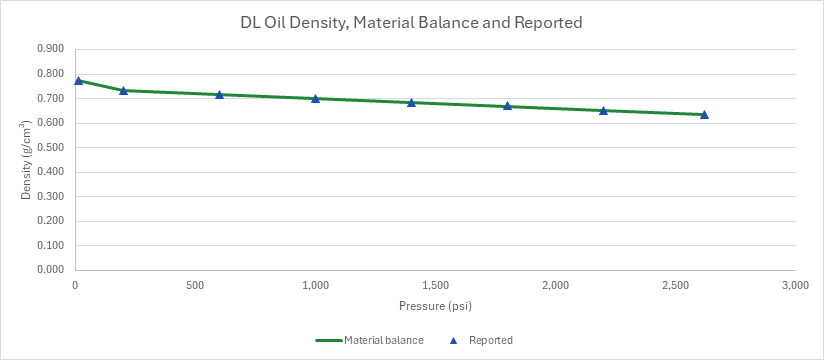
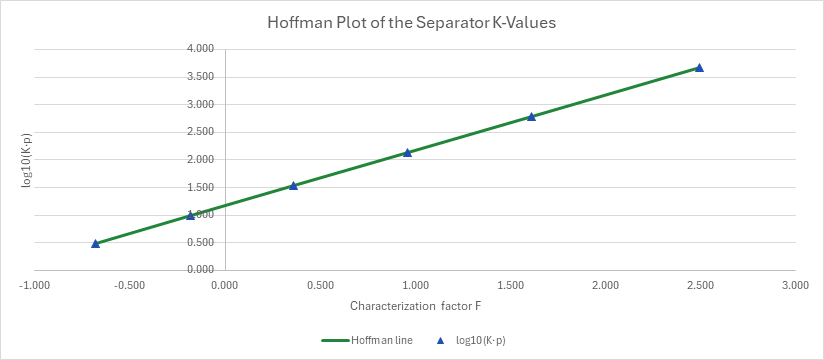
How to use it: Paste the report's CCE below Pb, its DL stages from Pb to the atmospheric one, and K = y/x from the separator gas and liquid analyses over the blue cells, and set Pb, Rsfb, Bofb and the separator to the report's. Use the residual oil's own gravity for the material balance when the report gives it. Leave N2, CO2, H2S and the plus fraction out of the K-value plots. Three charts show the Y-function with its line, the DL density by material balance against the reported one, and the Hoffman plot.
Method:
- Y-function. For each CCE point below Pb, Y = (Pb − p)/(p·(V − 1)). It is near a straight line in pressure for a black oil, so the least-squares line Y = a + b·p and its R² test the whole set, and each point's Y over the line's, less 1, tests the point. The smoothed volume is 1 + (Pb − p)/(p·(a + b·p)).
- CCE points. Above Pb the oil only shrinks (V ≤ 1); below it it swells (V > 1). A point on the wrong side of the typed Pb is a FAIL: Pb or the table is wrong.
- DL material balance. The DL is checked by mass: each stage's oil density is rebuilt from the residual oil and the gas released below it and set against the reported one. The residual oil weighs ρr × 350.51 lb a barrel, ρr its specific gravity from the API. Going up from the last stage, each stage's oil holds the stage below plus the gas released between them, 0.0764·ΔRsd·γg lb; its density is that mass over Bod × 350.51. The misfit is that density less the reported one, at each stage.
- Separator basis. The DL's Bod and Rsd are per barrel of residual oil; the separator test converts them. With Bf = Bofb/Bodb, Bo = Bod·Bf and Rs = Rsfb − (Rsdb − Rsd)·Bf (Amyx, Bass and Whiting; McCain). The DL has to lie above the separator test (Bodb > Bofb, Rsdb > Rsfb); the converted Rs at the atmospheric stage should come out near 0.
- Hoffman. For each component b = log10(Pc/14.696)/(1/Tb − 1/Tc) and F = b·(1/Tb − 1/T); log10(K·p) on F is a straight line with a slope near 1 for a separator at equilibrium, and a component off it has a bad analysis.
- Buckley. log10 K on Tc², a rougher line read beside Hoffman's.
- Checks. Y-function: R² at least the least R² set and no point off by more than the largest departure set. CCE points: each on its side of Pb. DL material balance: every misfit within the largest density misfit set. Conversion: DL above the separator test, converted Rs not below 0. K-values: every Hoffman deviation within the largest deviation set.
Example: The sample is the PVT family's reference black oil, Ahmed's oil 2: 40.7 °API, a 0.855 gravity separator gas at 100 psig (114.7 psia) and 75 °F, 220 °F, Rsb 768 scf/STB, a measured bubble point of 2,620 psi and Bob of 1.474 bbl/STB. Those are measured. The reference oil's data carry no CCE below Pb, no DL on the residual-oil basis and no K-values, so the sheet uses illustrative data and says so on each table:
- above Pb, the Complete PVT Study workbook's four CCE points (3,000 to 4,500 psi, 0.99432 to 0.97219);
- below Pb, the Y-function lambda's worked example: five volumes from 1.0302 at 2,400 psi to 2.0938 at 800 psi, off the exact line Y = 1.6 + 0.0006·p and read to four places;
- a DL per barrel of residual oil with Bodb 1.532 and Rsdb 798 scf/bbl, made so that, converted with the separator test, it gives the workbook's depletion table back (rounded to whole scf and four places), plus an atmospheric stage at 220 °F (Bod 1.06). The liberated-gas gravities rise from 0.80 to 1.30, as in the material-balance lambda's example, and the reported densities run from 0.6353 to 0.7750 g/cm³;
- Wilson's K-values for methane to n-hexane at the reference oil's own separator (40.77 to 0.0269), the Hoffman lambda's example, with the GPA boiling points and critical constants.
The five CCE points below 2,620 psi give Y from 3.035 at 2,400 psi to 2.080 at 800 psi on the line a = 1.6026, b = 5.978 × 10⁻⁴ 1/psi, R² 0.99998, the farthest point (2,000 psi) only 0.075 % off: a consistent CCE and a right bubble point. Typing 2,500 psi for Pb instead bends the line (R² 0.18, the 2,400 psi point 23 % off). The residual oil's 0.82172 g/cm³ and the DL give densities from 0.6371 g/cm³ at Pb to 0.7752 at the atmospheric stage; the largest misfit against the report is 0.0025 g/cm³ (2.46 kg/m³) at 1,000 psi, within 5 kg/m³. Bofb/Bodb is 0.96214, and the converted DL is the workbook's depletion table to within half a unit (627.53 scf/STB for its 628 at 2,200 psi, 1.40136 bbl/STB for 1.4014), ending at 0.21 scf/STB at the atmospheric stage. The Hoffman line has a slope of 0.99919, an intercept of 1.17220 and R² 0.999996, every component within 0.004 of it (ethane the farthest, its K·p 0.83 % low); Buckley's falls at −4.414 × 10⁻⁶ per °R² with R² 0.99890.
Functions used
PO.PVT.SG.Oil.FromAPI(API)
Converts API gravity to oil specific gravity, [dimensionless].
Names (63)
| Name | Refers to | Comment |
|---|---|---|
PO.FL.QC.YFunctionLAMBDA |
=LAMBDA(p, vrel, pb, output, LET(msk, (p<pb)*(vrel>1), den, p*(vrel-1)*msk+1-msk, y, (pb-p)*msk/den, nn, SUM(msk), idx, (output="Y")*1+(output="Fit")*2+(output="Vrel")*3+(output="a")*4+(output="b")*5+(output="R2")*6, IF(OR(pb<=0, ROWS(p)<>ROWS(vrel), nn<2, idx=0), NA(), LET(xa, SUM(msk*p)/nn, ya, SUM(y)/nn, sxx, SUM(msk*(p-xa)^2), sxy, SUM(msk*(p-xa)*(y-ya)), syy, SUM(msk*(y-ya)^2), sl, sxy/sxx, ic, ya-sl*xa, fit, ic+sl*p, CHOOSE(idx, MAP(msk, y, LAMBDA(mk, yv, IF(mk=1, yv, NA()))), fit, msk*(1+(pb-p)/(p*fit))+(1-msk)*vrel, ic, sl, 1-(syy-sxy^2/sxx)/(syy+(syy=0))))))) |
CCE Y-function, Y = (pb − p)/(p·(Vrel − 1)) below pb: output "Y" or "Fit" (columns), "Vrel" (smoothed relative volume, measured at or above pb), "a" and "b" of the line Y = a + b·p, or "R2". p and pb in psia. |
PO.FL.QC.MaterialBalanceLAMBDA |
=LAMBDA(rs, bod, gg, rho_r, rho, output, LET(idx, (output="Calc")*1+(output="Diff")*2+(output="Mass")*3, nn, ROWS(rs), IF(OR(idx=0, nn<2, rho_r<=0, MIN(bod)<=0, MIN(gg)<=0, MIN(rs)<0), NA(), LET(ix, SEQUENCE(nn), shf, (TRANSPOSE(ix)=ix-1)*1, rsp, MMULT(shf, rs)+(ix=1)*rs, rel, (rsp-rs)*gg, cum, MMULT((TRANSPOSE(ix)>ix)*1, rel), mass, rho_r*350.51+0.0764*cum, calc, mass/(bod*350.51), CHOOSE(idx, calc, calc-rho, mass))))) |
DL material balance: oil density (g/cm³) at each stage from rs (scf/bbl residual), bod, the released gas gravity gg and the residual oil density rho_r; output "Calc", "Diff" (Calc − reported rho) or "Mass" (lb/bbl residual oil). |
PO.FL.QC.HoffmanLAMBDA |
=LAMBDA(k, p, t, tb, tc, pc, output, LET(idx, (output="F")*1+(output="LogKp")*2+(output="Slope")*3+(output="Intercept")*4+(output="R2")*5+(output="Dev")*6, IF(OR(p<=0, t<=-459.67, idx=0, ROWS(k)<2, MIN(k)<=0, MIN(tb)<=0, MIN(tc-tb)<=0, MIN(pc)<=0), NA(), LET(ff, LOG10(pc/14.696)/(1/tb-1/tc)*(1/tb-1/(t+459.67)), yy, LOG10(k*p), nn, ROWS(k), xa, SUM(ff)/nn, ya, SUM(yy)/nn, sxx, SUM((ff-xa)^2), sxy, SUM((ff-xa)*(yy-ya)), syy, SUM((yy-ya)^2), sl, sxy/sxx, ic, ya-sl*xa, CHOOSE(idx, ff, yy, sl, ic, 1-(syy-sxy^2/sxx)/(syy+(syy=0)), yy-ic-sl*ff))))) |
Hoffman-Crump-Hocott plot of K-values at p (psia) and t (°F) with each component's Tb, Tc (°R) and pc (psia): output "F", "LogKp", "Dev" (columns), "Slope", "Intercept" or "R2" of log(K·p) against F. |
PO.FL.QC.BuckleyLAMBDA |
=LAMBDA(k, tc, output, LET(idx, (output="X")*1+(output="LogK")*2+(output="Slope")*3+(output="Intercept")*4+(output="R2")*5+(output="Dev")*6, IF(OR(idx=0, ROWS(k)<2, MIN(k)<=0, MIN(tc)<=0), NA(), LET(xx, tc^2, yy, LOG10(k), nn, ROWS(k), xa, SUM(xx)/nn, ya, SUM(yy)/nn, sxx, SUM((xx-xa)^2), sxy, SUM((xx-xa)*(yy-ya)), syy, SUM((yy-ya)^2), sl, sxy/sxx, ic, ya-sl*xa, CHOOSE(idx, xx, yy, sl, ic, 1-(syy-sxy^2/sxx)/(syy+(syy=0)), yy-ic-sl*xx))))) |
Buckley plot of K-values against critical temperature tc (°R): output "X" (Tc²), "LogK", "Dev" (columns), "Slope", "Intercept" or "R2" of log K against Tc². |
LQC_API |
$B$4 |
Stock-tank oil gravity (the residual oil's here too), °API |
LQC_Pb |
$B$5 |
Bubble point from the CCE, Pb, psi |
LQC_Rsfb |
$B$6 |
Separator-test GOR at Pb, Rsfb, scf/STB |
LQC_Bofb |
$B$7 |
Separator-test oil FVF at Pb, Bofb, bbl/STB |
LQC_SepP |
$B$8 |
Separator pressure, absolute (100 psig), psia |
LQC_SepT |
$B$9 |
Separator temperature, °F |
LQC_R2Min |
$B$11 |
Least R² of the Y-function line |
LQC_YTol |
$B$12 |
Largest departure of a point from the Y line, % |
LQC_RhoTol |
$B$13 |
Largest DL density misfit, g/cm³ |
LQC_DevMax |
$B$14 |
Largest Hoffman deviation, in log10(K·p) |
LQC_Inputs |
$B$4:$B$14 |
The oil's gravity, the CCE bubble point, the separator test's GOR, FVF, pressure and temperature, and the four acceptance limits |
LQC_YN |
$B$17 |
CCE points below Pb in the fit |
LQC_Ya |
$B$18 |
Intercept of the line Y = a + b·p, a |
LQC_Yb |
$B$19 |
Slope of the line, b, 1/psi |
LQC_YR2 |
$B$20 |
R² of the line |
LQC_YWorst |
$B$21 |
Point farthest off the Y line, % |
LQC_YCheck |
$B$22 |
Y-function check verdict |
LQC_YCheckNote |
$C$22 |
Y-function check comment |
LQC_CceCheck |
$B$23 |
CCE points check verdict |
LQC_CceCheckNote |
$C$23 |
CCE points check comment |
LQC_RhoR |
$B$25 |
Residual oil density at 60 °F, its specific gravity, g/cm³ |
LQC_RhoMax |
$B$26 |
Largest misfit, material balance less reported, g/cm³ |
LQC_RhoAt |
$B$27 |
At the stage of, psi |
LQC_MbCheck |
$B$28 |
DL material balance check verdict |
LQC_MbCheckNote |
$C$28 |
DL material balance check comment |
LQC_Bodb |
$B$30 |
DL relative oil volume at Pb, Bodb, bbl/STB |
LQC_Rsdb |
$B$31 |
DL solution GOR at Pb, Rsdb, scf/STB |
LQC_Bf |
$B$32 |
Shrinkage factor Bofb/Bodb |
LQC_RsLast |
$B$33 |
Rs on the separator basis at the last stage, scf/STB |
LQC_ConvCheck |
$B$34 |
Conversion check verdict |
LQC_ConvCheckNote |
$C$34 |
Conversion check comment |
LQC_HofSlope |
$B$36 |
Hoffman slope of log10(K·p) on F |
LQC_HofInt |
$B$37 |
Hoffman intercept |
LQC_HofR2 |
$B$38 |
Hoffman R² |
LQC_HofWorst |
$B$39 |
Largest Hoffman deviation, in log10(K·p) |
LQC_HofComp |
$B$40 |
The component farthest off the line |
LQC_BucSlope |
$B$41 |
Buckley slope of log10 K on Tc² |
LQC_BucR2 |
$B$42 |
Buckley R² |
LQC_KCheck |
$B$43 |
K-value check verdict |
LQC_KCheckNote |
$C$43 |
K-value check comment |
LQC_Results |
$B$17:$B$43 |
Y-function points, line, R², farthest point off it, Y and CCE checks; residual oil density, the worst DL density misfit, its stage and check; Bodb, Rsdb, shrinkage, the last converted Rs and check; Hoffman and Buckley lines, worst component, K-value check |
LQC_AboveP |
$A$50:$A$53 |
CCE pressures above Pb, psi |
LQC_AboveV |
$B$50:$B$53 |
CCE relative volumes above Pb, V/Vsat |
LQC_Curve |
$C$59:$G$63 |
Each CCE point below Pb: its Y, the fitted line, the smoothed relative volume, how far off the line it is, and its flag |
LQC_CceP |
$A$59:$A$63 |
CCE pressures below Pb, psi |
LQC_CceV |
$B$59:$B$63 |
CCE relative volumes below Pb, V/Vsat |
LQC_Dl |
$F$69:$J$76 |
Each DL stage's density by the material balance, its misfit against the reported one and its flag, and its Bo and Rs on the separator basis |
LQC_DlP |
$A$69:$A$76 |
DL stage pressures, psi |
LQC_DlRsd |
$B$69:$B$76 |
DL solution GOR per barrel of residual oil, scf/bbl |
LQC_DlBod |
$C$69:$C$76 |
DL relative oil volume, bbl per barrel of residual oil |
LQC_DlGg |
$D$69:$D$76 |
Gravity of the gas released in reaching each stage, air = 1 |
LQC_DlRho |
$E$69:$E$76 |
Reported oil density at each stage, g/cm³ |
LQC_SepRs |
$J$69:$J$76 |
Rs on the separator basis at each stage, scf/STB |
LQC_Kvalues |
$F$83:$M$88 |
Each component's Hoffman F, log10(K·p), the line, its deviation and flag, and Buckley's Tc², log10 K and deviation |
LQC_Comp |
$A$83:$A$88 |
Separator components, methane to n-hexane |
LQC_K |
$B$83:$B$88 |
Equilibrium ratio y/x of each component |
LQC_Tb |
$C$83:$C$88 |
Normal boiling point of each component, °R |
LQC_Tc |
$D$83:$D$88 |
Critical temperature of each component, °R |
LQC_Pc |
$E$83:$E$88 |
Critical pressure of each component, psia |
Details
| Inserts | 88 rows × 13 columns |
| Category | PVT Properties |
| For agents and tools | Descriptor (.md) |