Oil Reservoir Forecast below the Bubble Point (Tarner-Tracy)
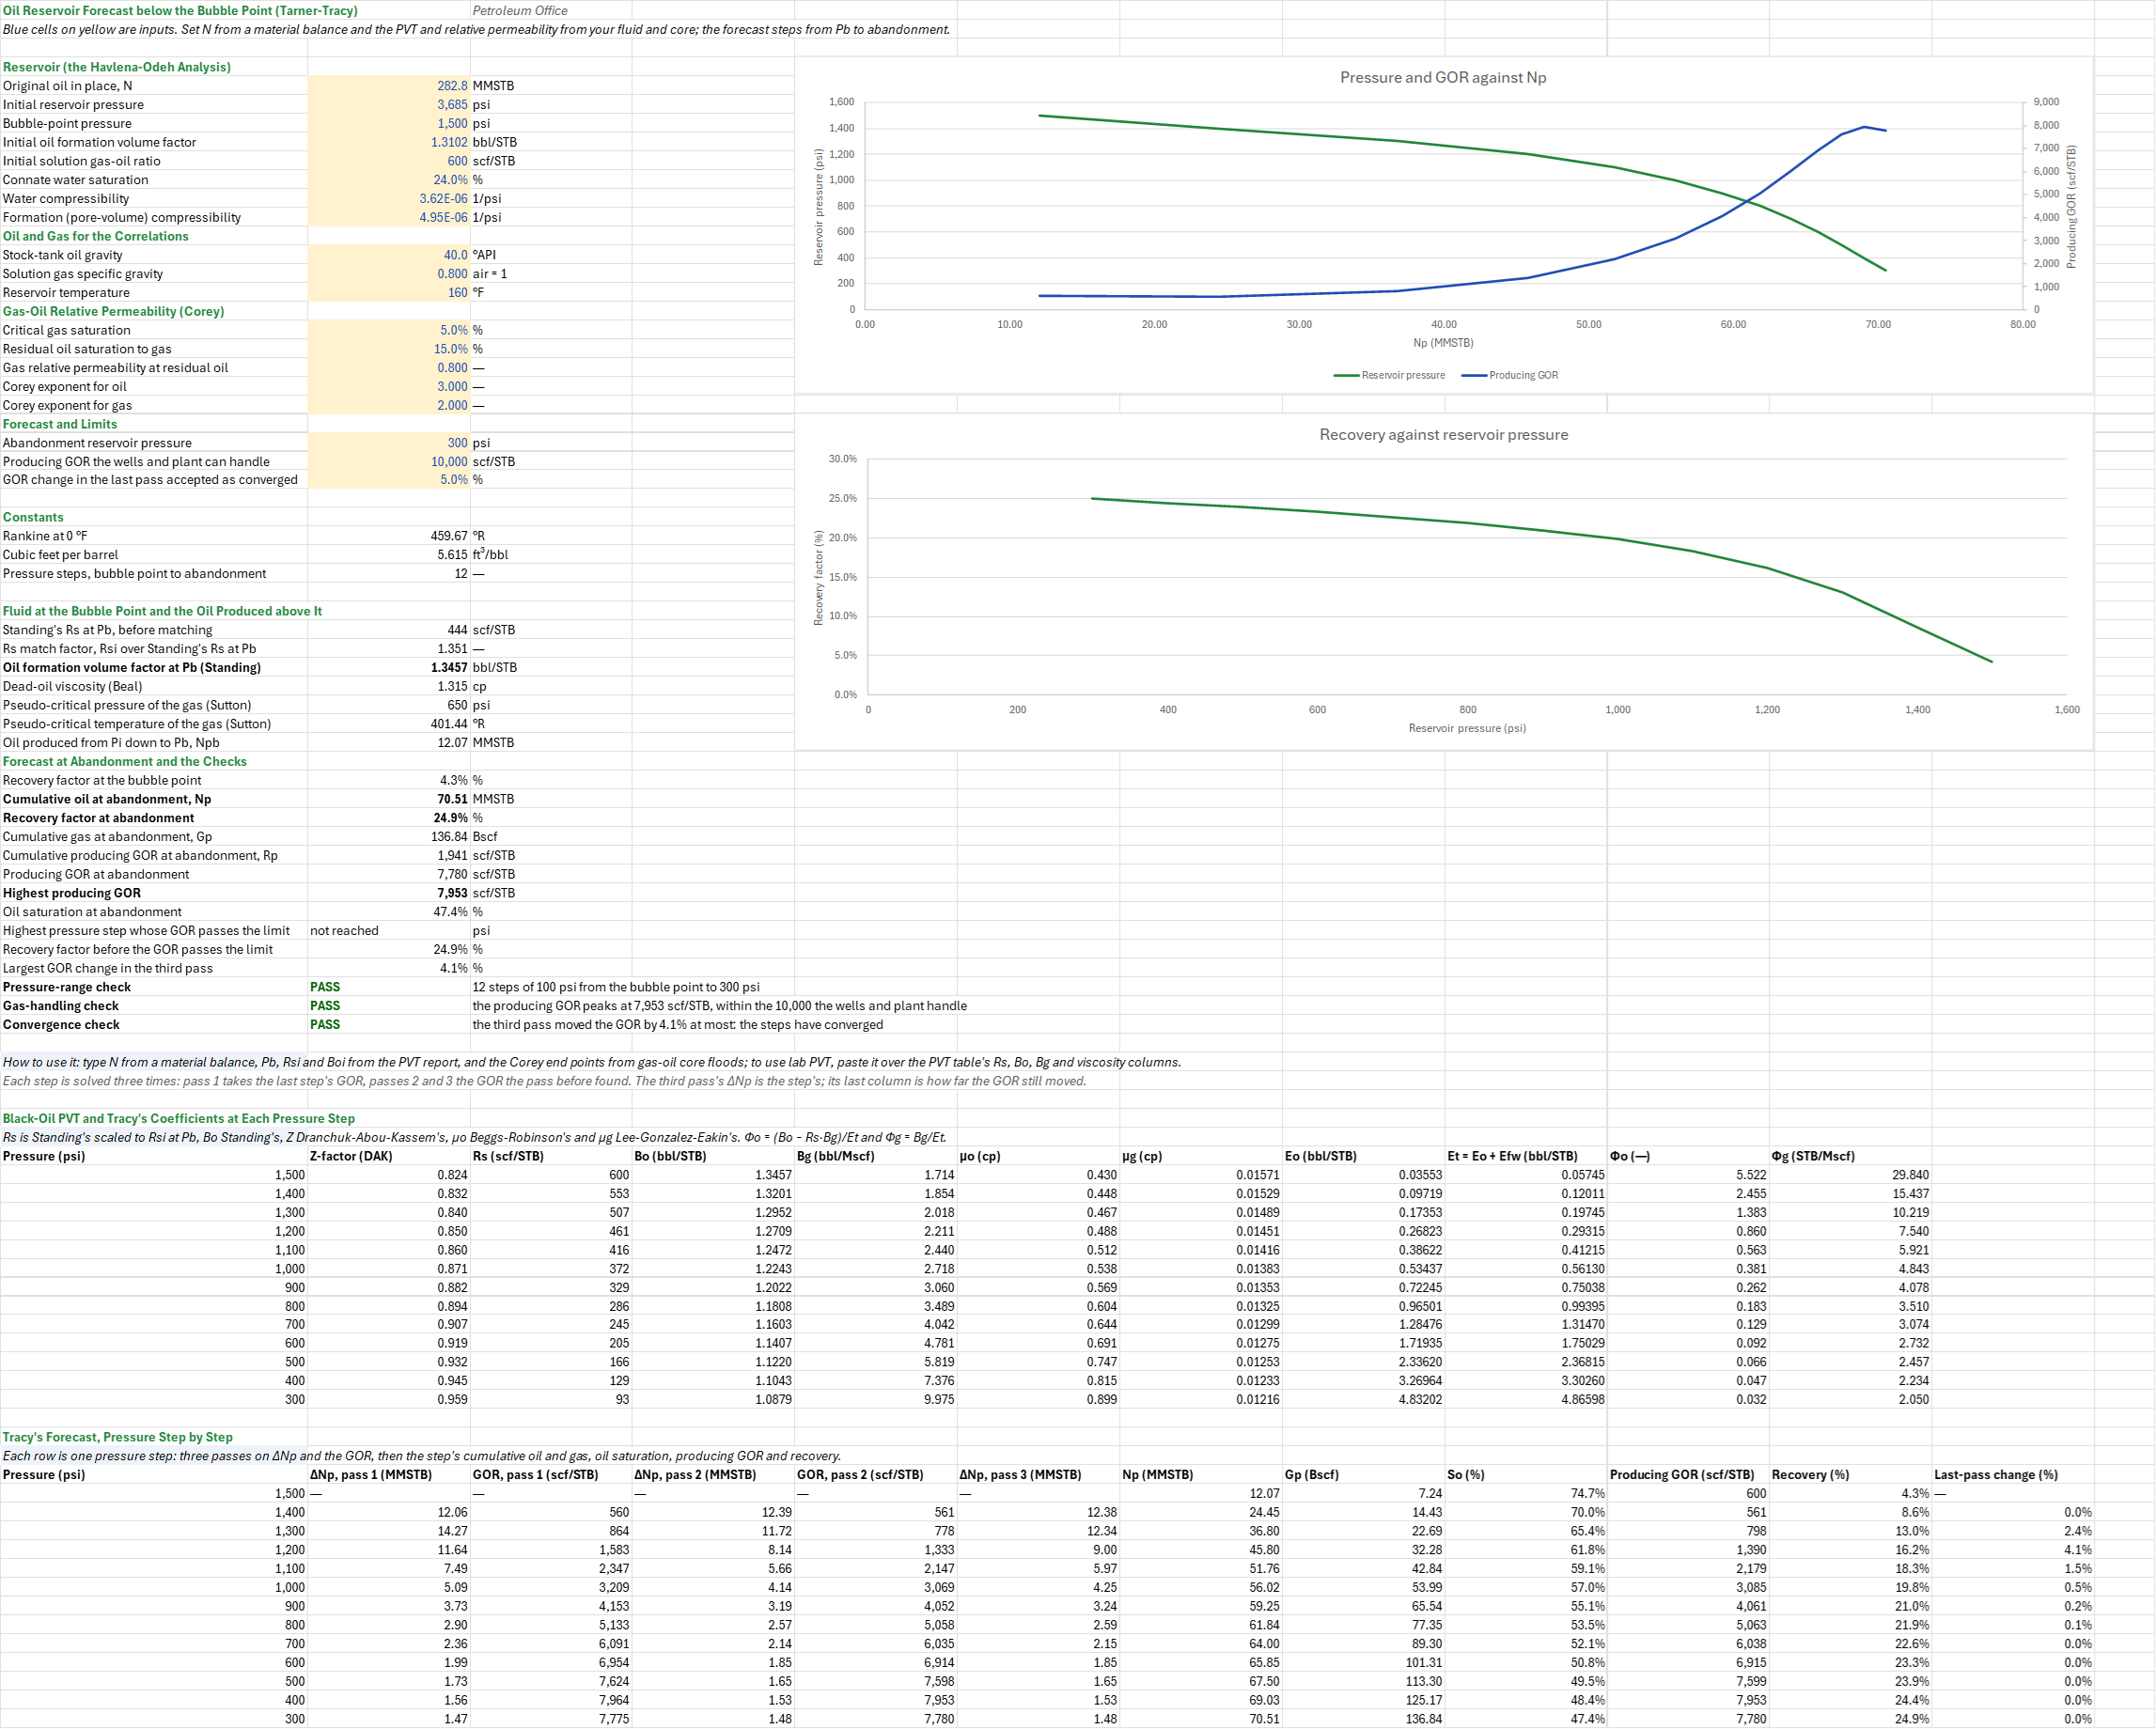
Description
How much oil will a solution-gas-drive reservoir give up as its pressure falls below the bubble point, and how fast will the gas-oil ratio climb? You enter the oil in place, the initial and bubble-point pressures with Boi and Rsi, the connate water and compressibilities, the oil and gas gravities and temperature for the PVT, Corey gas-oil relative permeability, an abandonment pressure and a gas-handling limit. You read off the cumulative oil and gas, oil saturation, producing GOR and recovery factor at each pressure step.
The sheet forecasts it with Tracy's form of Tarner's material-balance method. It steps the reservoir pressure down from the bubble point to an abandonment pressure in twelve equal steps. At each step it computes the black-oil PVT, Tracy's coefficients Φo and Φg, and the oil the step produces. The producing GOR at the end of a step depends on the oil saturation, which depends on the oil produced, so each step is solved by three explicit passes that the table shows side by side. Each step then gives the cumulative oil and gas, the oil saturation, the producing GOR and the recovery factor.
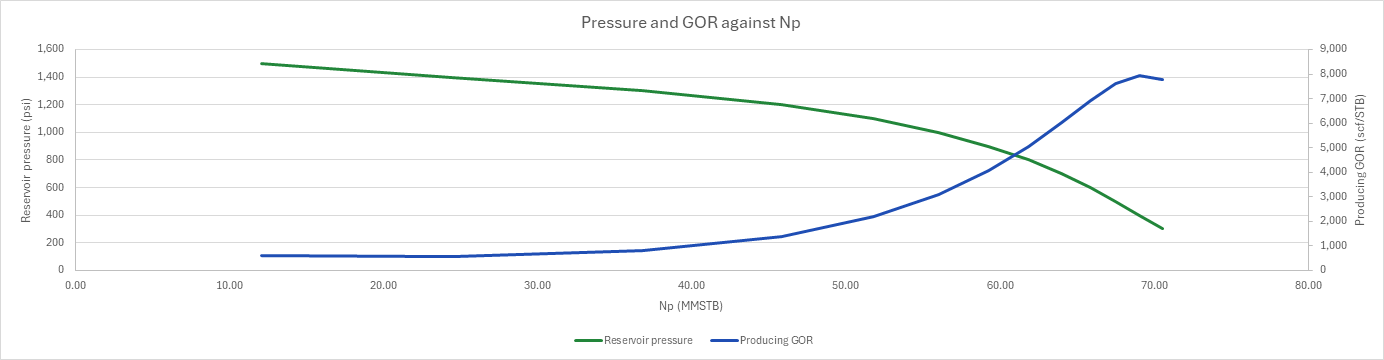
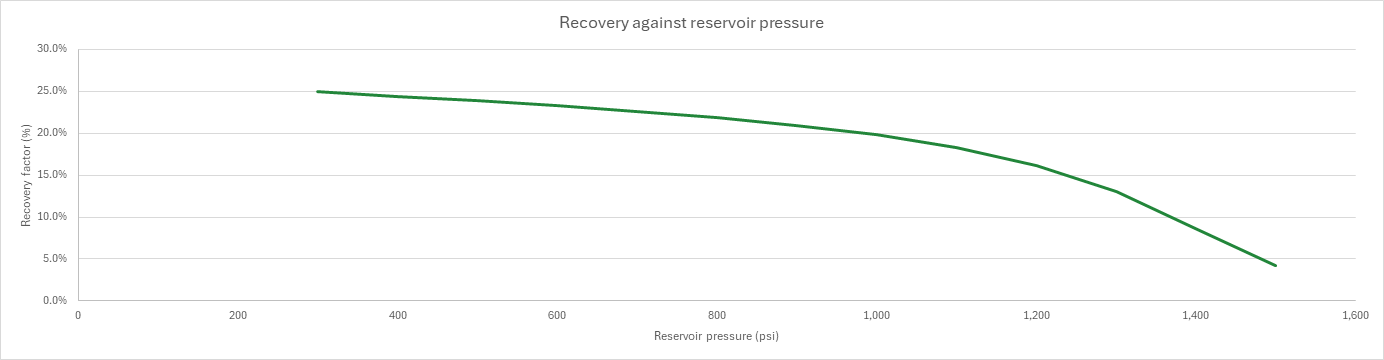
One chart draws the reservoir pressure and the producing GOR against the cumulative oil; a second draws the recovery factor against pressure. Three checks read the result. The pressure-range check fails when the abandonment pressure is not below the bubble point. The gas-handling check fails when the producing GOR passes the limit the wells and plant can handle, and names the pressure and recovery where it does. The convergence check warns when the third pass still moved the GOR by more than the limit.
Parameters:
- Reservoir: the original oil in place
OF_N(MMSTB), the initial and bubble-point pressuresOF_PiandOF_Pb(psi), BoiOF_Boi(bbl/STB) and RsiOF_Rsi(scf/STB) at Pi, the connate water saturationOF_Swc, and the water and pore-volume compressibilitiesOF_cwandOF_cf(1/psi). The Oil Material Balance (Havlena-Odeh) sheet gives N. - Correlations: the stock-tank oil gravity
OF_API, the solution gas gravityOF_GasSGand the reservoir temperatureOF_T(°F) - Relative permeability: Corey gas-oil curves from the critical gas saturation
OF_Sgc, the residual oil saturation to gasOF_Sorg, the end pointOF_KrgMaxand the exponentsOF_NoExpandOF_NgExp. The Corey Relative Permeability Curves and Honarpour Gas-Oil Relative Permeability sheets fit or estimate them. - Forecast and limits: the abandonment pressure
OF_Pab(psi), the producing GOR the wells and plant can handleOF_GorMax(scf/STB), and the GOR change in the third pass accepted as convergedOF_MoveTol
How to use it: The default reservoir's PVT below the bubble point and its relative permeability are synthetic, from correlations. Type N from a material balance and Pb, Rsi and Boi from the PVT report. Paste a differential liberation, adjusted to separator conditions, over the PVT table's Rs, Bo and Bg columns, and measured viscosities over μo and μg. Fit the Corey parameters to gas-oil core floods or to the field's GOR history, the most uncertain input of the method. Keep the steps small where the GOR climbs fastest, just after the gas saturation passes Sgc.
Method: Below the bubble point, with no gas cap and no water influx, the material balance is N·Et = Np·(Bo − Rs·Bg) + Gp·Bg, with Et = Eo + Efw. Eo = (Bo − Boi) + (Rsi − Rs)·Bg is the oil and its dissolved gas, and Efw = Boi·(cw·Swc + cf)/(1 − Swc)·(Pi − p) keeps the rock and water expansion. Tracy divides by Et: N = Np·Φo + Gp·Φg, with Φo = (Bo − Rs·Bg)/Et and Φg = Bg/Et. The oil produced from Pi to Pb, Npb = N·(Bob − Boi + Efw)/Bob, starts the forecast, with all its gas still in solution.
From one pressure step to the next, ΔNp = (N − Np·Φo − Gp·Φg)/(Φo + R̄·Φg), with Np and Gp at the step before and R̄ the average of the producing GOR there and at this step. The oil saturation after the step is So = (1 − Swc)·(1 − Np/N)·Bo/Boi, and the producing GOR is R = Rs + (krg/kro)·μo·Bo/(μg·Bg). Corey's curves give krg = krg,max·((Sg − Sgc)/(1 − Swc − Sorg − Sgc))^ng above Sgc and 0 below it, and kro = ((So − Sorg)/(1 − Swc − Sorg))^no. Pass 1 takes R̄ from the last step's GOR alone; passes 2 and 3 take this step's GOR from the pass before. The third pass's ΔNp is the step's, its Gp grows by ΔNp·R̄, and the GOR is evaluated at the step's final So. The last column is the relative change between the GOR the third pass used and the GOR at the final So.
- PVT: Rs is Standing's correlation scaled so that it equals Rsi at Pb, Bo Standing's saturated-oil correlation at that Rs, Z Dranchuk-Abou-Kassem's with Sutton's pseudo-criticals, Bg from its definition, μo Beggs-Robinson's saturated-oil viscosity over Beal's dead oil, and μg Lee-Gonzalez-Eakin's.
Example: The reservoir is the one the Oil Material Balance (Havlena-Odeh) sheet analyses: N = 282.8 MMSTB, its regression OOIP, 3,685 psi initially with a 1,500 psi bubble point, Boi 1.3102 bbl/STB, Rsi 600 scf/STB, Swc 24 %, cw 3.62 × 10⁻⁶ and cf 4.95 × 10⁻⁶ 1/psi. Below the bubble point the sheet takes a 40 °API oil and a 0.80 gravity gas at 160 °F. Standing's correlation gives 444 scf/STB at 1,500 psi, so Rs is scaled by 1.3515, and Bob is 1.3457 bbl/STB, close to the 1.34 that the material balance sheet's Bo history reaches at Pb. The Corey curves take Sgc 5 %, Sorg 15 %, krg,max 0.8, no = 3 and ng = 2. The forecast runs to 300 psi in twelve steps of 100 psi.
Above the bubble point the reservoir gave up 12.07 MMSTB, 4.27 % of N. Below it, the GOR first falls to 561 scf/STB at 1,400 psi, as gas comes out of solution but stays below Sgc, then climbs to 2,179 scf/STB at 1,100 psi and peaks at 7,953 scf/STB at 400 psi. At 300 psi the reservoir has produced 70.51 MMSTB, a recovery of 24.9 %, and 136.8 Bscf of gas, a cumulative GOR of 1,941 scf/STB, leaving So at 47.4 %. The peak GOR is within the 10,000 scf/STB limit. The third pass moved the GOR by at most 4.1 %, at 1,200 psi, within the 5 % tolerance. Solving every step to full convergence gives 70.39 MMSTB, 24.89 %, so three passes are within 0.2 %. A gas plant that takes only 3,000 scf/STB stops the forecast at 1,000 psi, at 18.3 % recovery. A critical gas saturation of 10 % holds the gas back longer: recovery rises to 28.0 %, but the GOR jumps faster once the gas flows and the third pass still moves it by 11.5 %, past the tolerance, and the convergence check warns.
Functions used
PO.PVT.Rs.ByStanding(SG_gas, API, P, T_degF)
Calculates solution gas-oil ratio using Standing correlation (1947), the exact inverse of Standing Pb, P <= Pb, [SCF/STB].
PO.PVT.Bo.Sat.ByStanding(SG_gas, API, Rs, T_degF)
Calculates oil formation volume factor using Standing (1947) correlation, P <= Pb, [bbl/STB].
PO.PVT.Uo.Dead.ByBeal(API, T_degF)
Calculates dead oil viscosity using Beal (1946) correlation. Standing's curve fit of Beal's graphical correlation. Best performer per Fotias (2022), [cP].
PO.PVT.Ppc.BySutton(SG_gas)
Calculates pseudo-critical pressure of hydrocarbon gas using Sutton (1985) correlation, [psi].
PO.PVT.Tpc.BySutton(SG_gas)
Calculates pseudo-critical temperature of hydrocarbon gas using Sutton (1985) correlation, [degR].
PO.MBE.Exp.Efw(Boi, cw, cf, Swc, m, deltaP)
Calculates formation/water expansion term (Efw), [bbl/STB]. Accounts for rock compaction and connate water expansion.
PO.PVT.Z.ByDAK(Ppr, Tpr)
Calculates gas compressibility factor (Z) using Dranchuk and Abou-Kassem (1975) equation of state, [dimensionless].
PO.PVT.Bg.ByDefinition(P, T_degR, Z)
Calculates gas formation volume factor, [rcf/scf].
PO.PVT.Uo.Sat.ByBeggsRobinson(Rs, Uo_dead)
Calculates oil viscosity with solution gas using Beggs and Robinson (1975) correlation, P <= Pb, [cP].
PO.PVT.Ug.ByLGE(Z, SG_gas, P, T_degR)
Calculates gas viscosity using Lee, Gonzales and Eakin (1966) correlation, [cP].
PO.MBE.Exp.Eo(Bo, Boi, Rs, Rsi, Bg)
Calculates oil and dissolved gas expansion term (Eo), [bbl/STB]. Eo = (Bo-Boi) + (Rsi-Rs)*Bg.
PO.MBE.Exp.Et(Eo, Eg, Efw, m)
Calculates total expansion term (Et), [bbl/STB]. Et = Eo + m*Eg + Efw.
Names (51)
| Name | Refers to | Comment |
|---|---|---|
OF_N |
$B$5 |
Original oil in place, N, MMSTB |
OF_Pi |
$B$6 |
Initial reservoir pressure, psi |
OF_Pb |
$B$7 |
Bubble-point pressure, psi |
OF_Boi |
$B$8 |
Initial oil formation volume factor, bbl/STB |
OF_Rsi |
$B$9 |
Initial solution gas-oil ratio, scf/STB |
OF_Swc |
$B$10 |
Connate water saturation, % |
OF_cw |
$B$11 |
Water compressibility, 1/psi |
OF_cf |
$B$12 |
Formation (pore-volume) compressibility, 1/psi |
OF_API |
$B$14 |
Stock-tank oil gravity, °API |
OF_GasSG |
$B$15 |
Solution gas specific gravity, air = 1 |
OF_T |
$B$16 |
Reservoir temperature, °F |
OF_Sgc |
$B$18 |
Critical gas saturation, % |
OF_Sorg |
$B$19 |
Residual oil saturation to gas, % |
OF_KrgMax |
$B$20 |
Gas relative permeability at residual oil |
OF_NoExp |
$B$21 |
Corey exponent for oil |
OF_NgExp |
$B$22 |
Corey exponent for gas |
OF_Pab |
$B$24 |
Abandonment reservoir pressure, psi |
OF_GorMax |
$B$25 |
Producing GOR the wells and plant can handle, scf/STB |
OF_MoveTol |
$B$26 |
GOR change in the last pass accepted as converged, % |
OF_Inputs |
$B$5:$B$26 |
The OOIP and initial conditions, the oil and gas for the correlations, the Corey curves, the abandonment pressure and the check limits |
OF_R0 |
$B$29 |
Rankine at 0 °F, °R |
OF_CfPerBbl |
$B$30 |
Cubic feet per barrel, ft³/bbl |
OF_Steps |
$B$31 |
Pressure steps, bubble point to abandonment |
OF_RsStd |
$B$34 |
Standing's Rs at Pb, before matching, scf/STB |
OF_RsFactor |
$B$35 |
Rs match factor, Rsi over Standing's Rs at Pb |
OF_Bob |
$B$36 |
Oil formation volume factor at Pb (Standing), bbl/STB |
OF_Uod |
$B$37 |
Dead-oil viscosity (Beal), cp |
OF_Ppc |
$B$38 |
Pseudo-critical pressure of the gas (Sutton), psi |
OF_Tpc |
$B$39 |
Pseudo-critical temperature of the gas (Sutton), °R |
OF_Npb |
$B$40 |
Oil produced from Pi down to Pb, Npb, MMSTB |
OF_Initial_Results |
$B$34:$B$40 |
Standing's Rs at Pb and the match factor, Bob, the dead-oil viscosity, the gas's pseudo-criticals and the oil produced above Pb |
OF_RFb |
$B$42 |
Recovery factor at the bubble point, % |
OF_Np |
$B$43 |
Cumulative oil at abandonment, Np, MMSTB |
OF_RF |
$B$44 |
Recovery factor at abandonment, % |
OF_Gp |
$B$45 |
Cumulative gas at abandonment, Gp, Bscf |
OF_Rp |
$B$46 |
Cumulative producing GOR at abandonment, Rp, scf/STB |
OF_GorAb |
$B$47 |
Producing GOR at abandonment, scf/STB |
OF_GorPeak |
$B$48 |
Highest producing GOR, scf/STB |
OF_SoAb |
$B$49 |
Oil saturation at abandonment, % |
OF_pGor |
$B$50 |
Highest pressure step whose GOR passes the limit, psi |
OF_RFGor |
$B$51 |
Recovery factor before the GOR passes the limit, % |
OF_Move |
$B$52 |
Largest GOR change in the third pass, % |
OF_RangeCheck |
$B$53 |
Pressure-range check verdict |
OF_RangeCheckNote |
$C$53 |
Pressure-range check comment |
OF_GasCheck |
$B$54 |
Gas-handling check verdict |
OF_GasCheckNote |
$C$54 |
Gas-handling check comment |
OF_PassCheck |
$B$55 |
Convergence check verdict |
OF_PassCheckNote |
$C$55 |
Convergence check comment |
OF_Results |
$B$42:$B$55 |
Recovery at Pb and at abandonment, Np, Gp, Rp, the GOR at abandonment and its peak, So, the GOR limit and the three checks |
OF_Pvt |
$A$63:$K$75 |
Each step's pressure, Z, Rs, Bo, Bg, oil and gas viscosity, Eo, Et and Tracy's Φo and Φg |
OF_Forecast |
$A$80:$L$92 |
Each step's three passes on ΔNp and the GOR, its Np, Gp, So, producing GOR, recovery and the last pass's GOR change |
Details
| Inserts | 92 rows × 12 columns |
| Category | Material Balance Equation |
| For agents and tools | Descriptor (.md) |