Production Back-Allocation by Well Test and Uptime
Description
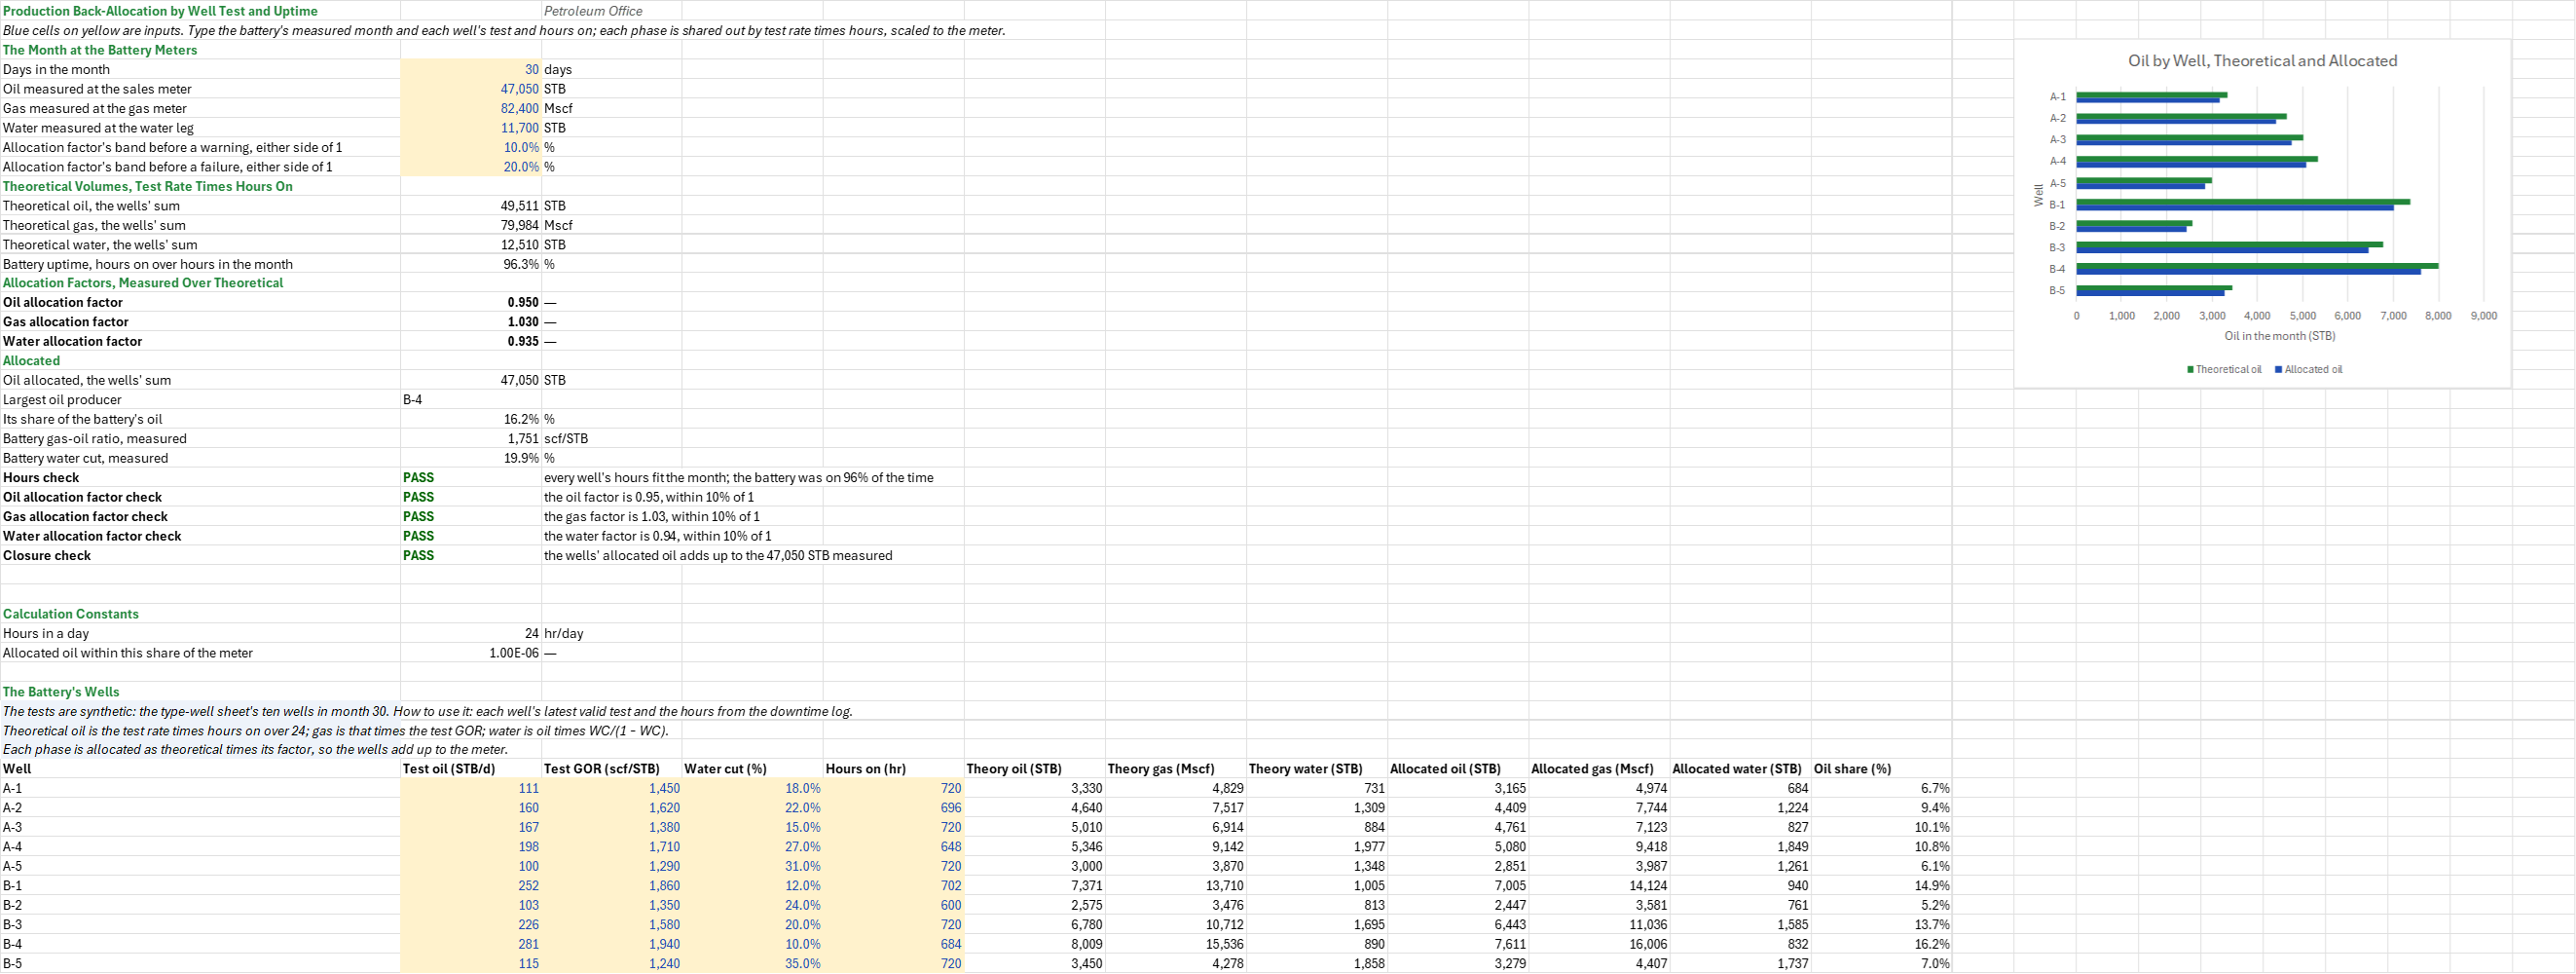
How much did each well make last month, when only the battery is metered? You enter the oil, gas and water measured at the battery for the month, and each well's latest test (oil rate, gas-oil ratio, water cut) and its hours on. You read off each phase's allocation factor, each well's allocated oil, gas and water and its share of the oil, the battery's uptime, measured GOR and water cut, and the largest producer.
Parameters:
- The month: the days in it
ALC_Days, and the oilALC_OilMeas(STB), gasALC_GasMeas(Mscf) and waterALC_WatMeas(STB) measured at the battery - Bands: the allocation factor's warning band
ALC_TolWarnand failure bandALC_TolFail, either side of 1 - Wells: each well's test oil rate (STB/d), test GOR (scf/STB), water cut (a fraction of the liquid) and hours on in the month
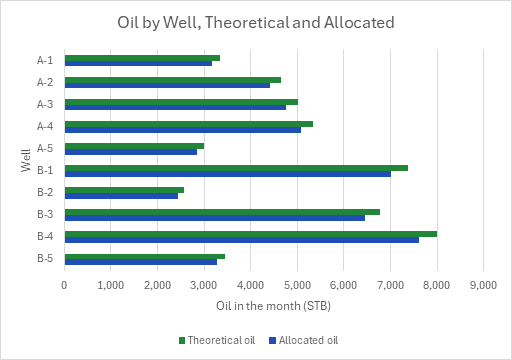
How to use it: Use each well's latest valid test, one taken at the choke and line pressure it produced at that month, and the hours from the downtime log, not the calendar. Take the measured volumes from the sales or LACT meter and the battery's gas and water meters, corrected for tank inventory change and any fuel, flare and lease use, or the factors carry those too. Five checks read the hours against the month, each factor against the warning and failure bands, and the allocated oil against the meter; a factor outside its band says to retest the wells or check the meter. A chart sets each well's theoretical oil beside its allocated oil.
Method: Each well's theoretical volume is its test rate times its hours; each phase's allocation factor is the measured total over the wells' theoretical sum; and each well is allocated its theoretical volume times that factor, so the wells add up to the meter. A well's theoretical oil is its test oil rate times its hours on over 24; its theoretical gas is that oil times the test GOR over 1,000; its theoretical water is that oil times WC/(1 − WC). A well's share of the oil is its allocated oil over the measured. The uptime is the wells' hours over the wells times 24 times the days. The measured GOR is the gas over the oil, and the water cut the water over the liquid.
Example: The default battery is the Type Well Curves sheet's ten wells in their calendar month 30, a 30-day month: each well's test oil rate is its rate that month (100 to 281 STB/d). The GORs (1,240 to 1,940 scf/STB), water cuts (10 to 35 %) and hours on (600 to 720) are made up. The battery measured 47,050 STB of oil, 82,400 Mscf of gas and 11,700 STB of water. A factor within 10 % of 1 passes and one past 20 % fails.
The wells were on 6,930 of 7,200 hours, 96.25 %. Their tests add up to 49,510.5 STB of oil, 79,984 Mscf of gas and 12,509.7 STB of water in the month. The oil factor is 47,050/49,510.5 = 0.9503, the gas factor 82,400/79,984 = 1.0302 and the water factor 11,700/12,509.7 = 0.9353, all within 10 % of 1. B-4 tested 281 STB/d over 684 hours, 8,008.5 STB in theory, and is allocated 8,008.5 × 0.9503 = 7,610.5 STB, 16.2 % of the battery, the largest. The allocated oil adds up to the 47,050 STB measured. The battery's measured GOR is 1,751 scf/STB and its water cut 19.9 %.
Functions used
None: the blueprint calculates with Excel's own functions.
Names (42)
| Name | Refers to | Comment |
|---|---|---|
ALC_Days |
$B$4 |
Days in the month, days |
ALC_OilMeas |
$B$5 |
Oil measured at the sales meter, STB |
ALC_GasMeas |
$B$6 |
Gas measured at the gas meter, Mscf |
ALC_WatMeas |
$B$7 |
Water measured at the water leg, STB |
ALC_TolWarn |
$B$8 |
Allocation factor's band before a warning, either side of 1, % |
ALC_TolFail |
$B$9 |
Allocation factor's band before a failure, either side of 1, % |
ALC_Inputs |
$B$4:$B$9 |
The days in the month, the oil, gas and water measured at the battery, and the allocation factor's warning and failure bands |
ALC_OilTheo |
$B$11 |
Theoretical oil, the wells' sum, STB |
ALC_GasTheo |
$B$12 |
Theoretical gas, the wells' sum, Mscf |
ALC_WatTheo |
$B$13 |
Theoretical water, the wells' sum, STB |
ALC_Uptime |
$B$14 |
Battery uptime, hours on over hours in the month, % |
ALC_OilAF |
$B$16 |
Oil allocation factor |
ALC_GasAF |
$B$17 |
Gas allocation factor |
ALC_WatAF |
$B$18 |
Water allocation factor |
ALC_OilAlloc |
$B$20 |
Oil allocated, the wells' sum, STB |
ALC_Top |
$B$21 |
Largest oil producer |
ALC_TopShare |
$B$22 |
Its share of the battery's oil, % |
ALC_Gor |
$B$23 |
Battery gas-oil ratio, measured, scf/STB |
ALC_WaterCut |
$B$24 |
Battery water cut, measured, % |
ALC_HoursCheck |
$B$25 |
Hours check verdict |
ALC_HoursCheckNote |
$C$25 |
Hours check comment |
ALC_OilCheck |
$B$26 |
Oil allocation factor check verdict |
ALC_OilCheckNote |
$C$26 |
Oil allocation factor check comment |
ALC_GasCheck |
$B$27 |
Gas allocation factor check verdict |
ALC_GasCheckNote |
$C$27 |
Gas allocation factor check comment |
ALC_WatCheck |
$B$28 |
Water allocation factor check verdict |
ALC_WatCheckNote |
$C$28 |
Water allocation factor check comment |
ALC_CloseCheck |
$B$29 |
Closure check verdict |
ALC_CloseCheckNote |
$C$29 |
Closure check comment |
ALC_Results |
$B$11:$B$29 |
The theoretical oil, gas and water, the battery's uptime, the three allocation factors, the oil allocated, the largest producer and its share, the battery's measured gas-oil ratio and water cut, and the five checks |
ALC_HrDay |
$B$33 |
Hours in a day, hr/day |
ALC_CloseTol |
$B$34 |
Allocated oil within this share of the meter |
ALC_Battery |
$A$41:$L$50 |
Each well's test oil rate, GOR and water cut and its hours on, its theoretical oil, gas and water, its allocated oil, gas and water, and its share of the oil |
ALC_Wells |
$A$41:$A$50 |
The wells' names |
ALC_Hours |
$E$41:$E$50 |
Hours each well was on in the month |
ALC_OilT |
$F$41:$F$50 |
Each well's theoretical oil, STB |
ALC_GasT |
$G$41:$G$50 |
Each well's theoretical gas, Mscf |
ALC_WatT |
$H$41:$H$50 |
Each well's theoretical water, STB |
ALC_OilA |
$I$41:$I$50 |
Each well's allocated oil, STB |
ALC_GasA |
$J$41:$J$50 |
Each well's allocated gas, Mscf |
ALC_WatA |
$K$41:$K$50 |
Each well's allocated water, STB |
ALC_Share |
$L$41:$L$50 |
Each well's share of the battery's oil |
Details
| Inserts | 50 rows × 12 columns |
| Category | Field Production Profile |
| For agents and tools | Descriptor (.md) |