Production Sharing Contract Fiscal Model
Description
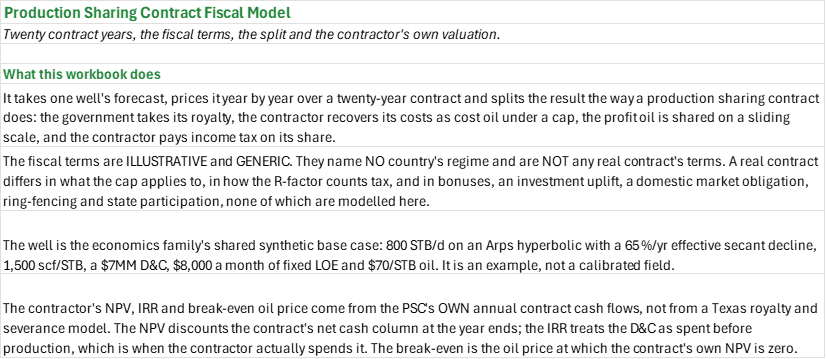
How does a production sharing contract divide one well's revenue, and what is left for the contractor? You enter the well's type curve, prices and costs and the contract's royalty, cost-recovery cap, profit-split tiers and income tax. You read off the split year by year over a twenty-year term (cost oil, profit oil, tax and government take) and the contractor's NPV, IRR and break-even oil price from the contract's own annual cash flows.
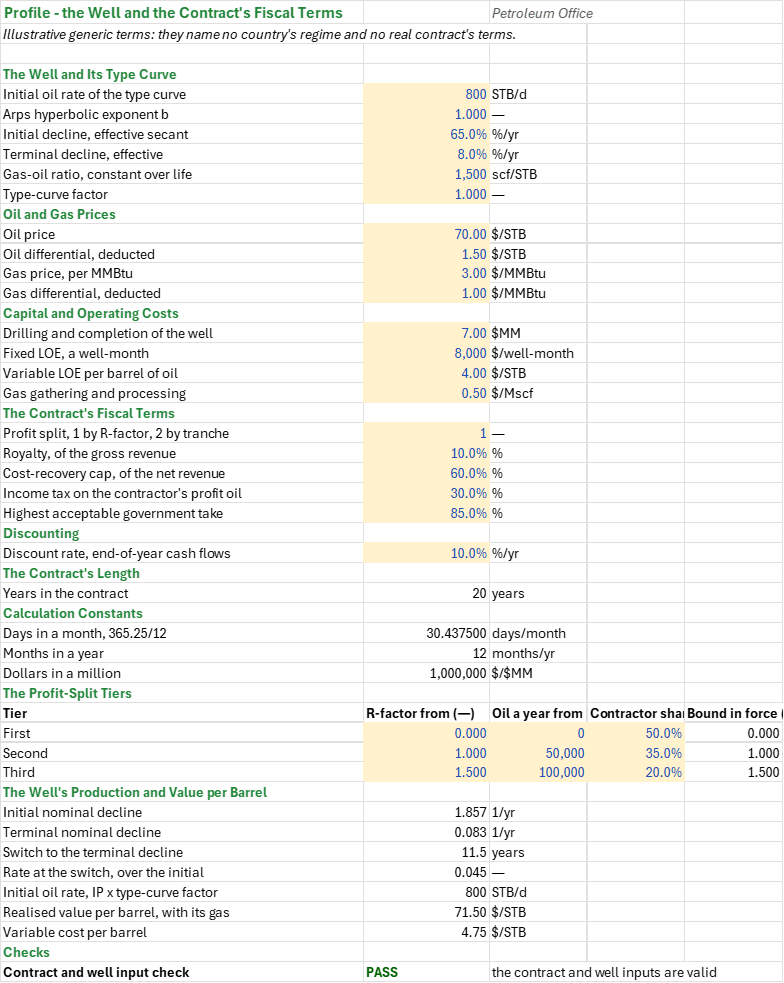
How to use it: Replace the Profile sheet's well, its prices and costs and its terms with a field's own forecast and a real contract's terms, including the three rows of the profit-split tier table. Read the Contract sheet's split year by year and the Valuation sheet's NPV, IRR and break-even, then the Summary's headlines with its checks: they catch an out-of-range term or a tier table that does not descend, a contractor who loses money or a government take above the contract's limit, costs that are never recovered, and a search for the IRR or the break-even that finds no root.
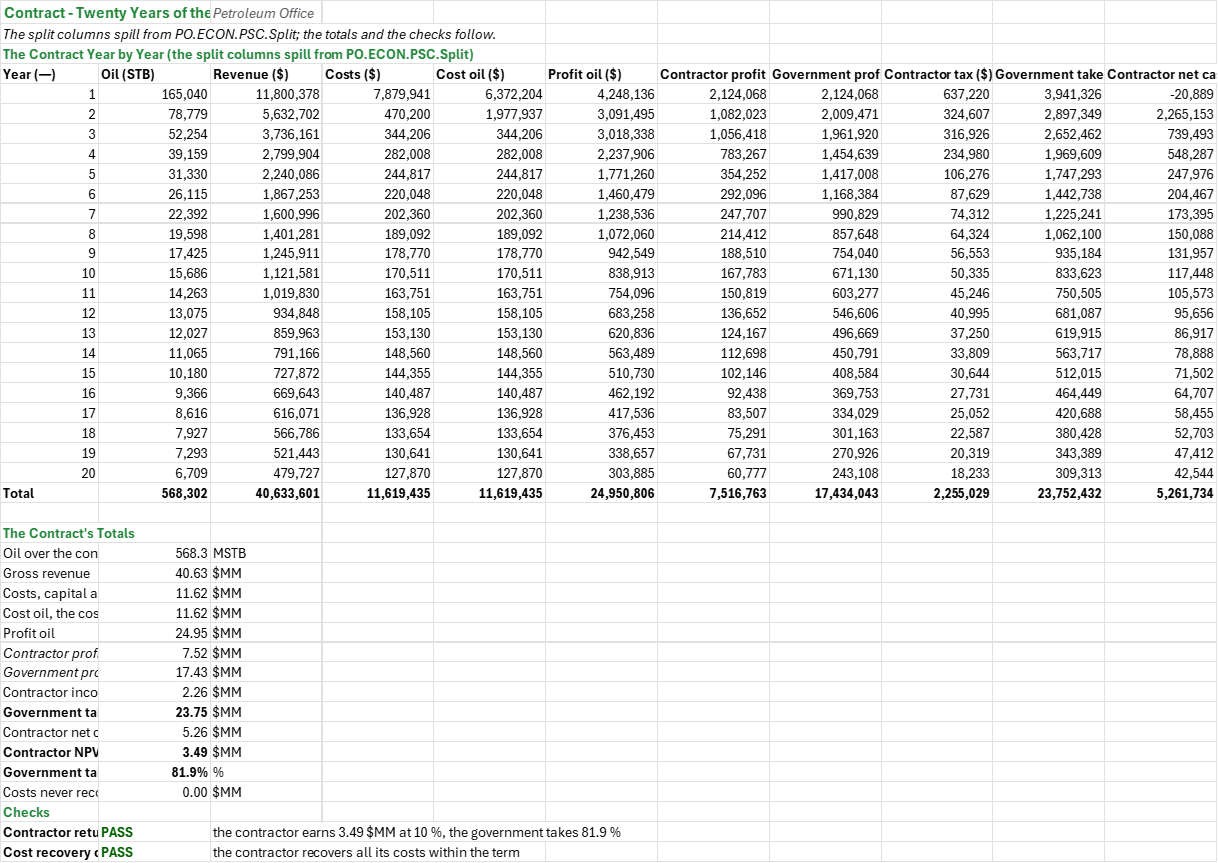
Method: Each contract year's oil is the sum of its twelve mid-month rates on the type curve times 30.4375 days. The value per barrel is the oil price less its differential plus GOR/1000 times the gas price less its differential, and the year's costs are the D&C in year 1 plus 12 months of fixed LOE plus the variable LOE and GOR/1000 times the gathering cost per barrel of oil. The split takes the revenue R = oil × value per barrel, takes the royalty, recovers the costs as cost oil under the cap with the excess carried forward, splits the profit oil on the tiers (by R-factor or by yearly production tranche), taxes the contractor's share, and returns the cost oil, the profit oil, the two shares, the tax, the government take and the contractor's net cash.
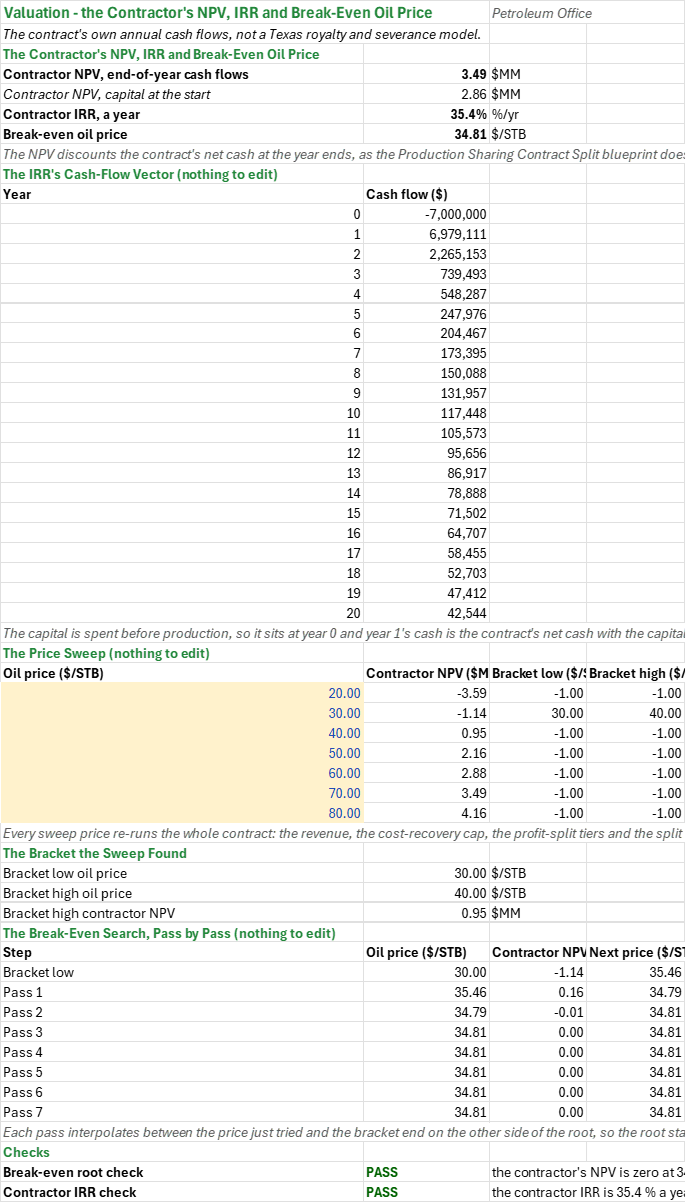
The contractor's NPV discounts that net-cash column at the year ends with Excel's NPV, the same convention as the PSC split blueprint, so the workbook and the blueprint give the same number. The IRR reads a cash-flow vector with Excel's IRR: the capital at year 0, because the cost-recovery cap leaves the first year almost cash-neutral and the contractor spends the D&C before production, and the contract's own net cash in the years after it. The IRR is the rate at which that vector's NPV is zero; a cash flow with no root reads n/a.
The break-even is the oil price at which the contract's own NPV is zero. A sweep reprices the whole contract at seven prices from $20 to $80/STB (the revenue, the cost-recovery cap, the profit-split tiers and the split all move with the price), and eight passes close in on the bracket the sweep found. The cell reads the last pass's price; a sweep with no sign change reads n/a.
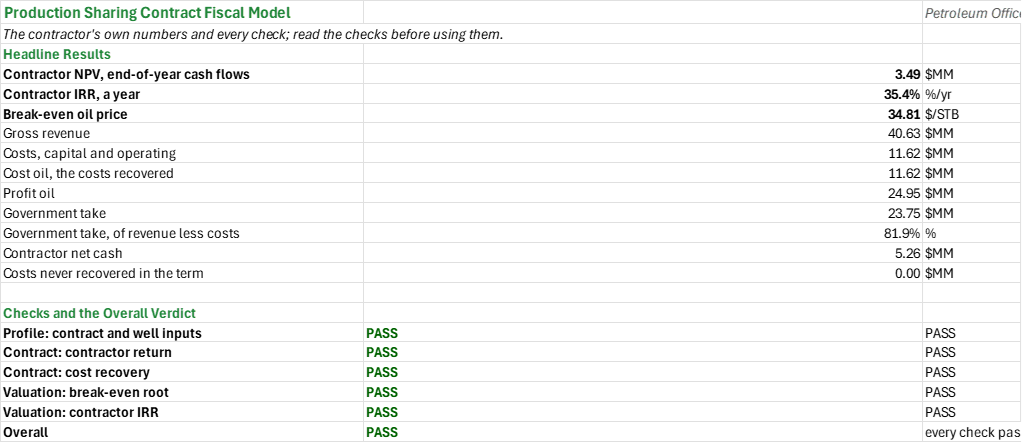
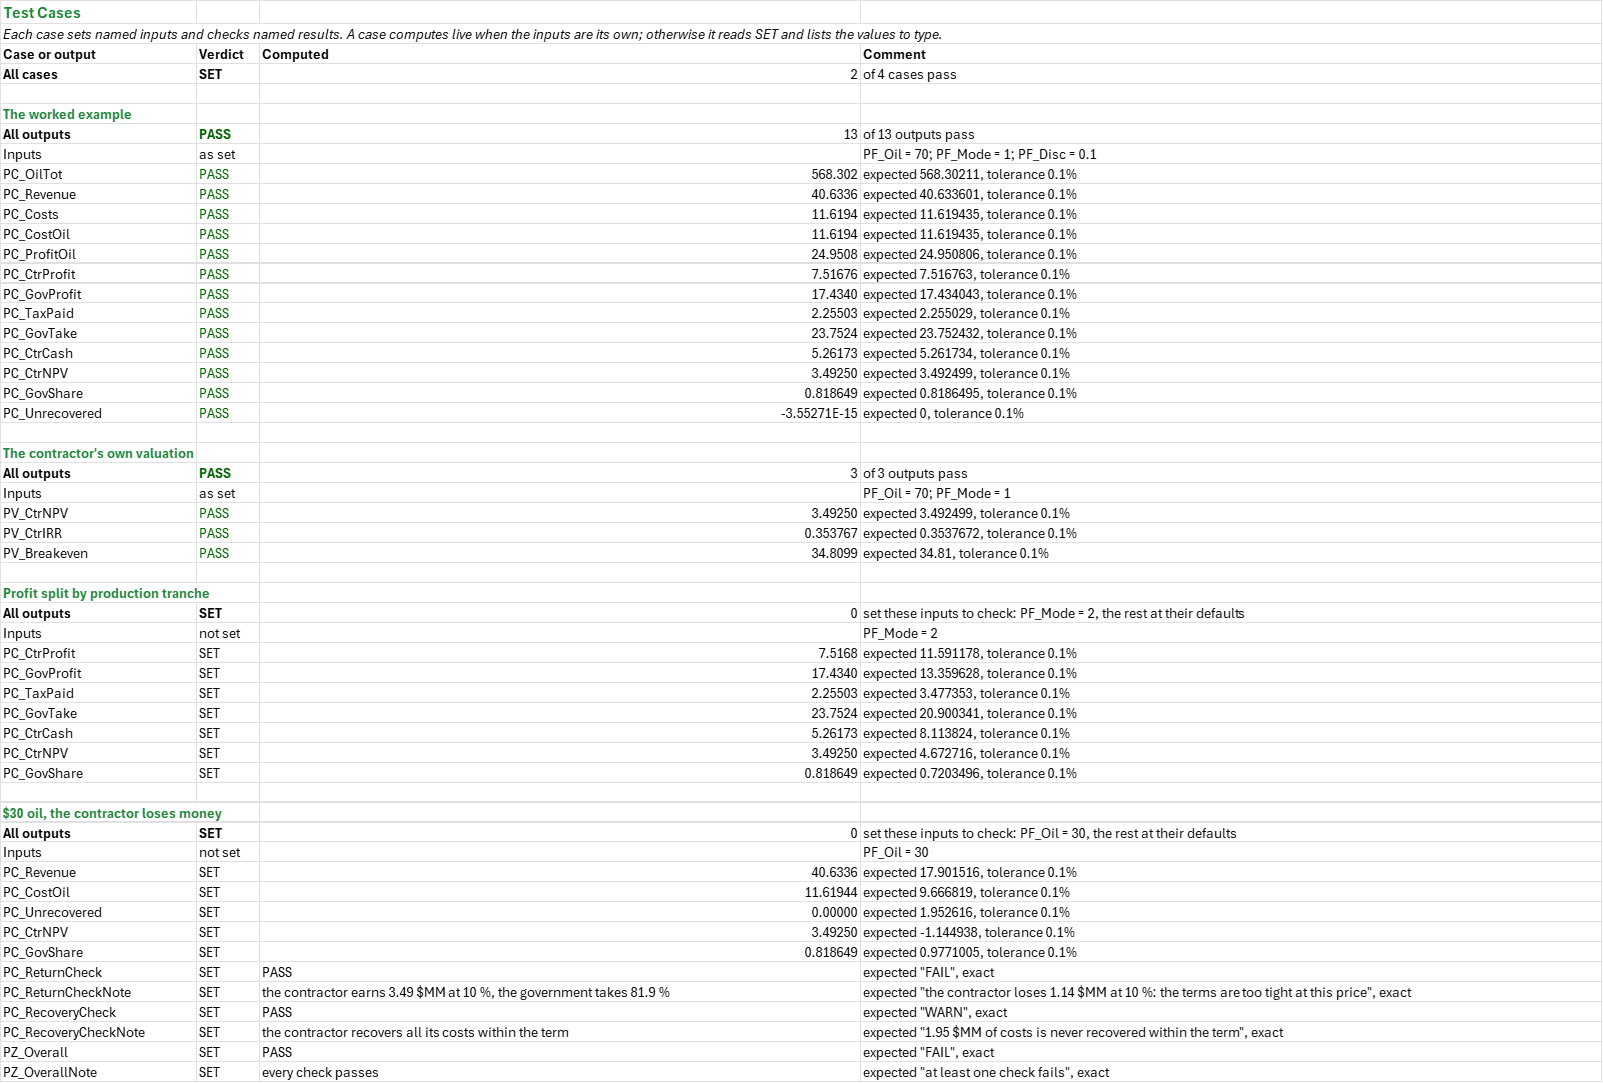
Example: The economics family's shared synthetic well makes 568.3 MSTB over the twenty years and $40.63MM of revenue against $11.62MM of costs, all of it recovered as cost oil. The profit oil is $24.95MM: the contractor keeps $7.52MM, the government takes $17.43MM, and the contractor's income tax is $2.26MM. With the $4.06MM royalty the government takes $23.75MM, 81.9 % of the $29.01MM of revenue less costs. The contractor nets $5.26MM, an NPV of $3.49MM at 10 %, an IRR of 35.4 % with the D&C spent before production. The break-even oil price is $34.81/STB. Split by production tranche instead of by R-factor, the contractor's NPV is $4.67MM, its net cash $8.11MM and the government's take 72.0 %. At $30 oil the cap leaves $1.95MM of costs unrecovered and the contractor loses $1.14MM: the terms are too tight at that price.
Validity
The fiscal terms are illustrative and generic. They name no country's regime, they are not any real contract's terms, and they differ between countries in what the cap applies to and in how the R-factor counts tax: check the contract. There are no bonuses, no domestic market obligation, no investment uplift, no depreciation schedule for the income tax, no ring-fencing and no state participation.
The NPV, the IRR and the break-even oil price come from the PSC's own annual contract cash flows and the contractor's net cash. A Texas royalty and severance model is a different model with different numbers: the NPV and IRR blueprint (po.bp.econ.npv.irr) values the same well under a 25 % royalty, Texas severance and ad valorem taxes and a monthly cash flow, and its $34.09/STB break-even is not this contract's break-even. The discounting and the search for a root follow the NPV and IRR and the break-even price blueprints; the split's numbers are the PSC split blueprint's.
The well is produced for the whole twenty-year term. An economic-limit cut-off, an early relinquishment, a second well and any change of the price deck are not modelled, and the workbook holds one well, not a programme. A contract whose cash flow never changes sign reads n/a for the IRR rather than a spurious rate. The break-even is the last of eight passes; a contract whose sweep never changes sign has none, and the cell reads n/a.
References
- Johnston, D. (1994). International Petroleum Fiscal Systems and Production Sharing Contracts. PennWell.
- Johnston, D. (2003). International Exploration Economics, Risk, and Contract Analysis. PennWell.
- Mian, M.A. (2011). Project Economics and Decision Analysis, Vol. 1, 2nd ed. PennWell (fiscal terms and the contractor's cash flow).
- Arps, J.J. (1945). Analysis of Decline Curves. Trans. AIME 160, 228-247.
- Petroleum Office blueprints
po.bp.econ.psc.split,po.bp.econ.npv.irr,po.bp.econ.breakeven.price.
Inputs
| Input | Unit | Default | Name |
|---|---|---|---|
| Initial oil rate of the type curve | STB/d | 800 | PF_IP |
| Arps hyperbolic exponent b | — | 1 | PF_b |
| Initial decline, effective secant | %/yr | 65 % | PF_Dei |
| Terminal decline, effective | %/yr | 8 % | PF_Dterm |
| Gas-oil ratio, constant over life | scf/STB | 1,500 | PF_GOR |
| Type-curve factor | — | 1 | PF_TC |
| Oil price | $/STB | 70 | PF_Oil |
| Oil differential, deducted | $/STB | 1.5 | PF_OilDiff |
| Gas price, per MMBtu | $/MMBtu | 3 | PF_Gas |
| Gas differential, deducted | $/MMBtu | 1 | PF_GasDiff |
| Drilling and completion of the well | $MM | 7 | PF_DC |
| Fixed LOE, a well-month | $/well-month | 8,000 | PF_LOE |
| Variable LOE per barrel of oil | $/STB | 4 | PF_LOEVar |
| Gas gathering and processing | $/Mscf | 0.5 | PF_Gath |
| Profit split, 1 by R-factor, 2 by tranche | — | 1 | PF_Mode |
| Royalty, of the gross revenue | % | 10 % | PF_Roy |
| Cost-recovery cap, of the net revenue | % | 60 % | PF_CostCap |
| Income tax on the contractor's profit oil | % | 30 % | PF_Tax |
| Highest acceptable government take | % | 85 % | PF_TakeMax |
| Discount rate, end-of-year cash flows | %/yr | 10 % | PF_Disc |
| Profit-split tiers: R-factor from, oil a year from, contractor share | —, STB, % | 0, 0, 50 %; 1, 50,000, 35 %; 1.5, 100,000, 20 % | PF_Shares, PF_Limits |
The tier table's last column is the bound the split mode puts in force (PF_Limits): the R-factors in mode 1, the yearly oil in mode 2; PF_Shares holds the contractor's shares.
Sheets
Guide— what the workbook does, why its fiscal terms are illustrative, the base-case well and how the contractor is valued.Profile— the well's type curve, prices and costs, the contract's fiscal terms and discount rate, the profit-split tier table, and the decline terms, initial rate and value per barrel they give, with the input check.Contract— the twenty contract years, one row a year: oil, revenue and costs, then cost oil, profit oil, the contractor's and the government's profit oil, the contractor's tax, the government take and the contractor's net cash, with the totals and the return and cost-recovery checks.Valuation— the contractor's NPV, IRR and break-even oil price, the IRR's cash-flow vector, the seven-price sweep, the bracket it found and the break-even search pass by pass.Summary— the headline results and every check under one verdict.Test Cases— the worked example and other cases, with expected and computed results.
Functions used
Names (86)
| Name | Refers to | Comment |
|---|---|---|
PO.ECON.PSC.SplitLAMBDA |
=LAMBDA(Mode, Gross, Price, Cost, Royalty, CostCap, Tax, Limits, Shares, Output, LET(rev, Gross*Price, roy, Royalty*rev, net, rev-roy, capv, CostCap*net, cumc, SCAN(0, Cost, LAMBDA(run_c, val_c, run_c+val_c)), cumcap, SCAN(0, capv, LAMBDA(run_k, val_k, run_k+val_k)), rec, cumcap+SCAN(0, cumc-cumcap, LAMBDA(low_r, val_r, MIN(low_r, val_r))), recprev, cumcap-capv+SCAN(0, cumc-Cost-cumcap+capv, LAMBDA(low_p, val_p, MIN(low_p, val_p))), costoil, rec-recprev, profit, net-costoil, tier, SCAN(0, Shares, LAMBDA(run_t, val_t, run_t+1)), ds, Shares-SCAN(0, tier, LAMBDA(run_d, tier_d, SUM((tier=tier_d-1)*Shares))), ix, SCAN(0, Gross, LAMBDA(run_i, val_i, run_i+1)), tranche, SCAN(0, ix, LAMBDA(run_q, per_q, LET(g, SUM((ix=per_q)*Gross), IF(g>0, SUM((g-Limits>0)*(g-Limits)*ds)/g, 0)))), receipts, SCAN(0, ix, LAMBDA(run_x, per_x, LET(cprev, SUM((ix<per_x)*Cost), rf, IF(cprev>0, run_x/cprev, 0), run_x+SUM((ix=per_x)*(costoil+SUM(ds*(rf>=Limits))*profit))))), back, SCAN(0, ix, LAMBDA(run_b, per_b, SUM((ix=per_b-1)*receipts))), cpo, CHOOSE(Mode, receipts-back-costoil, tranche*profit), gpo, profit-cpo, tx, Tax*cpo, govtake, roy+gpo+tx, ncf, costoil+cpo-tx-Cost, share, SCAN(0, govtake, LAMBDA(run_g, val_g, run_g+val_g))/SCAN(0, rev-Cost, LAMBDA(run_v, val_v, run_v+val_v)), CHOOSE(Output, costoil, profit, cpo, gpo, tx, govtake, ncf, share))) |
Production sharing contract split per period: cost oil under a cap with carry-forward, profit oil by R-factor (Mode 1) or production tranche (Mode 2), tax and takes |
PC_Cost |
Contract!$D$5:$D$24 |
The contract's recoverable costs, capital and operating, one row a year, $ |
PC_CostOil |
Contract!$B$31 |
|
PC_Costs |
Contract!$B$30 |
|
PC_CtrCash |
Contract!$B$37 |
|
PC_CtrNPV |
Contract!$B$38 |
|
PC_CtrProfit |
Contract!$B$33 |
|
PC_GovProfit |
Contract!$B$34 |
|
PC_GovShare |
Contract!$B$39 |
|
PC_GovTake |
Contract!$B$36 |
|
PC_Gross |
Contract!$B$5:$B$24 |
The contract's oil, one row a year, STB |
PC_OilTot |
Contract!$B$28 |
|
PC_ProfitOil |
Contract!$B$32 |
|
PC_RecoveryCheck |
Contract!$B$43 |
Cost recovery check verdict |
PC_RecoveryCheckNote |
Contract!$C$43 |
|
PC_Results |
Contract!$B$28:$B$43 |
The contract's oil, revenue, costs, cost oil, profit oil, the two profit-oil shares, the tax, the government take, the contractor's cash and NPV, and two checks |
PC_ReturnCheck |
Contract!$B$42 |
Contractor return check verdict |
PC_ReturnCheckNote |
Contract!$C$42 |
|
PC_Revenue |
Contract!$B$29 |
|
PC_TaxPaid |
Contract!$B$35 |
|
PC_Unrecovered |
Contract!$B$40 |
|
PF_CostCap |
Profile!$B$24 |
Cost-recovery cap, of the net revenue, % |
PF_DC |
Profile!$B$17 |
Drilling and completion of the well, $MM |
PF_Days |
Profile!$B$32 |
|
PF_Dei |
Profile!$B$7 |
Initial decline, effective secant, %/yr |
PF_Di |
Profile!$B$41 |
|
PF_Disc |
Profile!$B$28 |
Discount rate, end-of-year cash flows, %/yr |
PF_Dt |
Profile!$B$42 |
|
PF_Dterm |
Profile!$B$8 |
Terminal decline, effective, %/yr |
PF_GOR |
Profile!$B$9 |
Gas-oil ratio, constant over life, scf/STB |
PF_Gas |
Profile!$B$14 |
Gas price, per MMBtu, $/MMBtu |
PF_GasDiff |
Profile!$B$15 |
Gas differential, deducted, $/MMBtu |
PF_Gath |
Profile!$B$20 |
Gas gathering and processing, $/Mscf |
PF_IP |
Profile!$B$5 |
Initial oil rate of the type curve, STB/d |
PF_InputCheck |
Profile!$B$49 |
Contract and well input check verdict |
PF_InputCheckNote |
Profile!$C$49 |
|
PF_Inputs |
Profile!$B$5:$B$28 |
The well's type curve, oil and gas prices, D&C and operating costs, the contract's split mode, royalty, cost-recovery cap, tax and take limit, and the discount rate |
PF_LOE |
Profile!$B$18 |
Fixed LOE, a well-month, $/well-month |
PF_LOEVar |
Profile!$B$19 |
Variable LOE per barrel of oil, $/STB |
PF_Limits |
Profile!$E$37:$E$39 |
The tiers' lower bounds in force: R-factors in mode 1, yearly oil in mode 2 |
PF_MoYr |
Profile!$B$33 |
|
PF_Mode |
Profile!$B$22 |
Profit split, 1 by R-factor, 2 by tranche |
PF_Oil |
Profile!$B$12 |
Oil price, $/STB |
PF_OilDiff |
Profile!$B$13 |
Oil differential, deducted, $/STB |
PF_OpexVar |
Profile!$B$47 |
|
PF_PerMM |
Profile!$B$34 |
|
PF_Price |
Profile!$B$46 |
|
PF_Qi |
Profile!$B$45 |
|
PF_Qs |
Profile!$B$44 |
|
PF_Results |
Profile!$B$41:$B$47 |
The decline terms, the initial rate, the realised value per barrel and the variable cost per barrel |
PF_Roy |
Profile!$B$23 |
Royalty, of the gross revenue, % |
PF_Shares |
Profile!$D$37:$D$39 |
The contractor's share of the profit oil in each tier |
PF_TC |
Profile!$B$10 |
Type-curve factor |
PF_TakeMax |
Profile!$B$26 |
Highest acceptable government take, % |
PF_Tax |
Profile!$B$25 |
Income tax on the contractor's profit oil, % |
PF_Tiers |
Profile!$A$37:$E$39 |
Each tier's R-factor and yearly oil lower bounds, the contractor's share of the profit oil, and the bound the split mode puts in force |
PF_Ts |
Profile!$B$43 |
|
PF_Years |
Profile!$B$30 |
|
PF_b |
Profile!$B$6 |
Arps hyperbolic exponent b |
PV_BreakEvenSearch |
Valuation!$A$49:$D$56 |
The break-even search: the bracket the sweep found, then a pass a row that interpolates between the price tried and the bracket end on the other side of the root |
PV_Breakeven |
Valuation!$B$7 |
|
PV_CtrIRR |
Valuation!$B$6 |
|
PV_CtrNPV |
Valuation!$B$4 |
|
PV_CtrNPVCap |
Valuation!$B$5 |
|
PV_IrrCheck |
Valuation!$B$60 |
Contractor IRR check verdict |
PV_IrrCheckNote |
Valuation!$C$60 |
|
PV_IrrVector |
Valuation!$A$11:$B$31 |
The IRR's cash flow: the capital at year 0, then the contract's own net cash a year |
PV_Results |
Valuation!$B$4:$B$7 |
The contractor's NPV, IRR and break-even oil price |
PV_RootCheck |
Valuation!$B$59 |
Break-even root check verdict |
PV_RootCheckNote |
Valuation!$C$59 |
|
PV_Sweep |
Valuation!$A$35:$D$41 |
Oil prices, the contractor's NPV at each with the whole contract re-split, and the bracket the sign change gives |
PZ_Breakeven |
Summary!$B$6 |
Break-even oil price, $/STB |
PZ_Checks |
Summary!$B$17:$B$22 |
Every named check and the overall verdict |
PZ_CostOil |
Summary!$B$9 |
Cost oil, the costs recovered, $MM |
PZ_Costs |
Summary!$B$8 |
Costs, capital and operating, $MM |
PZ_CtrCash |
Summary!$B$13 |
Contractor net cash, $MM |
PZ_CtrIRR |
Summary!$B$5 |
Contractor IRR, a year, %/yr |
PZ_CtrNPV |
Summary!$B$4 |
Contractor NPV, end-of-year cash flows, $MM |
PZ_GovShare |
Summary!$B$12 |
Government take, of revenue less costs, % |
PZ_GovTake |
Summary!$B$11 |
Government take, $MM |
PZ_Overall |
Summary!$B$22 |
Overall verdict |
PZ_OverallNote |
Summary!$C$22 |
Overall comment |
PZ_ProfitOil |
Summary!$B$10 |
Profit oil, $MM |
PZ_Results |
Summary!$B$4:$B$14 |
The contractor's NPV, IRR and break-even oil price, the contract's revenue, costs, cost oil, profit oil, the government take and the contractor's net cash |
PZ_Revenue |
Summary!$B$7 |
Gross revenue, $MM |
PZ_Unrecovered |
Summary!$B$14 |
Costs never recovered in the term, $MM |
Details
| Opens in | Needs Microsoft 365 or Excel 2024: it uses functions Excel 2016 doesn't have, such as named LAMBDAs, which show #NAME? there. |
| File | PscFiscalModel.xlsx, 36 KB |
| Category | Economics |
| For agents and tools | Descriptor (.md) |